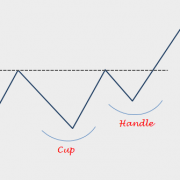
CUP & HANDLE (CONTINUATION)
Every week Tech Charts Global Equity Markets report features some of the well-defined, mature classical chart patterns under a lengthy watchlist and the chart pattern breakout signals that took place during that week. Global Equity Markets report covers single stocks from developed, emerging and frontier markets, ETF’s and global equity indices. The report starts with a review section that highlights the important chart developments on global equity benchmarks. This blog post features from the watchlist section a bullish continuation cup & handle chart pattern opportunity, listed on the Nasdaq Stock Exchange.
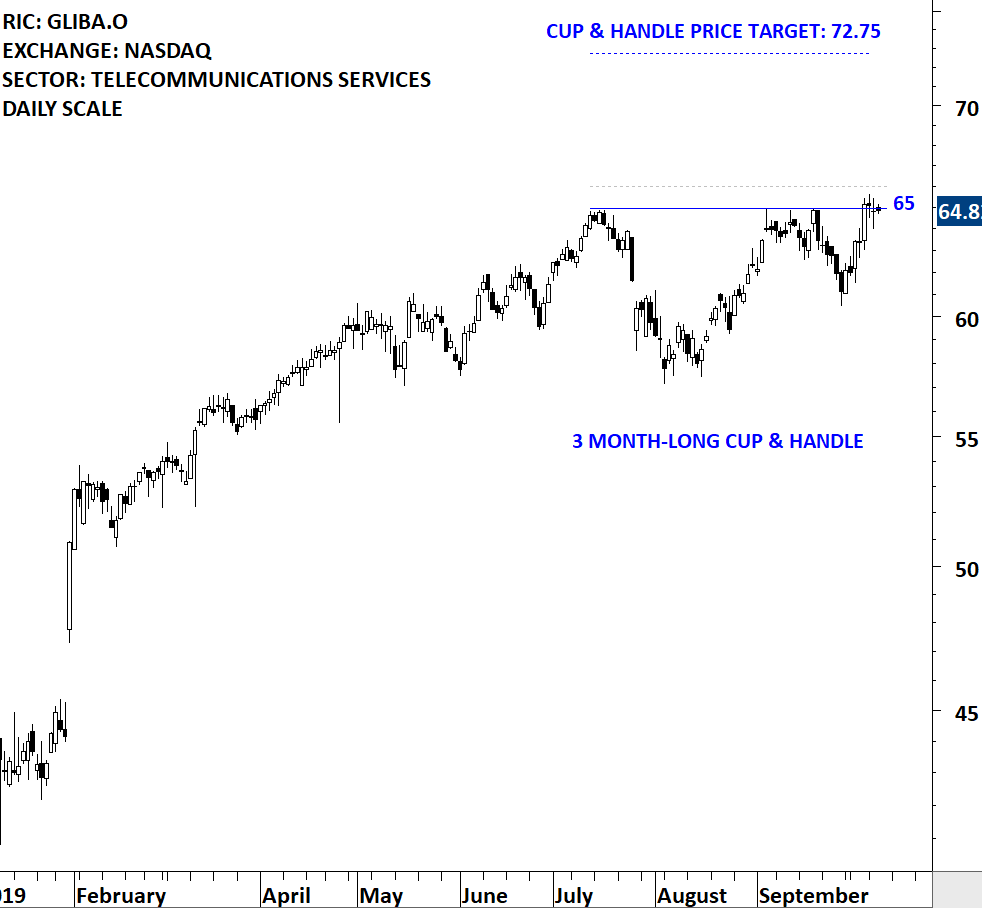
GCI LIBERTY INC (GLIBA.O)
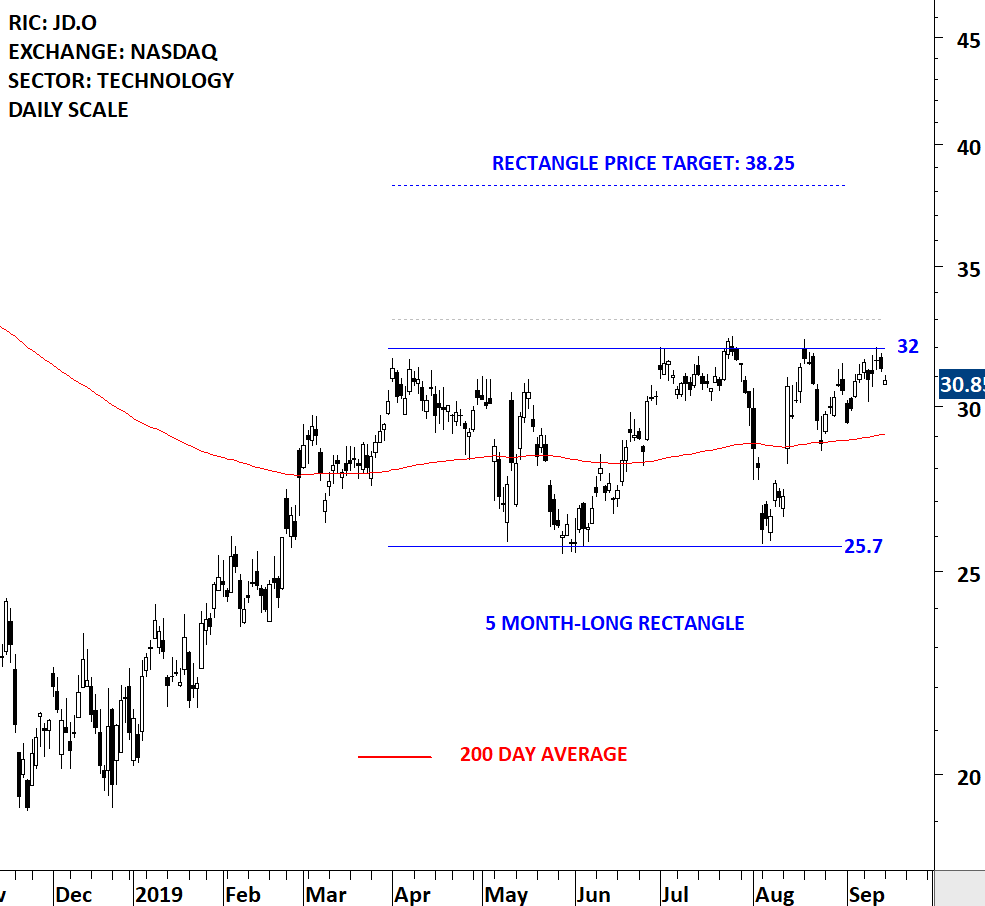
GCI Liberty, Inc., formerly General Communication, Inc., is a holding company. The Company, together with its subsidiaries, is a communications provider with operations primarily in the State of Alaska. The Company provides a range of wireless, data, video, voice and managed services to residential customers, businesses, governmental entities, and educational and medical institutions primarily in Alaska under its GCI brand. The stock is listed on the Nasdaq Stock Exchange. Price chart formed a 3 month-long cup & handle continuation with the horizontal boundary acting as strong resistance at 65.00 levels. The horizontal boundary was tested several times over the course of the chart pattern. A daily close above 66.00 levels will confirm the breakout from the 3 month-long cup & handle continuation with the possible chart pattern price target of 72.75 levels. Breakout can push the stock to all-time highs. Data as of 10:30 am October 9, 2019
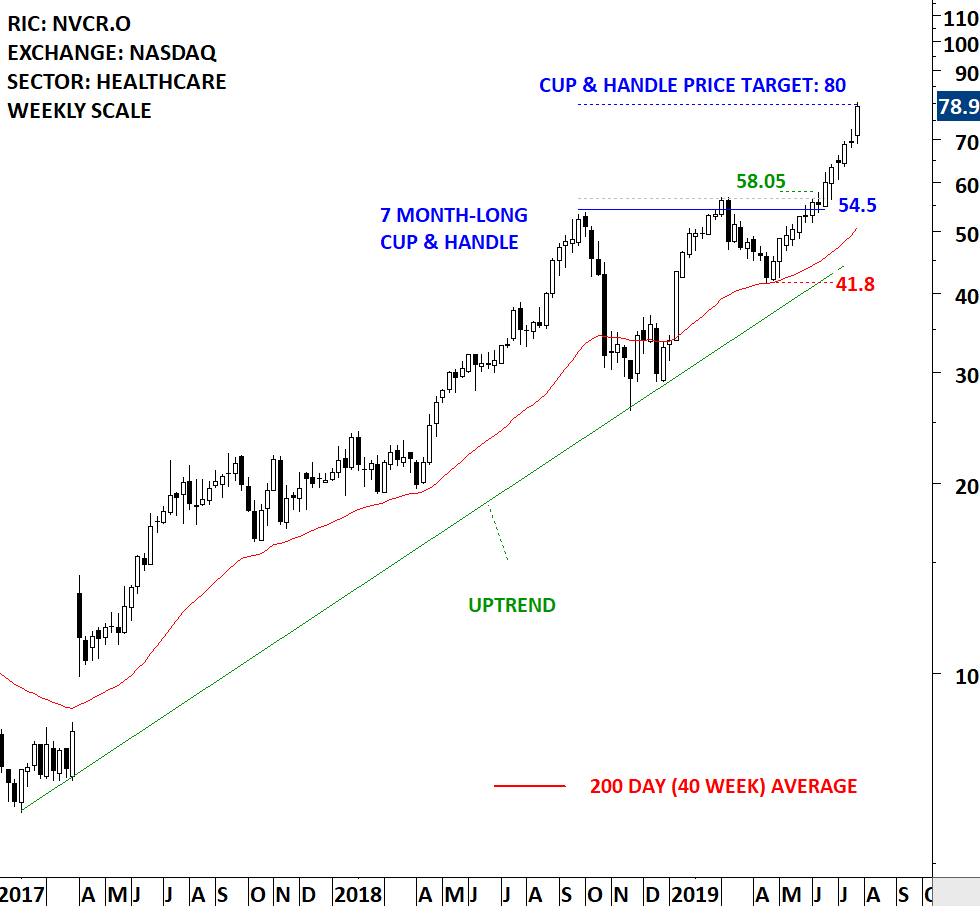
A recent breakout alert was issued in the Global Equity Markets report covering a similar cup & handle breakout opportunity on Novocure. The weekly scale price chart featured a 7 month-long cup & handle that broke out to all-time highs. Breakout to all-time highs from bullish continuation chart patterns is the path of least resistance. Similar chart patterns can form on daily, weekly and monthly scale price charts. The underlying dynamics are the same. Though it is important to note that the shorter the time frame the higher the probability of failure. My default time frame for research is weekly scale. I also look at chart patterns on daily scale.
Tech Charts Membership

By becoming a Premium Member, you’ll be able to improve your knowledge of the principles of classical charting.
With this knowledge, you can merge them with your investing system. In fact, some investors use my analyses to modify their existing style to invest more efficiently and successfully.

As a Premium Member of Aksel Kibar’s Tech Charts,
You will receive:
-
Global Equities Report. Delivered weekly.
-
Classical charting principles. Learn patterns and setups.
-
Actionable information. Worldwide indices and stocks of interest.
-
Risk management advice. The important trading points of each chart.
-
Information on breakout opportunities. Identify the ones you want to take action on.
-
Video tutorials. How patterns form and why they succeed or fail.
-
Watch list alerts. As they become available so you can act quickly.
-
Breakout alerts. Usually once a week.
-
Access to everything (now and as it becomes available)o Reports
o Videos and video series -
Multi-part webinar course. You learn the 8 most common charting principles.
-
Webinars. Actionable and timely advice on breaking out chart patterns.
For your convenience your membership auto renews each year.