Every week Tech Charts Global Equity Markets report features some of the well-defined, mature classical chart patterns under a lengthy watchlist and the chart pattern breakout signals that took place during that week. Global Equity Markets report covers single stocks from developed, emerging and frontier markets, ETF’s and global equity indices. The report starts with a review section that highlights the important chart developments on global equity benchmarks. This blog post features from the watchlist section FANCL CORP listed on the Tokyo Stock Exchange.
There is a common belief between finance professionals that Technical Analysis and charting is for short-term “timing” of entries and exits. I have written in different platforms that I think this is underestimating the power of charting and its uses in portfolio management and asset allocation. Portfolios/Funds hold different securities with different motivations. A fund manager can have a strong positive view on a company but if the stock is not being bought by the market, in other words the value not “yet” recognized by the market participants, it can remain in the portfolio resulting in opportunity cost.
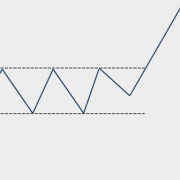
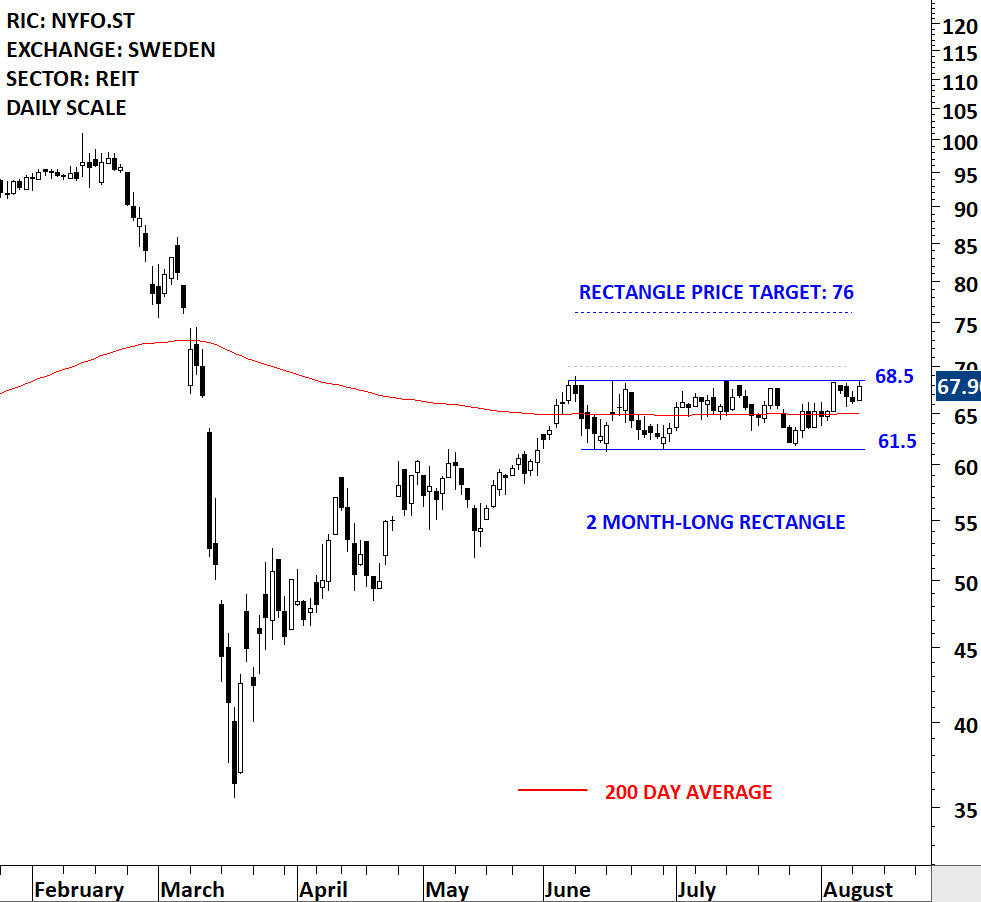
Stocks go through consolidation periods followed by trends. It is during those trend periods that a fund or position traders will make money. Unless the fund manager/trader recognizes a well-defined trading range at its early stages and starts buying and selling in that range (selling at the resistance and buying at support), it is best to patiently wait for the breakout to take place from the lengthy consolidation.
Price can remain in a well-defined range for several months. Once the stock breaks out, it can take few weeks/months for the strong price appreciation to take place. I like to focus on chart patterns with horizontal boundaries. They are easier to identify on price charts and focusing on horizontal boundaries will remove the bias from your analysis. It is much easier to think that there is a diagonal trend line somewhere (seeing trend lines that are not valid) on the price chart. But it is relatively difficult to come up with a well-defined horizontal consolidation with price having several touches on the boundaries.
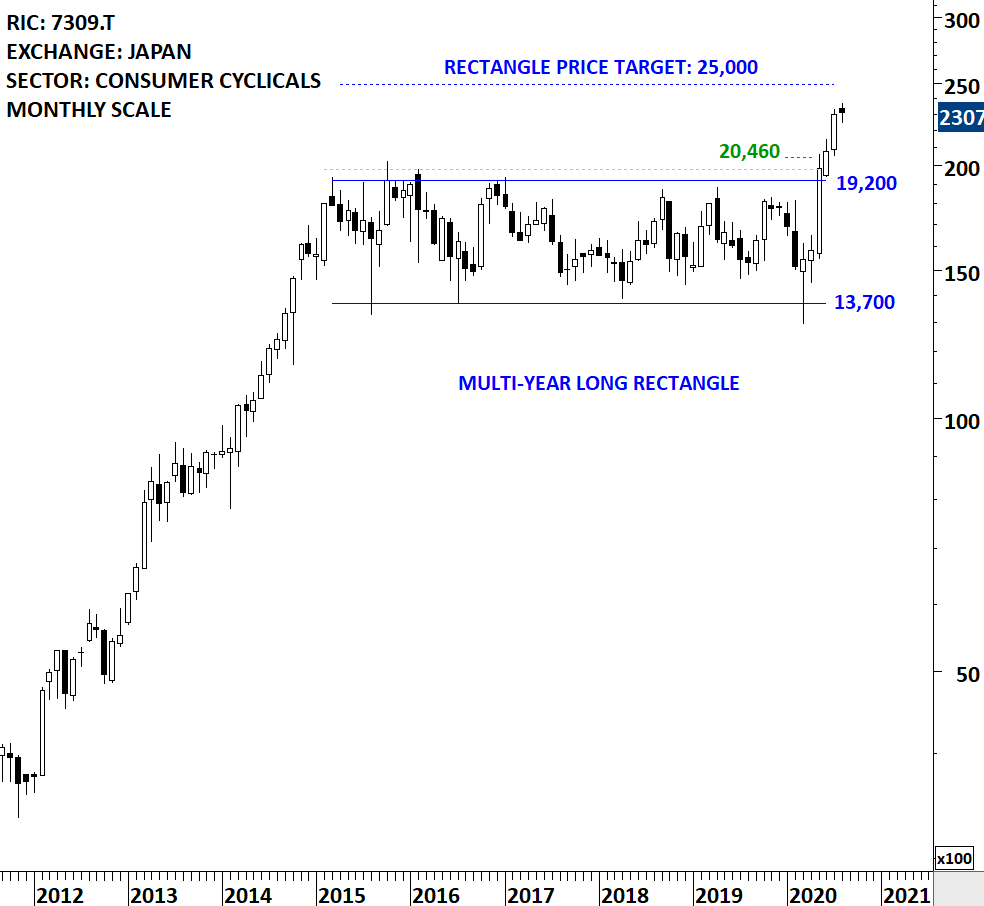
Earlier reports covered SHIMANO INC from Japan/Asia Equities as one of the breakout alerts. After remaining in a range for more than 5 years, SHIMANO INC completed its multi-year long consolidation on the upside. The chart pattern helped many long-term investors to position themselves in this name. Breakout took place to all-time highs, which I call it as the path of least resistance. SHIMANO INC is on its way towards the chart pattern price objective at 25,000 levels.
Another long-term breakout opportunity is discussed from Japan/ASIA equities in the Global Equity Markets report. FANCL CORP has a similar well-defined long-term consolidation that can complete soon. I’m monitoring this name for a confirmed breakout.
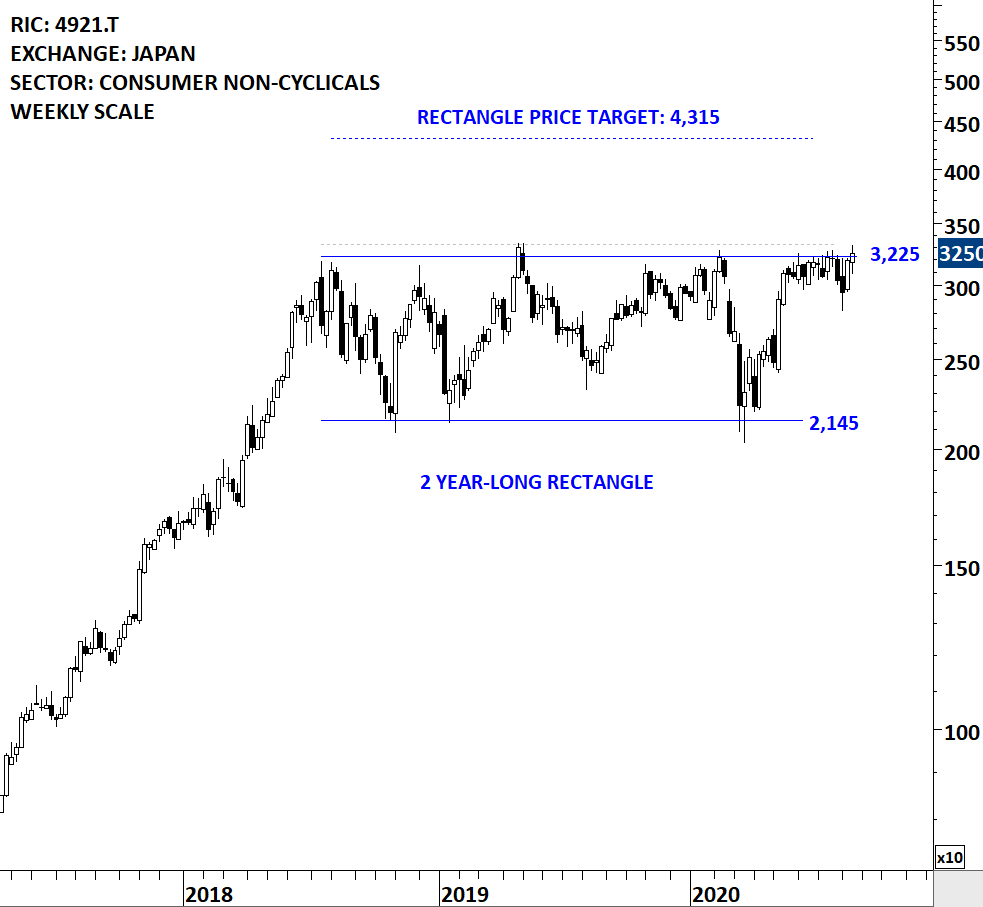
FANCL CORP (4921.T)
FANCL CORPORATION is a Japan-based company principally engaged in the research, development, manufacture and sale of cosmetics and dietary supplements. The stock is listed on the Tokyo Stock Exchange. Price chart formed a 2 year-long rectangle with the horizontal boundary acting as strong resistance at 3,225.0 levels. The horizontal boundary was tested several times over the course of the chart pattern. A daily close above 3,320.0 levels will confirm the breakout from the 2 year-long rectangle with the possible chart pattern price target of 4,315.0 levels. (Data as of 20/08/2020)
Tech Charts Membership

By becoming a Premium Member, you’ll be able to improve your knowledge of the principles of classical charting.
With this knowledge, you can merge them with your investing system. In fact, some investors use my analyses to modify their existing style to invest more efficiently and successfully.
Get Access Now
As a Premium Member of Aksel Kibar’s Tech Charts,
You will receive:
-
Global Equities Report. Delivered weekly.
-
Classical charting principles. Learn patterns and setups.
-
Actionable information. Worldwide indices and stocks of interest.
-
Risk management advice. The important trading points of each chart.
-
Information on breakout opportunities. Identify the ones you want to take action on.
-
Video tutorials. How patterns form and why they succeed or fail.
-
Watch list alerts. As they become available so you can act quickly.
-
Breakout alerts. Usually once a week.
-
Access to everything (now and as it becomes available)
o Reports
o Videos and video series
-
Multi-part webinar course. You learn the 8 most common charting principles.
-
Webinars. Actionable and timely advice on breaking out chart patterns.
For your convenience your membership auto renews each year.
Get Access Now