Every week Tech Charts Global Equity Markets report features some of the well-defined, mature classical chart patterns under a lengthy watchlist and the chart pattern breakout signals that took place during that week. Global Equity Markets report covers single stocks from developed, emerging and frontier markets, ETF’s and global equity indices. The report starts with a review section that highlights the important chart developments on global equity benchmarks. This blog post features from the review section the iShares MSCI All Country World Index ETF (ACWI.O) listed on the Nasdaq Stock Exchange.
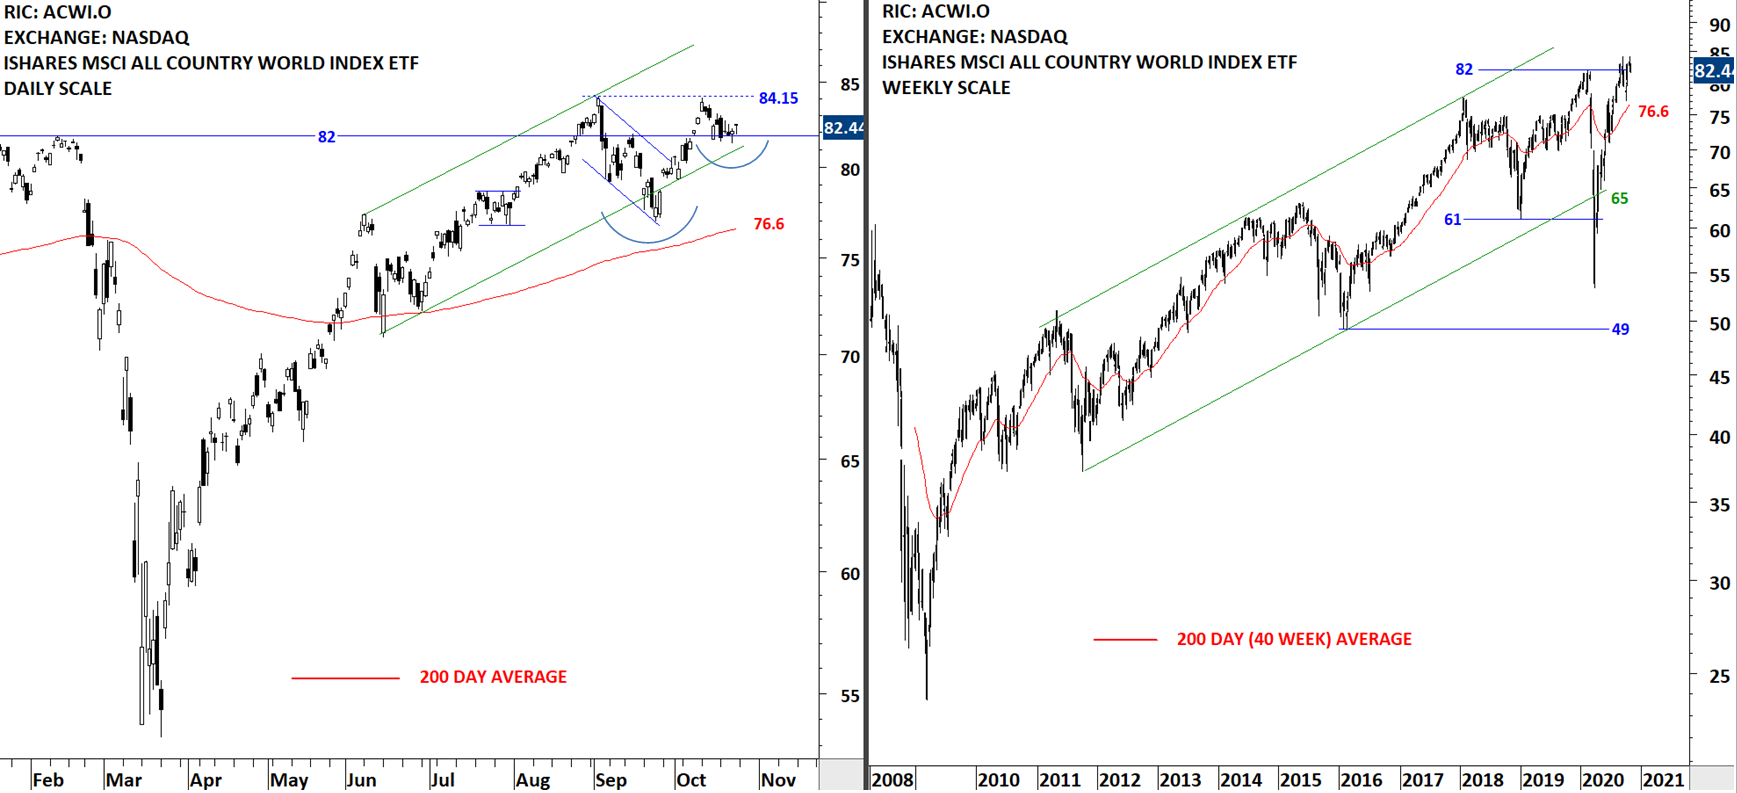
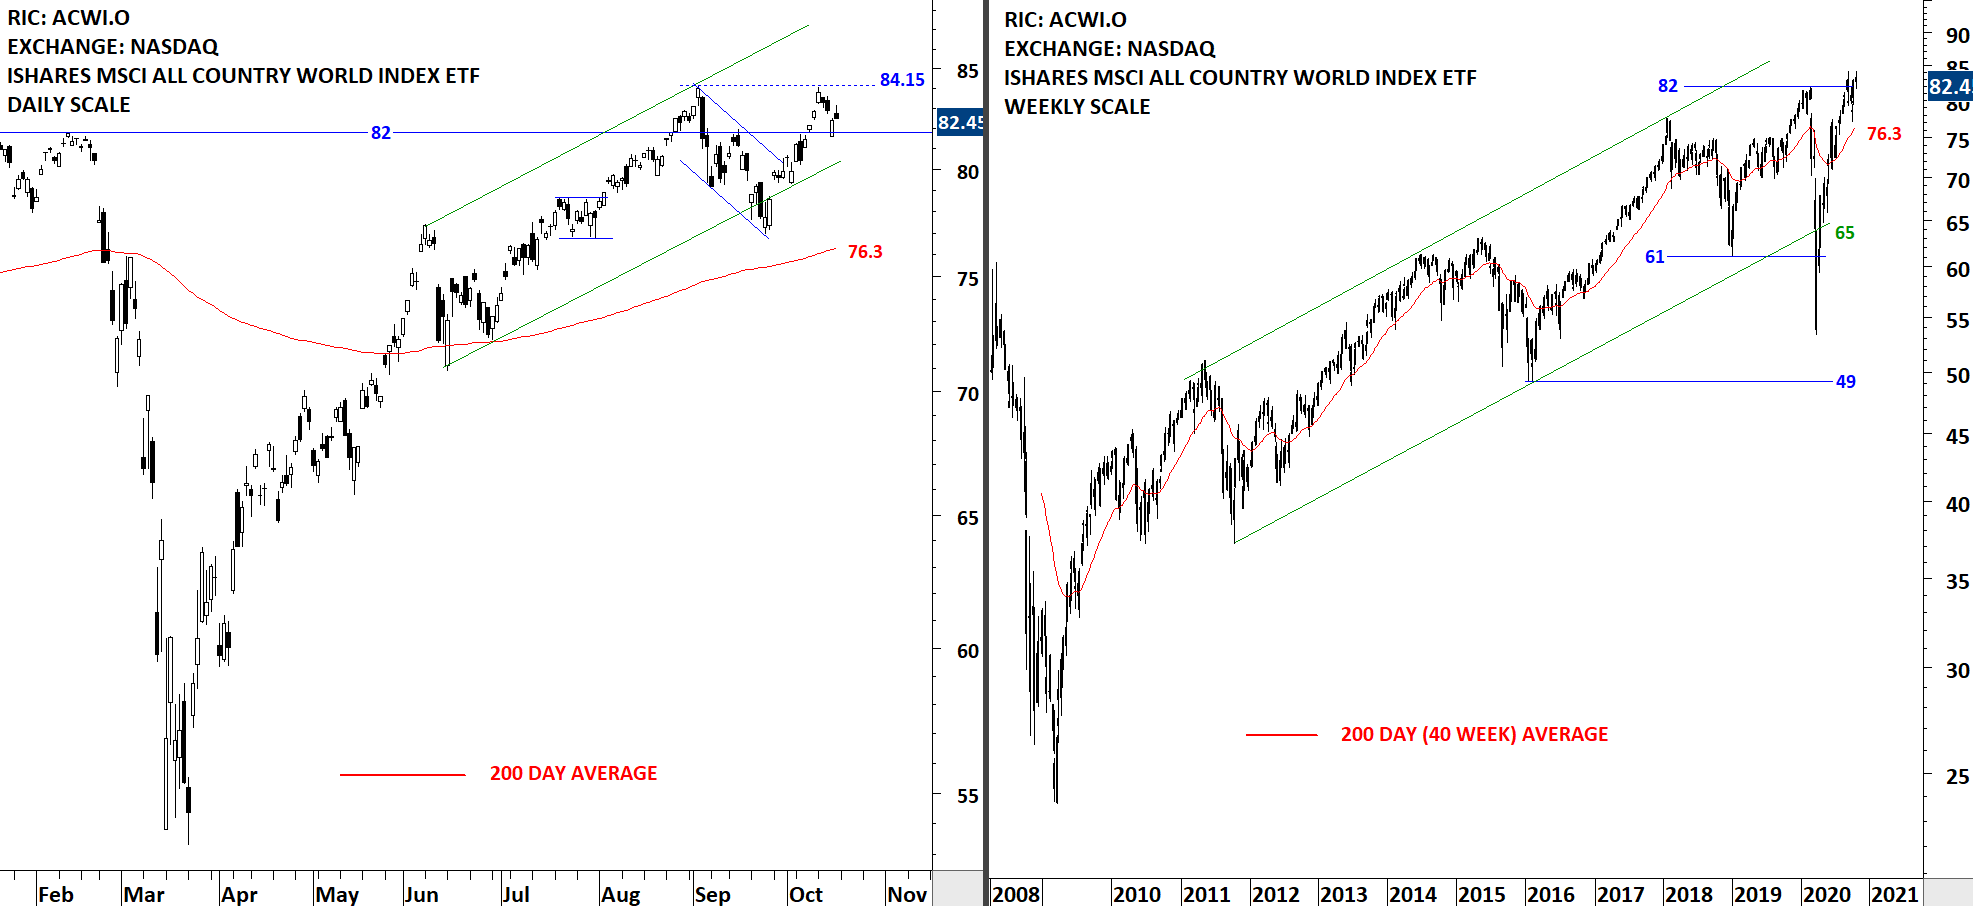
As we are getting closer to the U.S. elections, this chart is on my radar as it offers two possibilities from a classical charting perspective. A bearish outcome with the completion of a double top or a bullish outcome with the rebound from support area to resume the existing uptrend. We are at inflection point.
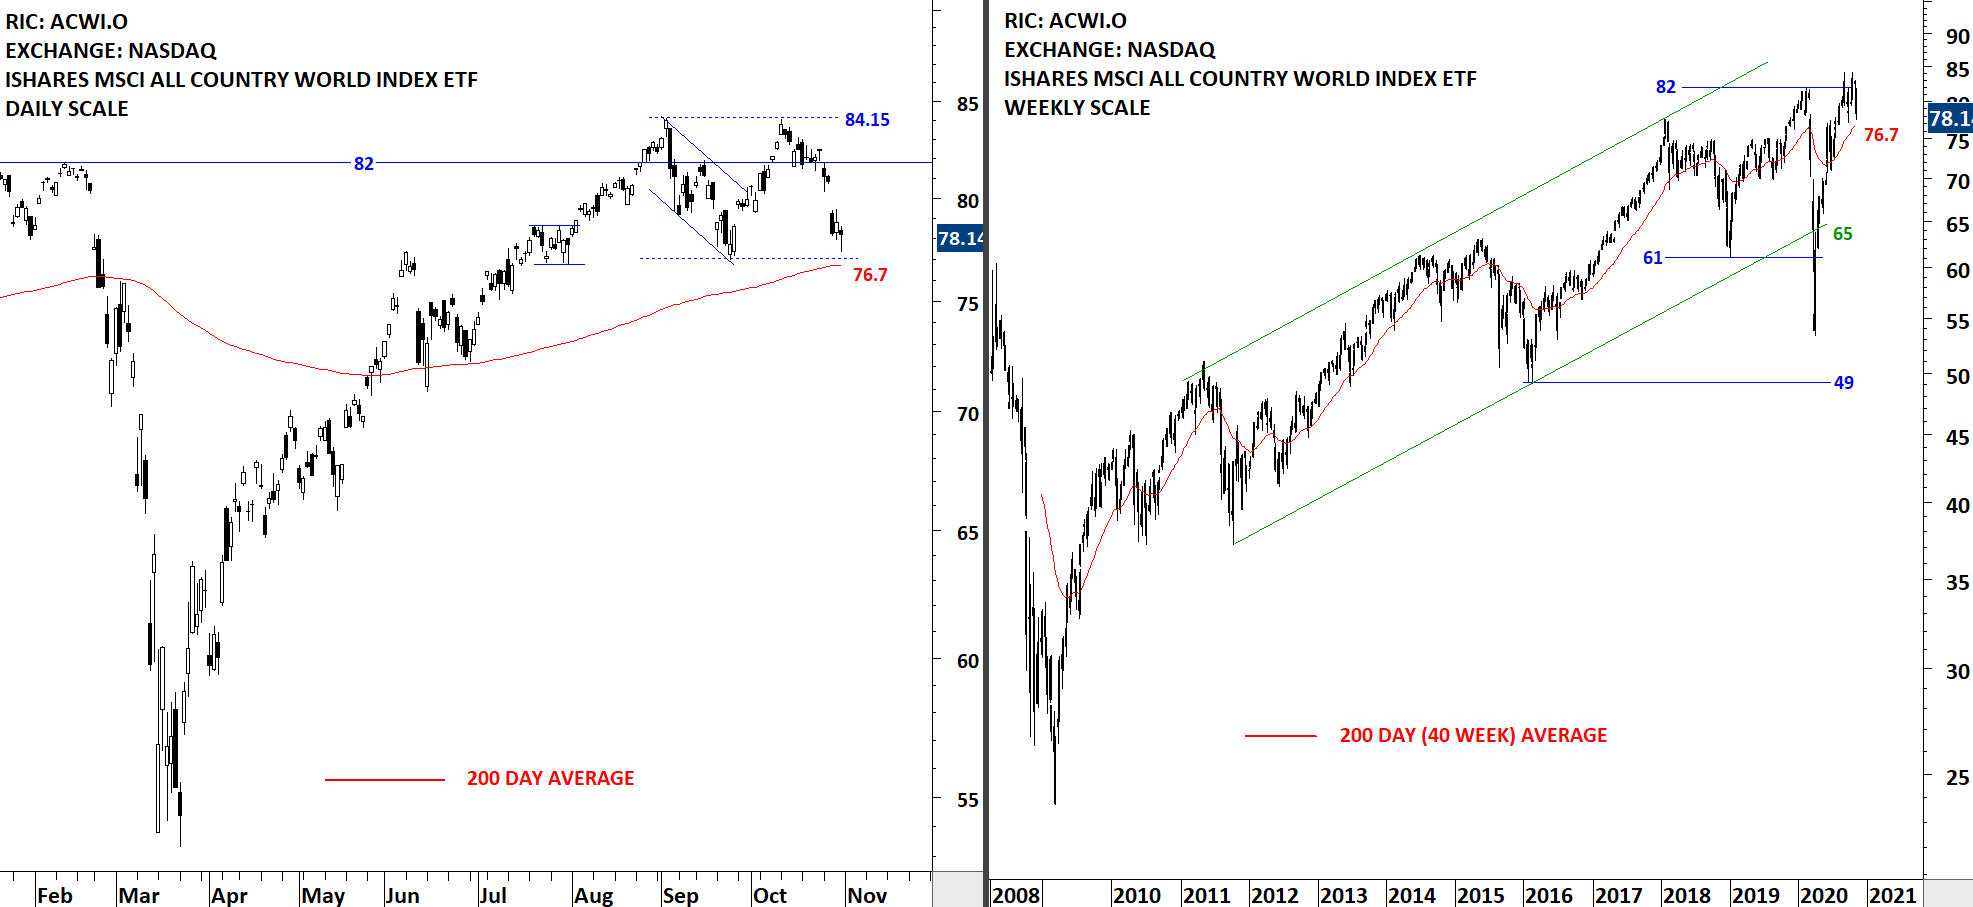
The benchmark for the Global equity markets performance, the iShares MSCI All Country World Index ETF (ACWI.O) resumed its correction after finding resistance at 84.15 levels, the minor high. The uptrend on Global equities is intact and ACWI ETF continues to trend higher above its 200-day average which is acting as support at 76.7 levels. Global equities are searching for direction in the short-term. Price is at an important inflection point. Last 2 month’s consolidation between 84.15 and 76.7 levels can act as
1) Double top, break down the support at 76.7 levels and resume correction towards 70 levels, 2) Rectangle continuation, rebound from current levels and resume uptrend towards 84.15 levels. It is important to note that Friday’s price action formed a bullish hammer around support levels and could signal reversal from support if we see follow through in the following days.
Tech Charts Membership

By becoming a Premium Member, you’ll be able to improve your knowledge of the principles of classical charting.
With this knowledge, you can merge them with your investing system. In fact, some investors use my analyses to modify their existing style to invest more efficiently and successfully.
Get Access Now
As a Premium Member of Aksel Kibar’s Tech Charts,
You will receive:
-
Global Equities Report. Delivered weekly.
-
Classical charting principles. Learn patterns and setups.
-
Actionable information. Worldwide indices and stocks of interest.
-
Risk management advice. The important trading points of each chart.
-
Information on breakout opportunities. Identify the ones you want to take action on.
-
Video tutorials. How patterns form and why they succeed or fail.
-
Watch list alerts. As they become available so you can act quickly.
-
Breakout alerts. Usually once a week.
-
Access to everything (now and as it becomes available)
o Reports
o Videos and video series
-
Multi-part webinar course. You learn the 8 most common charting principles.
-
Webinars. Actionable and timely advice on breaking out chart patterns.
For your convenience your membership auto renews each year.
Get Access Now