INTERIM UPDATE – August 30, 2019

Dear Tech Charts members,

I’m currently working on couple of things.

  1. A detailed analysis of chart pattern reliability/statistics of all breakout alerts (will be available soon).
  2. A new schedule to focus on identifying and featuring more shorter-term breakout opportunities for our members with short-term focus. The weekly Global equity markets report features chart patterns in duration between 4 months – 24 months. I will start adding 2 months – 4 months duration chart patterns on daily scale price charts. A recent example is in this Interim Update (MERCK KGA).
  3. Quarterly member webinar due in September. (date and time will be announced soon).

As I put together the weekly Global equity markets report, I though of sending this Interim Update given the fast moving nature of the past few days equity markets. Members might want to take advantage of those breakouts, if they take place in the last trading day of the week. This update is prepared during Europe trading hours. Charts are as of 11:00 am CET.

Read more

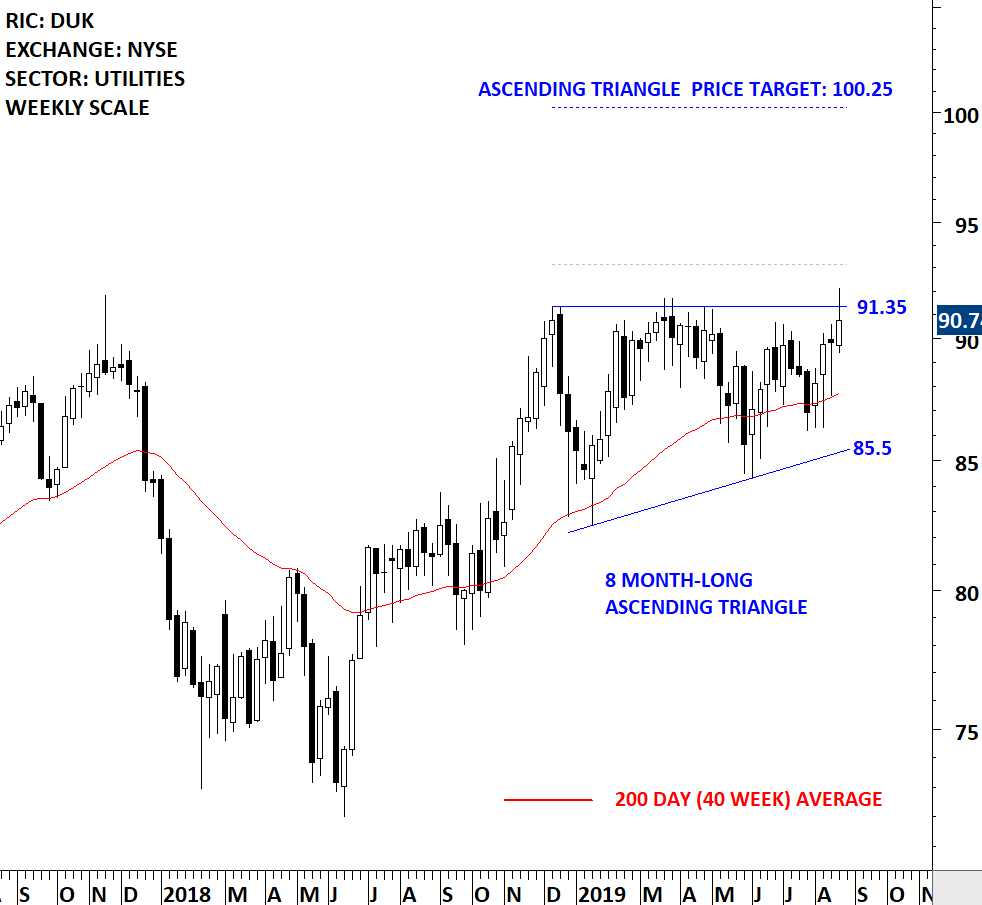
DUKE ENERGY CORP (DUK)

Every week Tech Charts Global Equity Markets report features some of the well-defined, mature classical chart patterns under a lengthy watchlist and the chart pattern breakout signals that took place during that week. Global Equity Markets report covers single stocks from developed, emerging and frontier markets, ETF’s and global equity indices. The report starts with a review section that highlights the important chart developments on global equity benchmarks. This blog post features from the breakouts section an ascending triangle continuation chart pattern opportunity, listed on the New York Stock Exchange.

DUKE ENERGY CORP (DUK)

Duke Energy Corporation (Duke Energy) is an energy company. The Company operates through three segments: Electric Utilities and Infrastructure; Gas Utilities and Infrastructure, and Commercial Renewables. The stock is listed on the New York Stock Exchange. Price chart formed an 8 month-long ascending triangle with the horizontal boundary acting as strong resistance at 91.35 levels. The horizontal boundary was tested several times over the course of the chart pattern. A daily close above 93.15 levels will confirm the breakout from the 8 month-long ascending triangle with the possible chart pattern price target of 100.25 levels.

Tech Charts Membership

By becoming a Premium Member, you’ll be able to improve your knowledge of the principles of classical charting.

With this knowledge, you can merge them with your investing system. In fact, some investors use my analyses to modify their existing style to invest more efficiently and successfully.

Get Access Now

As a Premium Member of Aksel Kibar’s Tech Charts,

You will receive:

  • Global Equities Report. Delivered weekly.
  • Classical charting principles. Learn patterns and setups.
  • Actionable information. Worldwide indices and stocks of interest.
  • Risk management advice. The important trading points of each chart.
  • Information on breakout opportunities. Identify the ones you want to take action on.
  • Video tutorials. How patterns form and why they succeed or fail.
  • Watch list alerts. As they become available so you can act quickly.
  • Breakout alerts. Usually once a week.
  • Access to everything (now and as it becomes available)
    o Reports
    o Videos and video series
  • Multi-part webinar course. You learn the 8 most common charting principles.
  • Webinars. Actionable and timely advice on breaking out chart patterns.

For your convenience your membership auto renews each year.

Get Access Now

GLOBAL EQUITY MARKETS – August 24, 2019

REVIEW


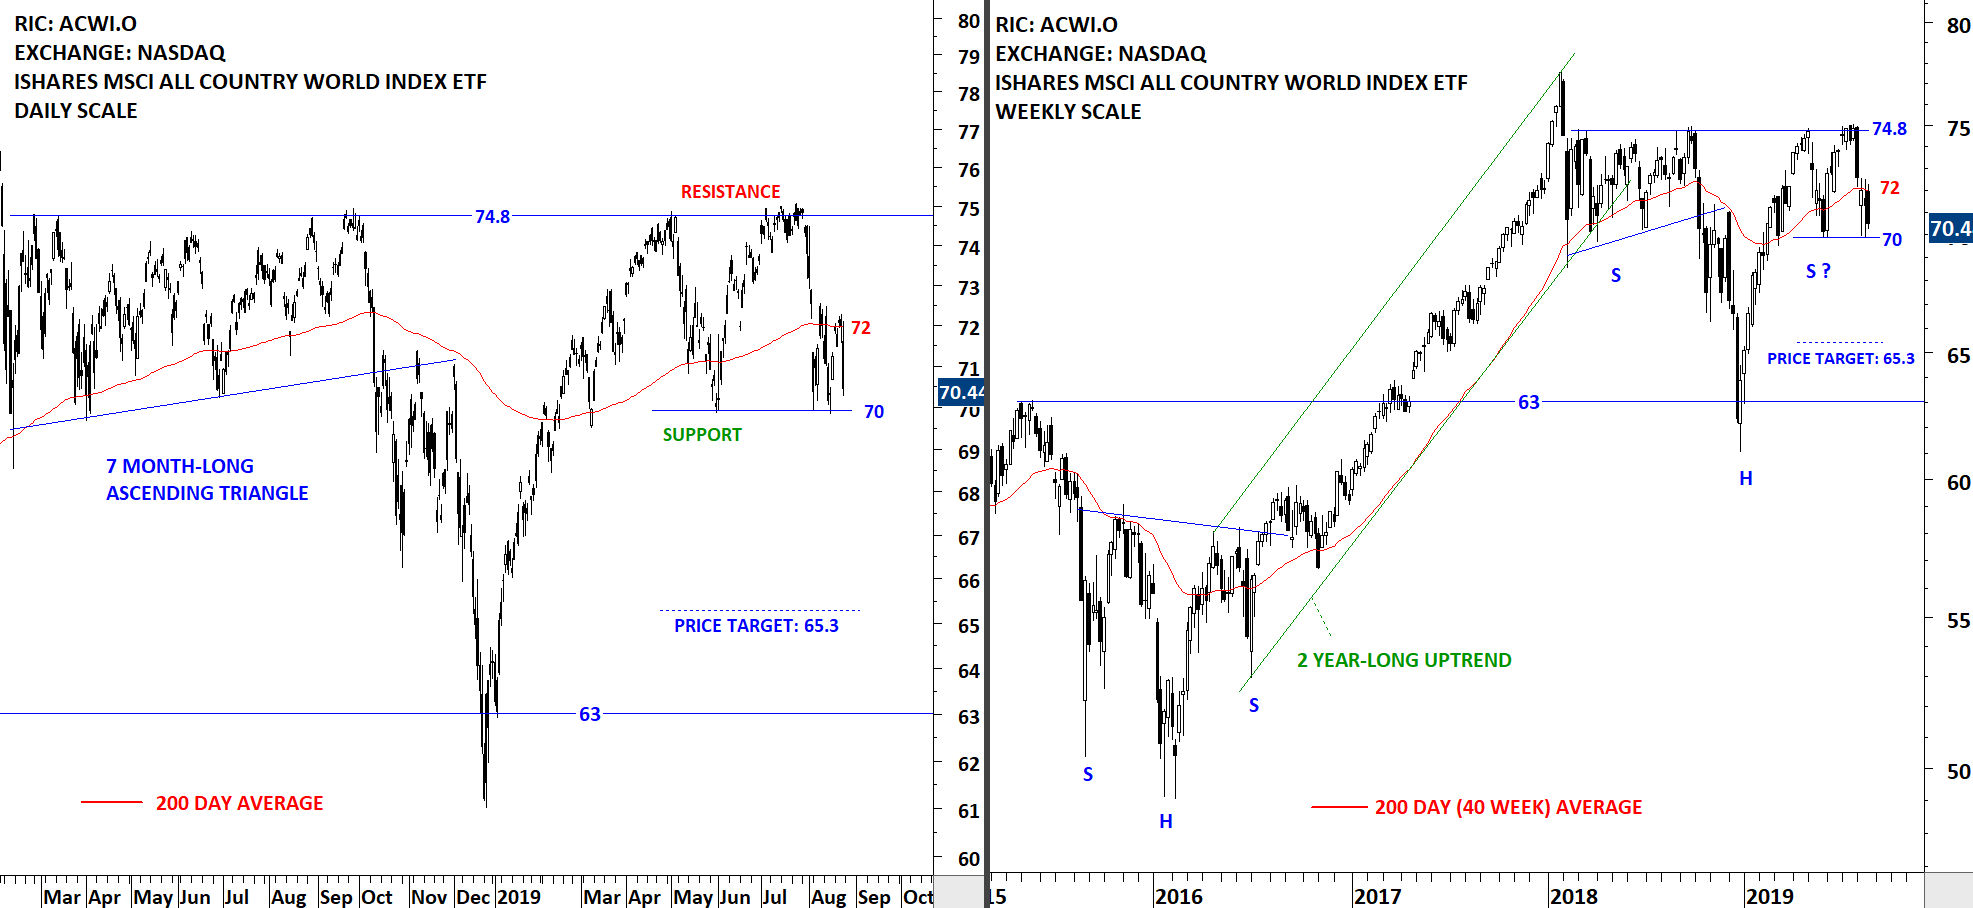
The benchmark for the Global equity markets performance, the iShares MSCI All Country World Index ETF (ACWI.O) failed to push above its 200-day moving average at 72 levels. Friday’s sell-off pulled the index towards the support level at 70 levels. Breakdown below 70, after several tests, can complete a possible double top with the price target of 65.3 levels. Though, the ETF might try to stabilize at 70 levels once again. I monitor this chart for a possible breakdown.

Read more

GLOBAL EQUITY MARKETS – August 17, 2019

REVIEW


The benchmark for the Global equity markets performance, the iShares MSCI All Country World Index ETF (ACWI.O) found support at the minor low at 70 levels. This week’s price action was the 3rd test of the support at 70 levels. The ETF is possibly forming a new trading range between 70 and 74.8 levels. Breakdown below 70 levels can confirm the consolidation as a double top and result in further weakness.

Read more

MURPHY USA INC (MUSA.K)

Every week Tech Charts Global Equity Markets report features some of the well-defined, mature classical chart patterns under a lengthy watchlist and the chart pattern breakout signals that took place during that week. Global Equity Markets report covers single stocks from developed, emerging and frontier markets, ETF’s and global equity indices. The report starts with a review section that highlights the important chart developments on global equity benchmarks. This blog post features from the breakouts section an ascending triangle continuation chart pattern opportunity, listed on the New York Stock Exchange.

MURPHY USA INC (MUSA.K)

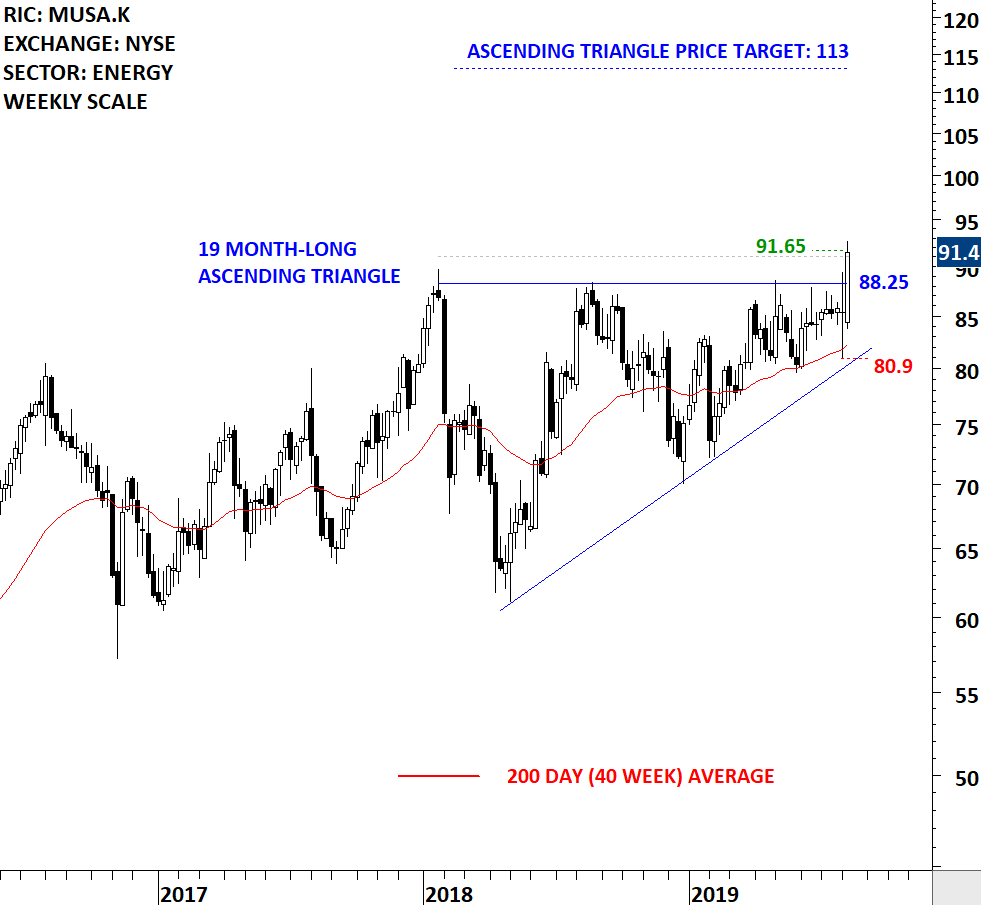
Murphy USA Inc. is engaged in the marketing of retail motor fuel products and merchandise through a chain of retail stores. The stock is listed on the New York Stock Exchange. Price chart formed a 19 month-long ascending triangle with the horizontal boundary acting as strong resistance at 88.25 levels. The horizontal boundary was tested several times over the course of the chart pattern. The daily close above 91 levels confirmed the breakout from the 19 month-long ascending triangle with the possible chart pattern price target of 113 levels.


Tech Charts Membership

By becoming a Premium Member, you’ll be able to improve your knowledge of the principles of classical charting.

With this knowledge, you can merge them with your investing system. In fact, some investors use my analyses to modify their existing style to invest more efficiently and successfully.

Get Access Now

As a Premium Member of Aksel Kibar’s Tech Charts,

You will receive:

  • Global Equities Report. Delivered weekly.
  • Classical charting principles. Learn patterns and setups.
  • Actionable information. Worldwide indices and stocks of interest.
  • Risk management advice. The important trading points of each chart.
  • Information on breakout opportunities. Identify the ones you want to take action on.
  • Video tutorials. How patterns form and why they succeed or fail.
  • Watch list alerts. As they become available so you can act quickly.
  • Breakout alerts. Usually once a week.
  • Access to everything (now and as it becomes available)
    o Reports
    o Videos and video series
  • Multi-part webinar course. You learn the 8 most common charting principles.
  • Webinars. Actionable and timely advice on breaking out chart patterns.

For your convenience your membership auto renews each year.

Get Access Now

GLOBAL EQUITY MARKETS – August 10, 2019

REVIEW


The benchmark for the Global equity markets performance, the iShares MSCI All Country World Index ETF (ACWI.O) found support at the minor low at 70 levels. Mid-week Interim Update discussed the possibility of a rebound. The reversal from 70 levels filled the gap. This week’s close was at the 200-day average. The ETF is possibly forming a new trading range between 70 and 74.8 levels. Breakdown below 70 levels can result in further weakness.

Read more

INTERIM UPDATE – August 7, 2019

As the trade war tensions between U.S. and China escalated, volatility in Global equity markets increased. Given the levels the major Global ETFs are testing, I think a mid-week update would be helpful to put the current status of the markets into perspective.

Read more

GLOBAL EQUITY MARKETS – August 3, 2019

REVIEW


The benchmark for the Global equity markets performance, the iShares MSCI All Country World Index ETF (ACWI.O) failed to break above the strong horizontal resistance once again. Failure to break above the strong resistance resulted in a pullback towards the long-term average at 72 levels. On Friday the ETF tested the 200-day and closed the day off its lows. If we see the price stabilizing above the support at 72, the new trading range can become 72 and 74.8. Failure to hold above the 200-day can result in a larger scale correction. Next support is at 70 levels.

Read more

Rectangle – Bullish Reversal

You don’t have access to view this content

CUP & HANDLE OPPORTUNITIES

Every week Tech Charts Global Equity Markets report features some of the well-defined, mature classical chart patterns under a lengthy watchlist and the chart pattern breakout signals that took place during that week. Global Equity Markets report covers single stocks from developed, emerging and frontier markets, ETF’s and global equity indices. The report starts with a review section that highlights the important chart developments on global equity benchmarks and continues with recent breakouts and watchlist candidates.

In the beginning of July, Tech Charts blog featured two cup & handle breakout opportunities for our readers. This update highlights NOVOCURE LTD. which met its chart pattern price objective and discusses the second similar chart pattern setup that is developing on REATA PHARMACEUTICALS INC.  from the watchlist section. Both equities are listed on the Nasdaq Stock Exchange.

Read more