INTERIM UPDATE (EUROPE & AMERICAS) – January 20, 2021

I start my research on Mondays and finalize by end of day Thursday. Friday is dedicated to putting all ideas to the report format. During the week I come across good setups and those are featured in the weekly report. However, there are those that pop during the week and is worth bringing to your attention before the week finalizes. Below are latest additions to Tech Charts watchlist from EUROPE & AMERICAS equities, in case they experience breakouts during the week. These charts will also be included in the weekly update.

Read more

INTERIM UPDATE (MENA) – January 19, 2021

I start my research on Mondays and finalize by end of day Thursday. Friday is dedicated to putting all ideas to the report format. During the week I come across good setups and those are featured in the weekly report. However, there are those that pop during the week and is worth bringing to your attention before the week finalizes. Below are latest additions to Tech Charts watchlist from MENA equities, in case they experience breakouts during the week. These charts will also be included in the weekly update.

Read more

GLOBAL EQUITY MARKETS – January 16, 2021

REVIEW


The benchmark for the Global equity markets performance, the iShares MSCI All Country World Index ETF (ACWI.O) resumed its uptrend past the rectangle chart pattern price target at 91 levels.  On the weekly scale price chart of the ETF is also close to the upper boundary of the long-term uptrend channel. During any pullback 84.15 will act as support. The 200-day moving average, which I utilize as a trend filter, is rising as well, now at 81.6 levels. Uptrend is intact and there is no reversal chart pattern on daily scale price chart. The last 2 months uptrend formed a well-defined upward trend channel. The lower boundary can act as short-term support at 91 levels.

Read more

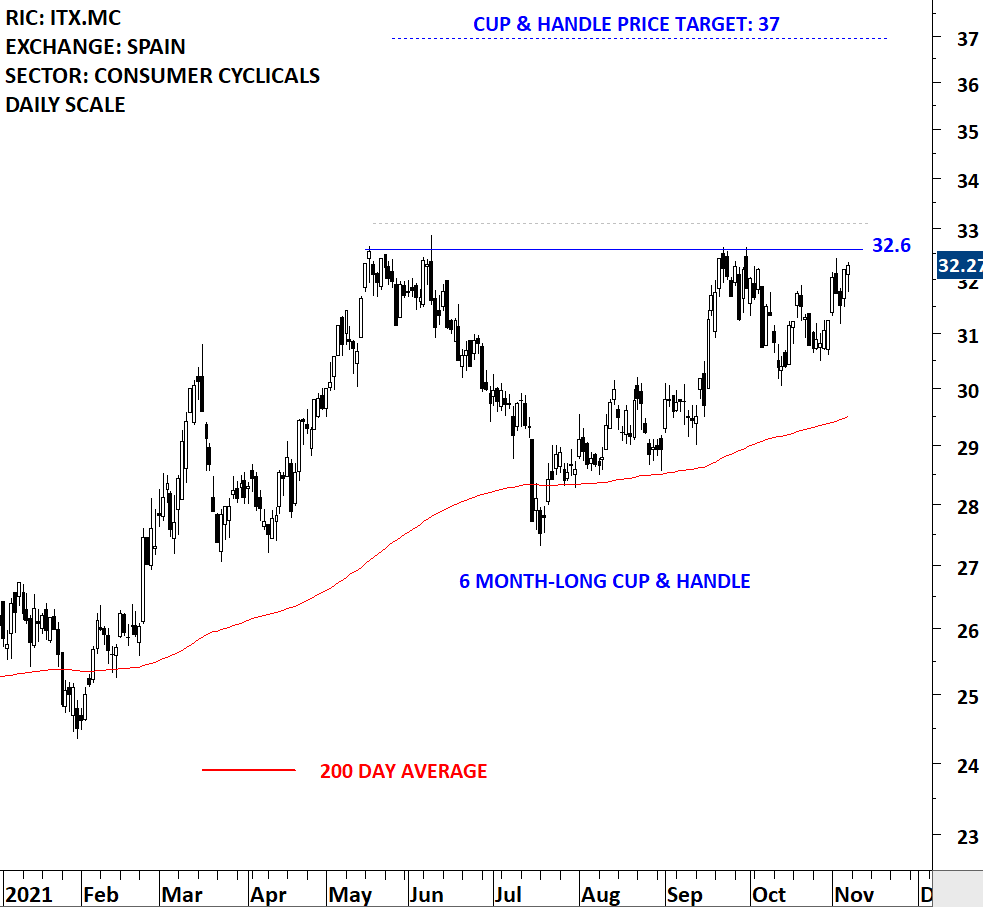
Morphology and Cup & Handle continuation

You don’t have access to view this content

INTERIM UPDATE (ASIA) – January 13, 2021

I start my research on Mondays and finalize by end of day Thursday. Friday is dedicated to putting all ideas to the report format. During the week I come across good setups and those are featured in the weekly report. However, there are those that pop during the week and is worth bringing to your attention before the week finalizes. Below are latest additions to Tech Charts watchlist from ASIA equities, in case they experience breakouts during the week. These charts will also be included in the weekly update.

Read more

INTERIM UPDATE – January 13, 2021

I start my research on Mondays and finalize by end of day Thursday. Friday is dedicated to putting all ideas to the report format. During the week I come across good setups and those are featured in the weekly report. However, there are those that pop during the week and is worth bringing to your attention before the week finalizes. Below are latest additions to Tech Charts watchlist in case they experience breakouts during the week. These charts will also be included in the weekly update. I will send a separate interim update on Asia opportunities once those exchanges are closed.

Read more

RECTANGLE – SHOP APOTHEKE EUROPE

Every week Tech Charts Global Equity Markets report features some of the well-defined, mature classical chart patterns under a lengthy watchlist and the chart pattern breakout signals that took place during that week. Global Equity Markets report covers single stocks from developed, emerging and frontier markets, ETF’s and global equity indices. The report starts with a review section that highlights the important chart developments on global equity benchmarks. This blog post features from the watchlist section Shop Apotheke Europe listed on the Frankfurt Stock Exchange.

SHOP APOTHEKE EUROPE NV (SAEG.DE)

Shop Apotheke Europe NV is a company based in the Netherlands that retails pharmaceutical products online. The Company focuses on non-prescription medication (OTC), as well as on pharmacy-related beauty and personal care (BPC) products. The Company is active in Belgium, Spain, Italy, France, Austria, the Netherlands and Germany. The stock is listed on the Frankfurt Stock Exchange. Price chart formed a 4 month-long rectangle chart pattern with the horizontal boundary acting as strong resistance at 166.00 levels. The horizontal boundary was tested several times over the course of the chart pattern. A daily close above 171.00 levels will confirm the breakout from the 4 month-long rectangle with the possible chart pattern price target of 210.0 levels. Breakout can push the stock to all-time highs.


Tech Charts Membership

By becoming a Premium Member, you’ll be able to improve your knowledge of the principles of classical charting.

With this knowledge, you can merge them with your investing system. In fact, some investors use my analyses to modify their existing style to invest more efficiently and successfully.

Get Access Now

As a Premium Member of Aksel Kibar’s Tech Charts,

You will receive:

  • Global Equities Report. Delivered weekly.
  • Classical charting principles. Learn patterns and setups.
  • Actionable information. Worldwide indices and stocks of interest.
  • Risk management advice. The important trading points of each chart.
  • Information on breakout opportunities. Identify the ones you want to take action on.
  • Video tutorials. How patterns form and why they succeed or fail.
  • Watch list alerts. As they become available so you can act quickly.
  • Breakout alerts. Usually once a week.
  • Access to everything (now and as it becomes available)
    o Reports
    o Videos and video series
  • Multi-part webinar course. You learn the 8 most common charting principles.
  • Webinars. Actionable and timely advice on breaking out chart patterns.

For your convenience your membership auto renews each year.

Get Access Now

GLOBAL EQUITY MARKETS – January 9, 2021

REVIEW


The benchmark for the Global equity markets performance, the iShares MSCI All Country World Index ETF (ACWI.O) resumed its uptrend past the rectangle chart pattern price target at 91 levels.  On the weekly scale price chart of the ETF is also close to the upper boundary of the long-term uptrend channel. During any pullback 84.15 will act as support. The 200-day moving average, which I utilize as a trend filter, is rising as well, now at 81 levels. Volatility is picking up from low levels. Volatility does not have direction. Acceleration of the uptrend or a sharp correction; both can result in an increase in volatility. Uptrend is intact and there is no reversal chart pattern on daily scale price chart.

Read more

INTERIM UPDATE – January 8, 2021

I start my research on Mondays and finalize by end of day Thursday. Friday is dedicated to putting all ideas to the report format. During the week I come across good setups and those are featured in the weekly report. However, there are those that pop during the week and is worth bringing to your attention before the week finalizes. Below are latest additions to Tech Charts watchlist in case they experience breakouts during the last day of the week. These charts will also be included in the weekly update.

Read more

ORLA MINING – CUP & HANDLE CONTINUATION

Every week Tech Charts Global Equity Markets report features some of the well-defined, mature classical chart patterns under a lengthy watchlist and the chart pattern breakout signals that took place during that week. Global Equity Markets report covers single stocks from developed, emerging and frontier markets, ETF’s and global equity indices. The report starts with a review section that highlights the important chart developments on global equity benchmarks. This blog post features from the watchlist section Orla Mining Ltd. listed on the Toronto Stock Exchange.

ORLA MINING LTD (OLA.TO)

Orla Mining Ltd is a Canada-based mineral exploration company. The Company has the following projects: Camino Rojo and Cerro Quema. Camino Rojo is a gold and silver project located in Zacatecas State, Central Mexico. Camino Rojo has historical oxide reserves along with historical sulphide resources. The stock is listed on the Toronto Stock Exchange. Price chart formed a 4 month-long cup & handle continuation with the horizontal boundary acting as strong resistance at 7.17 levels. The horizontal boundary was tested several times over the course of the chart pattern. A daily close above 7.40 levels will confirm the breakout from the 4 month-long cup & handle continuation with the possible chart pattern price target of 9.5 levels. Breakout can push the stock to all-time highs. (Data as of Jan 4, 2020)


Tech Charts Membership

By becoming a Premium Member, you’ll be able to improve your knowledge of the principles of classical charting.

With this knowledge, you can merge them with your investing system. In fact, some investors use my analyses to modify their existing style to invest more efficiently and successfully.

Get Access Now

As a Premium Member of Aksel Kibar’s Tech Charts,

You will receive:

  • Global Equities Report. Delivered weekly.
  • Classical charting principles. Learn patterns and setups.
  • Actionable information. Worldwide indices and stocks of interest.
  • Risk management advice. The important trading points of each chart.
  • Information on breakout opportunities. Identify the ones you want to take action on.
  • Video tutorials. How patterns form and why they succeed or fail.
  • Watch list alerts. As they become available so you can act quickly.
  • Breakout alerts. Usually once a week.
  • Access to everything (now and as it becomes available)
    o Reports
    o Videos and video series
  • Multi-part webinar course. You learn the 8 most common charting principles.
  • Webinars. Actionable and timely advice on breaking out chart patterns.

For your convenience your membership auto renews each year.

Get Access Now