
SILVER
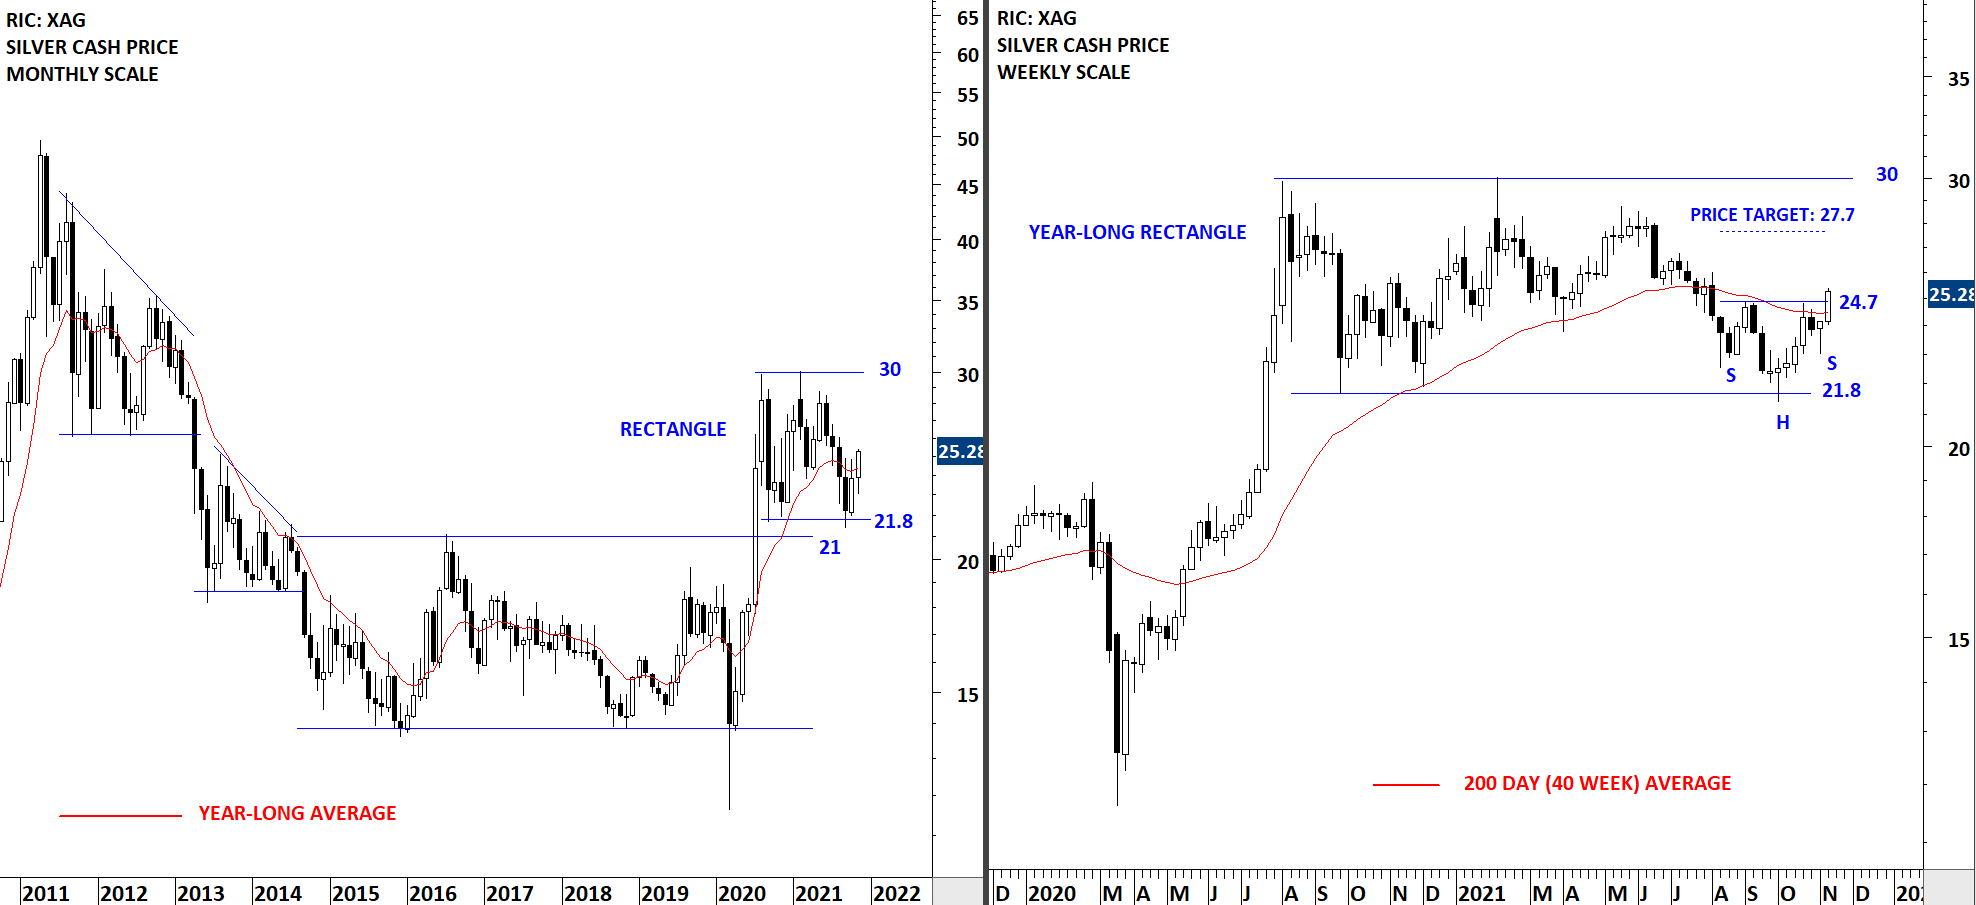
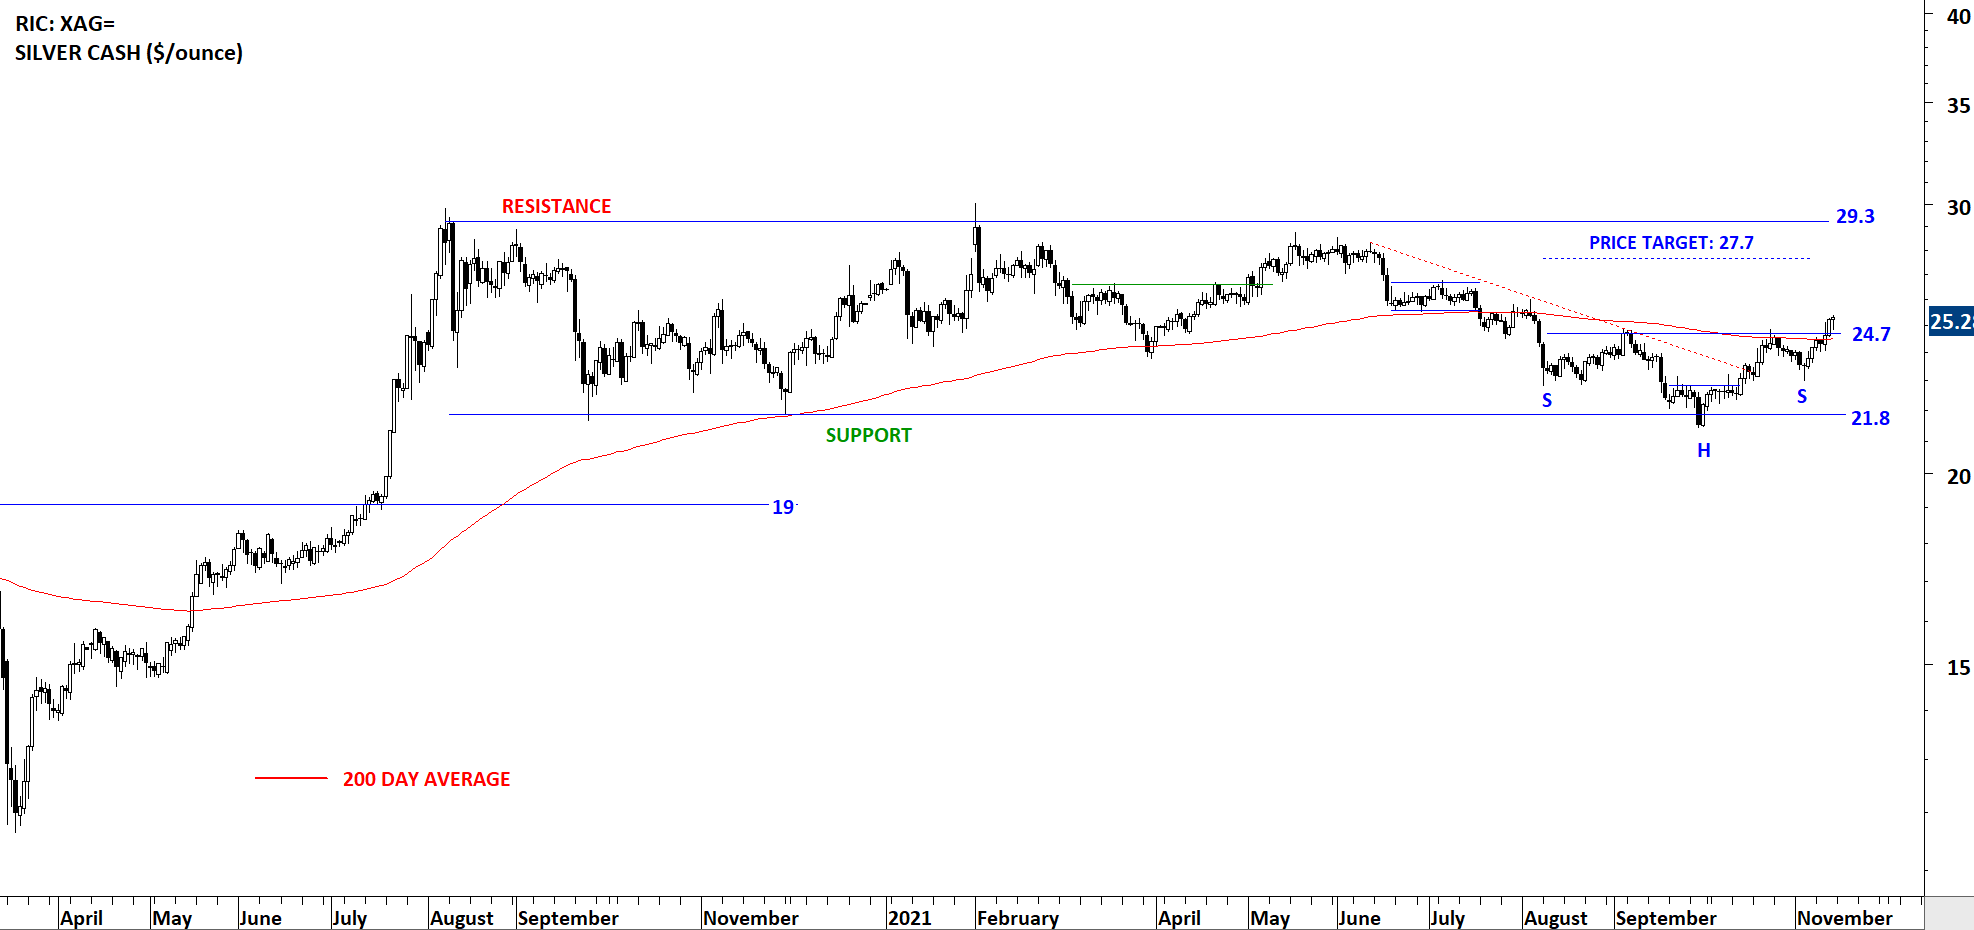
Every week Tech Charts Global Equity Markets report features some of the well-defined, mature classical chart patterns under a lengthy watchlist and the chart pattern breakout signals that took place during that week. Global Equity Markets report covers single stocks from developed, emerging and frontier markets, ETF’s, select commodities, cryptocurrencies and global equity indices. Below chart is from the review section of the weekly report. It is featuring SILVER prices on different time frames.
SILVER (CASH PRICE)
Silver remains range bound between 21.8 and 30 levels. A great text-book opportunity might be developing as price pulled back for couple of weeks to form the right shoulder of a possible H&S bottom. Breakout above the 200-day average changed the outlook to positive. A possible H&S bottom reversal might be completing (as can be seen on daily scale) with the neckline at 24.7 levels. Price target for the H&S bottom reversal stands at 27.7 levels.
The daily scale price chart of Silver shows much better the developing possible H&S bottom with the neckline that was acting as resistance at 24.7 levels. This was also the 200-day average. Breakout cleared both technical hurdles and now suggests higher prices. Price objective for the H&S bottom stands at 27.7 levels. The low of the right shoulder at 23 levels will act as the chart pattern negation level for the H&S bottom reversal.
Tech Charts Membership

By becoming a Premium Member, you’ll be able to improve your knowledge of the principles of classical charting.
With this knowledge, you can merge them with your investing system. In fact, some investors use my analyses to modify their existing style to invest more efficiently and successfully.

As a Premium Member of Aksel Kibar’s Tech Charts,
You will receive:
-
Global Equities Report. Delivered weekly.
-
Classical charting principles. Learn patterns and setups.
-
Actionable information. Worldwide indices and stocks of interest.
-
Risk management advice. The important trading points of each chart.
-
Information on breakout opportunities. Identify the ones you want to take action on.
-
Video tutorials. How patterns form and why they succeed or fail.
-
Watch list alerts. As they become available so you can act quickly.
-
Breakout alerts. Usually once a week.
-
Access to everything (now and as it becomes available)o Reports
o Videos and video series -
Multi-part webinar course. You learn the 8 most common charting principles.
-
Webinars. Actionable and timely advice on breaking out chart patterns.
For your convenience your membership auto renews each year.


