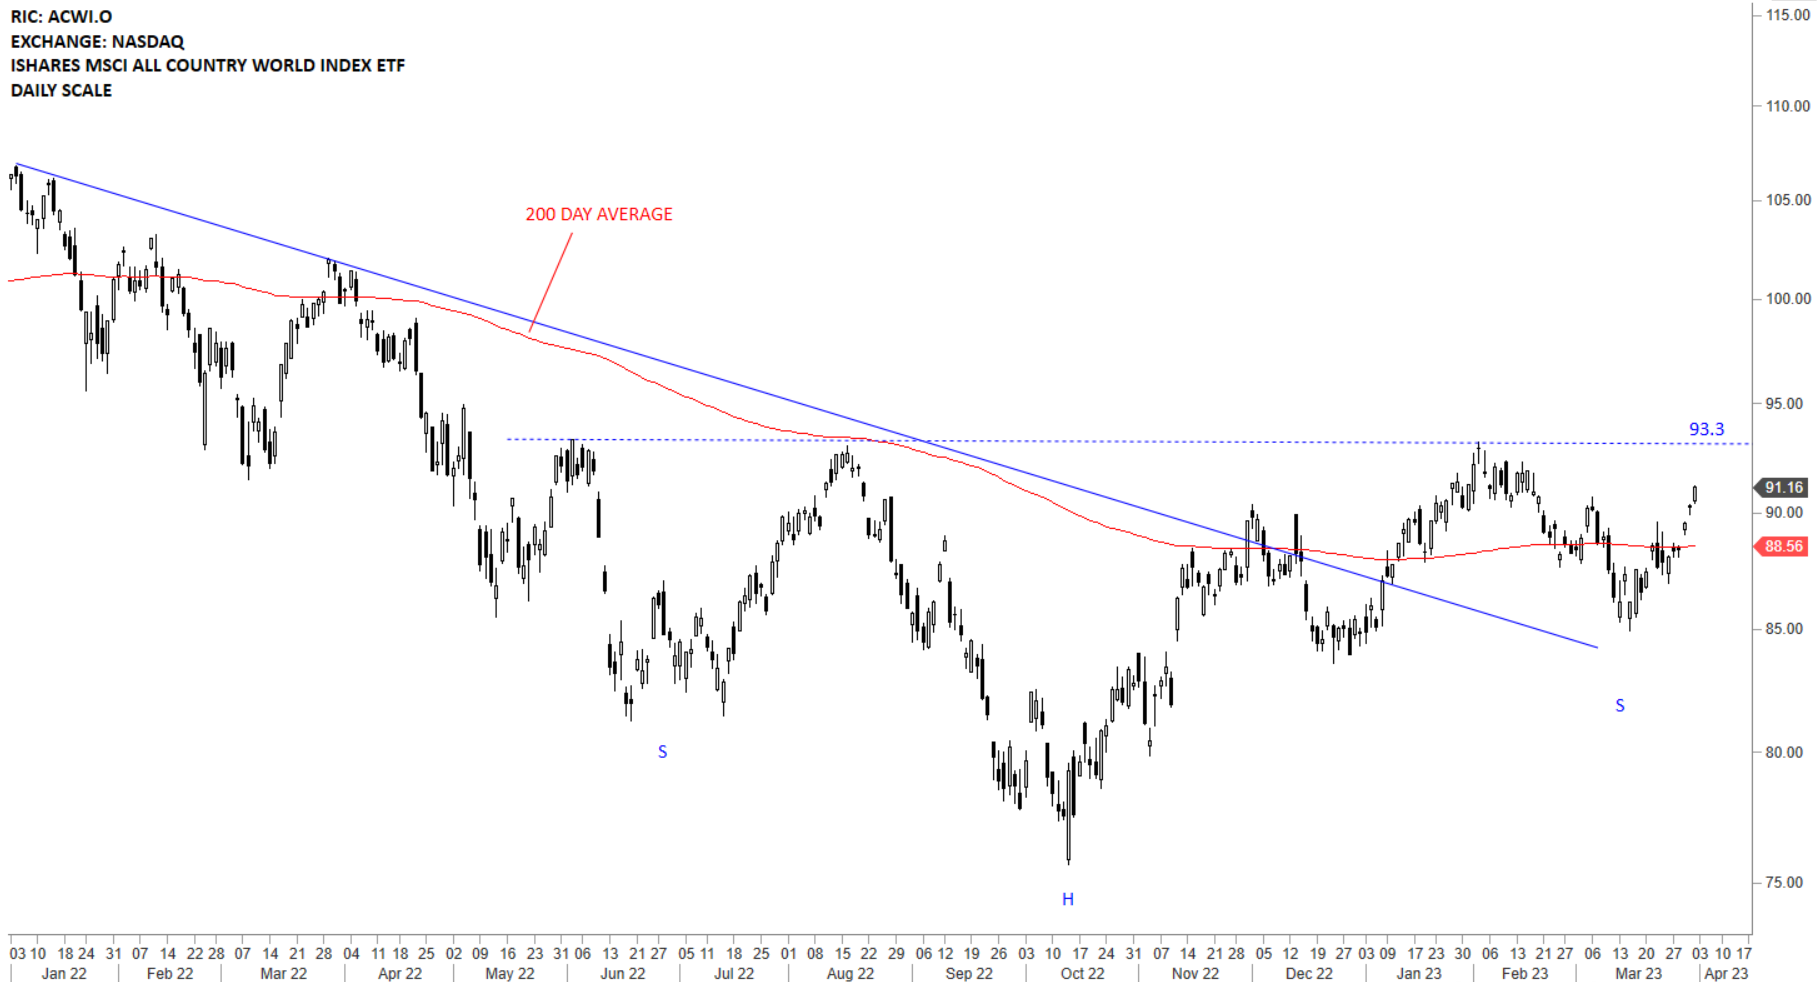
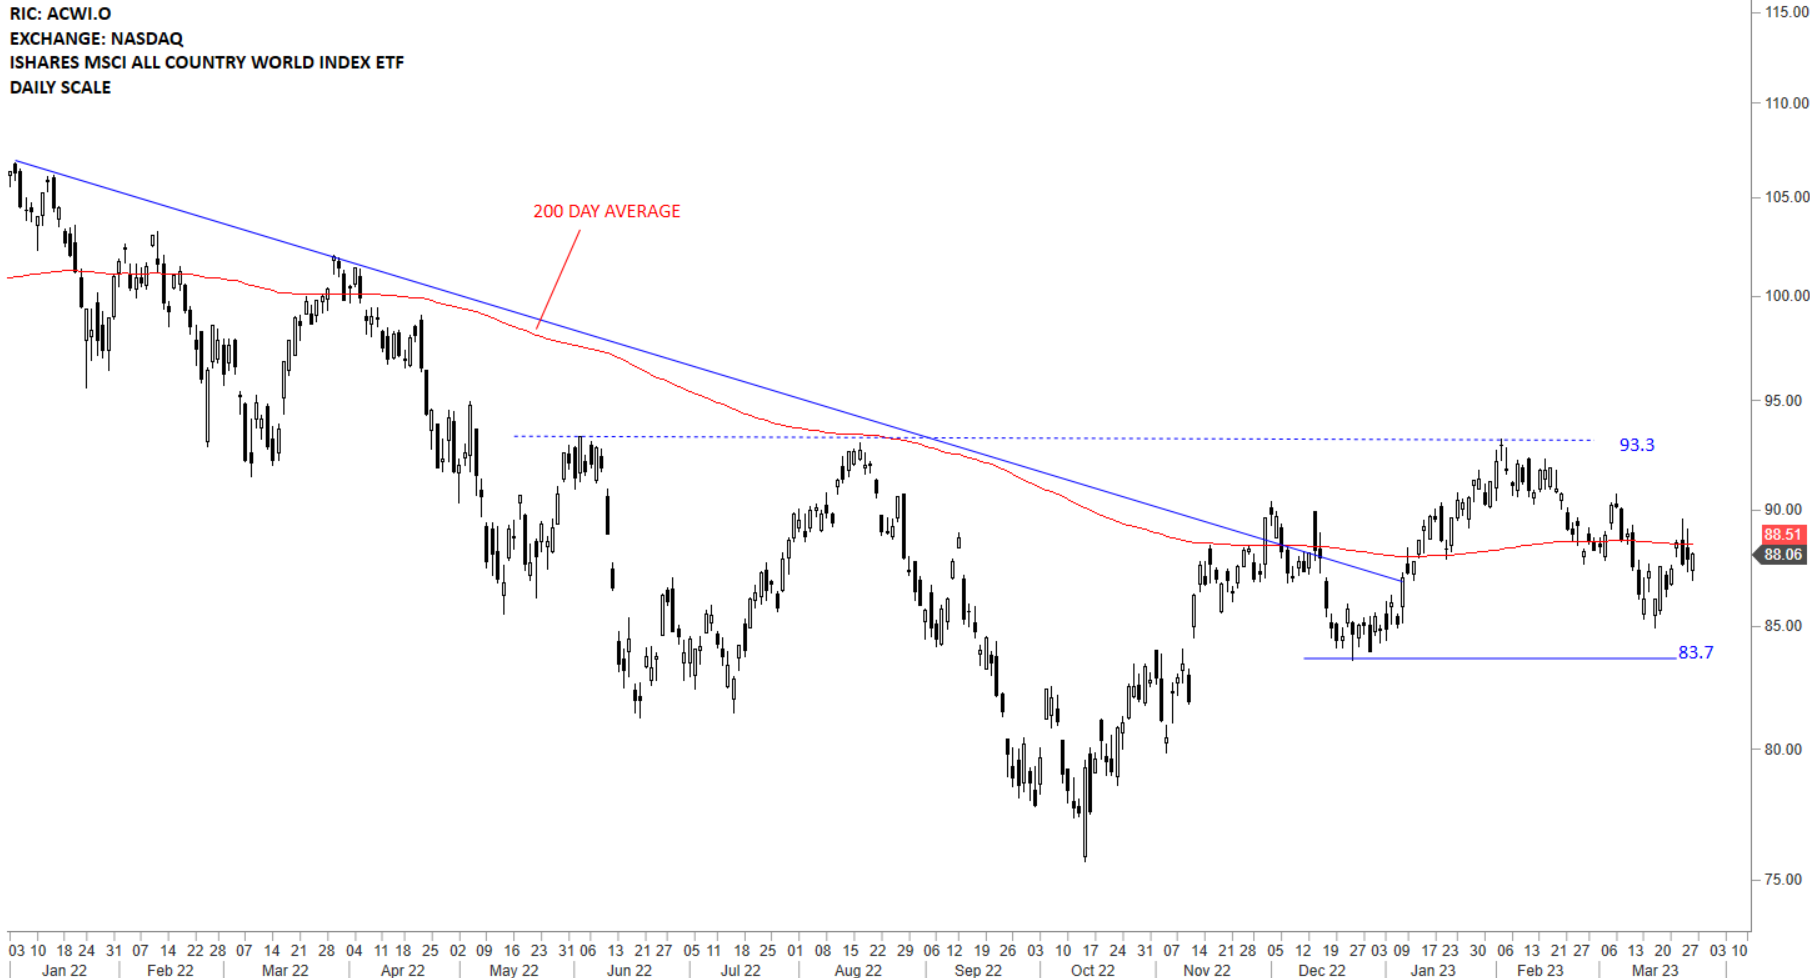
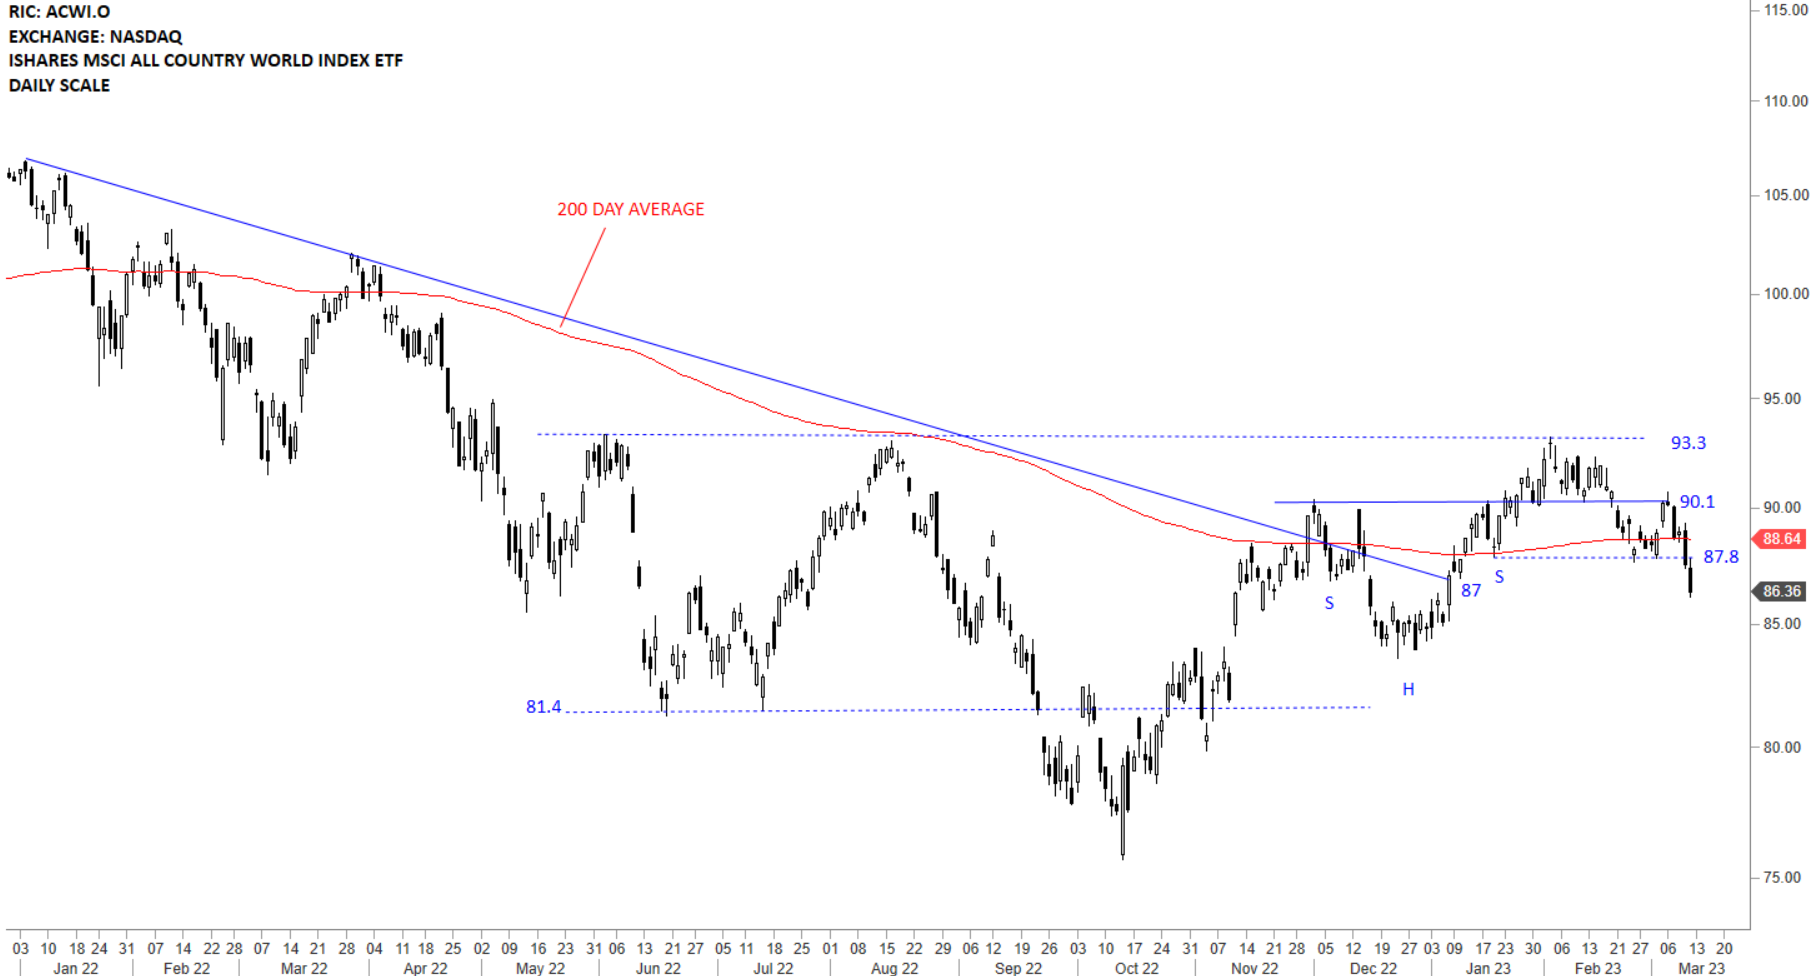
The benchmark for the Global equity markets performance, the iShares MSCI All Country World Index ETF (ACWI.O) is looking for direction. So far price action has been volatile around the 200-day average. After this week’s strong rally above the 200-day average, I’m weighing the possibility of a large scale H&S bottom reversal with the neckline standing at 93.3 levels. The ETF might be completing the right shoulder of a multi-month long H&S bottom reversal.
Head and Shoulder top failure can be as valuable as a successful H&S pattern completion. I started keeping statistics for H&S failures and the number of occurrences are increasing to a level which I will soon be able to publish statistically significant numbers.
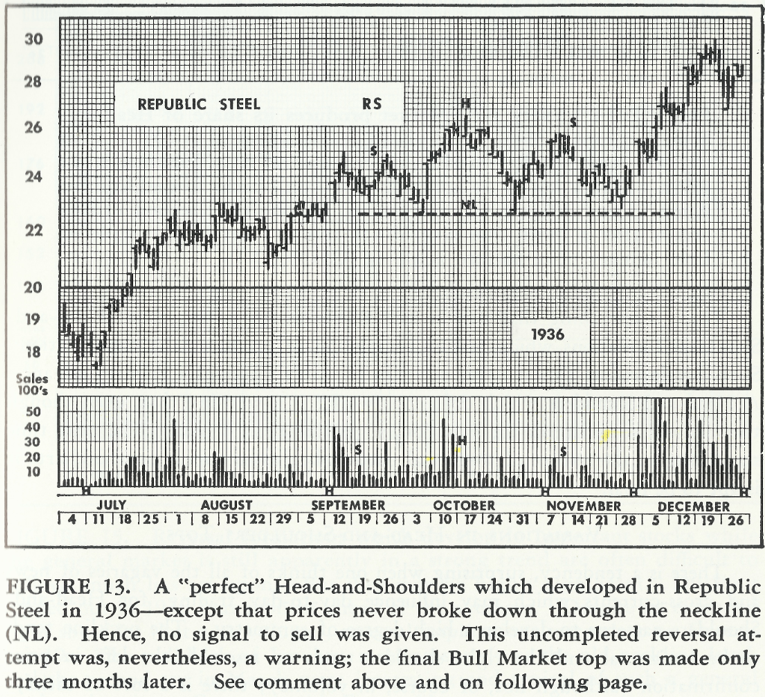
Edwards & Magee in their book Technical Analysis of Stock Trends discussed H&S failures and used the below example.
In today’s markets we continue to see similar price structures and repetition of classical chart pattern setups that were identified back in 1930s. The H&S top failure in the below short educational video is what I have identified. I highlighted the important levels for chart pattern negation, price target calculation and also the level for long signal.
Short educational video on H&S top failure
Tech Charts Membership
By becoming a Premium Member, you’ll be able to improve your knowledge of the principles of classical charting.
With this knowledge, you can merge them with your investing system. In fact, some investors use my analyses to modify their existing style to invest more efficiently and successfully.
Every week Tech Charts Global Equity Markets report features some of the well-defined, mature classical chart patterns under a lengthy watchlist and the chart pattern breakout signals that took place during that week. Global Equity Markets report covers single stocks from developed, emerging and frontier markets, ETF’s, select commodities, cryptocurrencies and global equity indices. Below chart is from the watchlist section of the weekly report. It is featuring a rectangle chart pattern on Motorola Solutions, Inc.
We are continuing our Member webinar series with chart pattern reliability and how the latest market conditions have impacted success rates on different chart patterns. We plan to have an interactive session and an open discussion to answer members’ questions on different markets and specific charts of interest. Please send your charts and questions to aksel@techcharts.net, and I will add them to the webinar discussion points.
Scheduled for: Wednesday, March 29, 8:30 am mountain (register below)
https://blog.techcharts.net/wp-content/uploads/2017/12/Tech-Charts-Webinar-.jpg427640Aksel Kibarhttps://blog.techcharts.net/wp-content/uploads/2017/05/Tech-Charts-logo-FINAL-CLEAN-340w.pngAksel Kibar2023-03-26 11:26:282023-03-26 11:26:28Live Webinar and Q&A with Aksel – Wednesday, March 29, 8:30 am mountain
The benchmark for the Global equity markets performance, the iShares MSCI All Country World Index ETF (ACWI.O) is looking for direction. So far price action has been volatile around the 200-day average. Clearly price action is morphing and on the daily and weekly scale price charts of ACWI ETF there is no clear chart pattern development. Short-term support stands at 83.7 levels. Recovery above the 200-day average can help the ETF test the resistance at 93.3 levels.
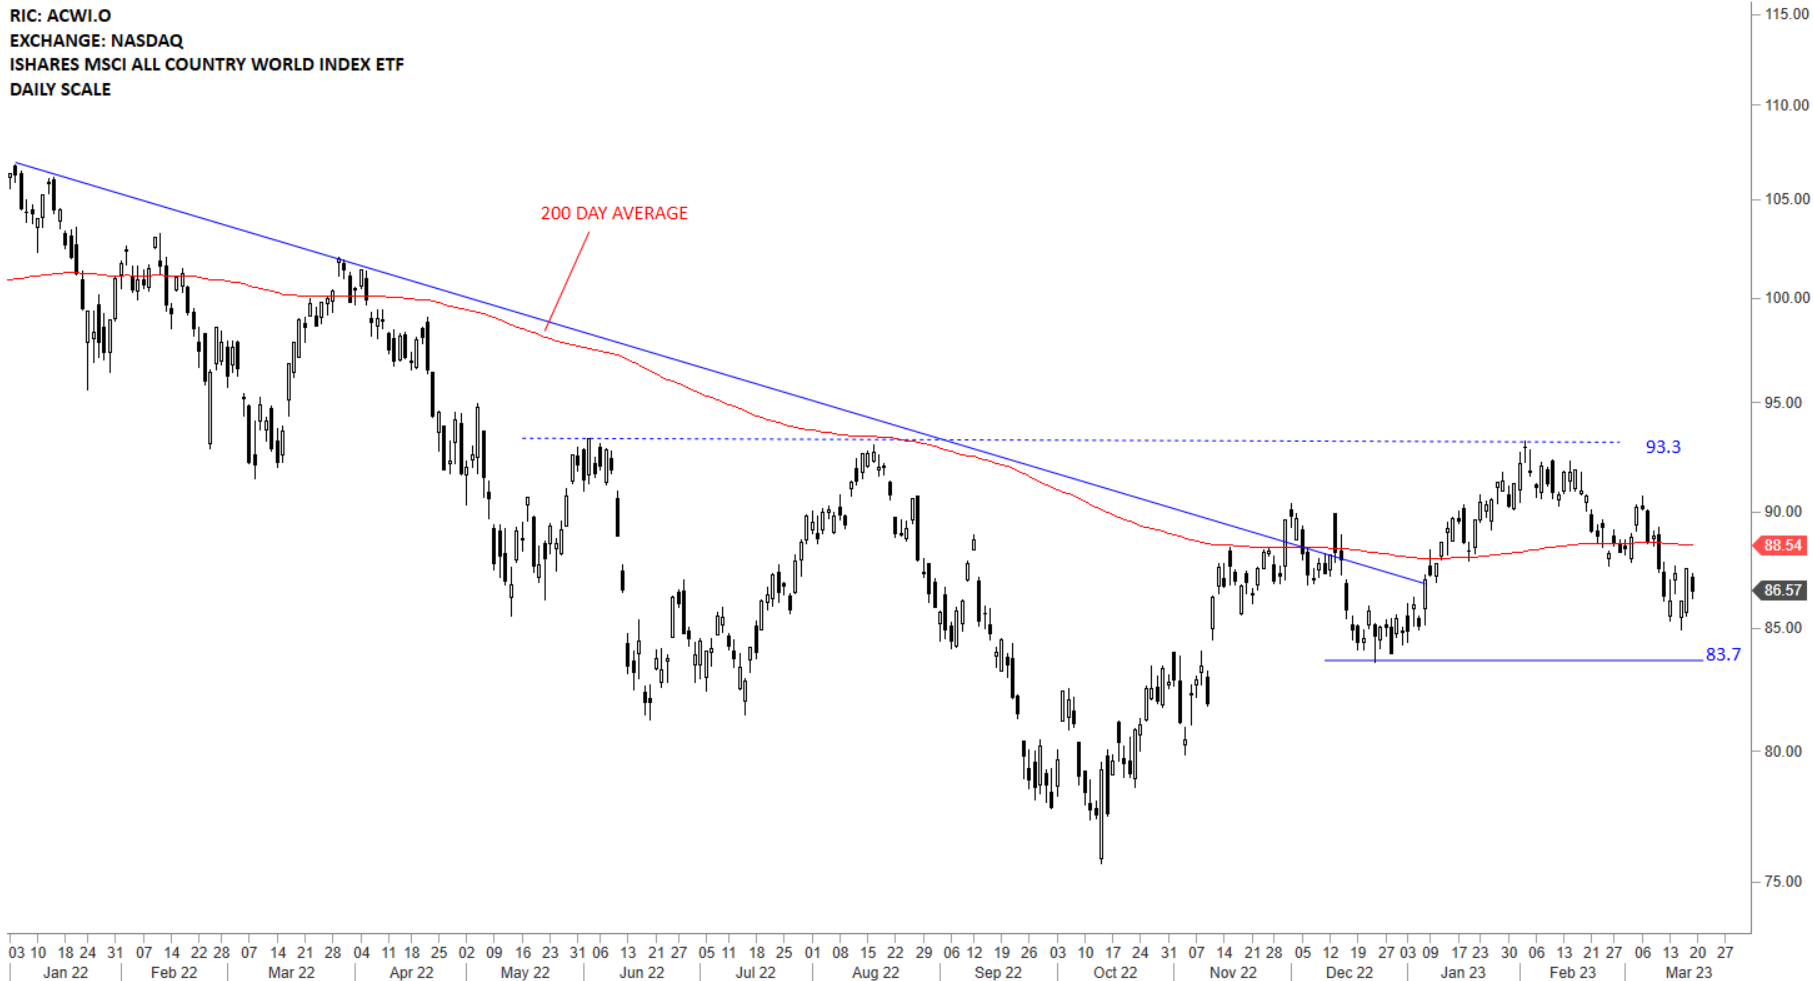
The benchmark for the Global equity markets performance, the iShares MSCI All Country World Index ETF (ACWI.O) is looking for direction. So far price action has been volatile around the 200-day average. This week’s drop below the 200-day average and 87.8 levels negated the H&S continuation chart pattern. Clearly price action is morphing and on the daily and weekly scale price charts of ACWI ETF there is no clear chart pattern development. Short-term support stands at 83.7 levels. Recovery above the 200-day average can help the ETF test the resistance at 93.3 levels.
The benchmark for the Global equity markets performance, the iShares MSCI All Country World Index ETF (ACWI.O) is looking for direction. So far price action has been volatile around the 200-day average. This week’s drop below the 200-day average and 87.8 levels negated the H&S continuation chart pattern. Clearly price action is morphing and on the daily and weekly scale price charts of ACWI ETF there is no clear chart pattern development.
Every week Tech Charts Global Equity Markets report features some of the well-defined, mature classical chart patterns under a lengthy watchlist and the chart pattern breakout signals that took place during that week. Global Equity Markets report covers single stocks from developed, emerging and frontier markets, ETF’s, select commodities, cryptocurrencies and global equity indices. Below chart is from the breakout section of the weekly report. It is featuring an ascending triangle chart pattern on E-J Holdings Inc.
Major pairs are taking their time in search for direction. Long-term chart patterns take longer to form but usually are followed by steady directional movement.