
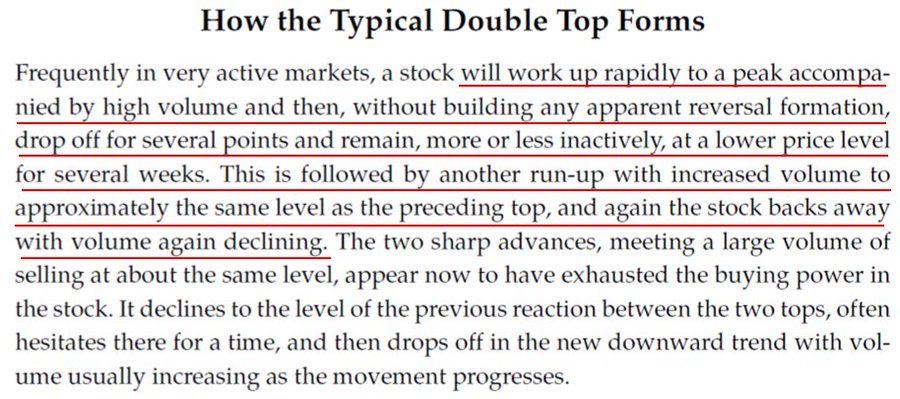
GOLD ($/OUNCE)
Every week Tech Charts Global Equity Markets report features some of the well-defined, mature classical chart patterns under a lengthy watchlist and the chart pattern breakout signals that took place during that week. Global Equity Markets report covers single stocks from developed, emerging and frontier markets, ETF’s, select commodities, cryptocurrencies and global equity indices. Below chart is from the review section of the weekly report. It is featuring a possible double top reversal on the weekly & monthly scale price charts of GOLD.
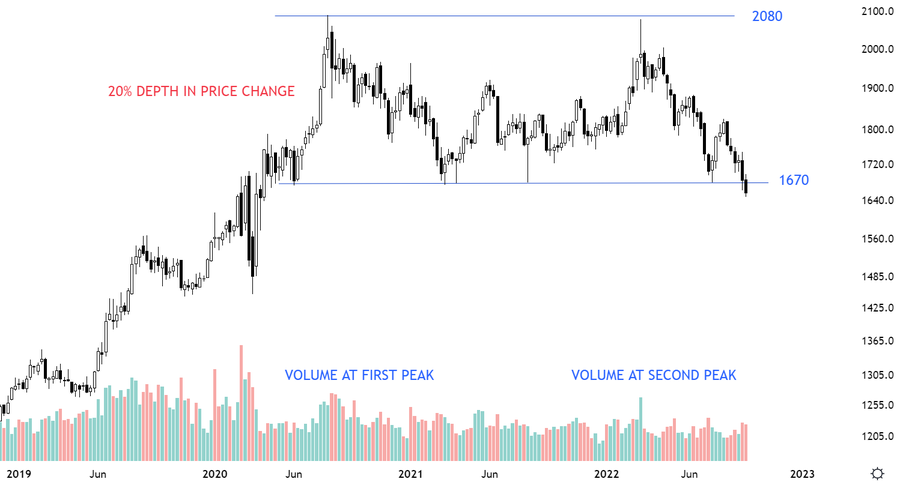
I have been categorizing Double Top and Double Bottom as rectangle. This is to reduce the confusion on terminology. Today I look at the Double Top description of Richard W. Schabacker in his book Technical Analysis and Stock Market Profits.
According to Schabacker a Double Top should have these qualities for correct labelling:
- High volume around same level at both peaks
- No less than 20% drop in price from peak to neckline
- Peaks several weeks apart
- Double top appearing after a lengthy uptrend
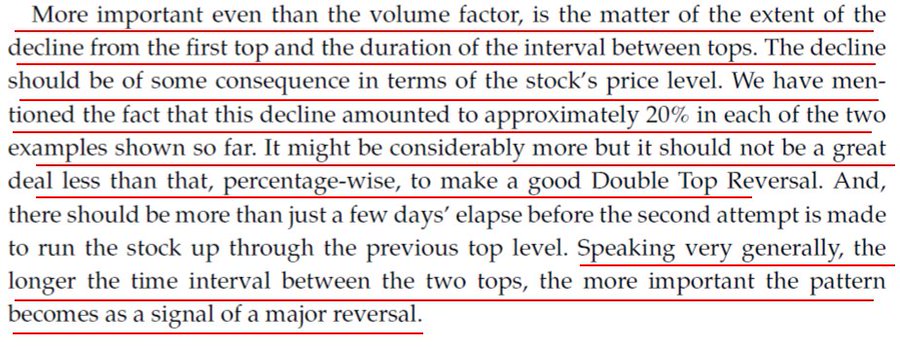
Let’s have a look at more detailed explanation from his book.
According to him, more important than volume pattern, the depth of the pattern impacts the correct labelling of the chart pattern.
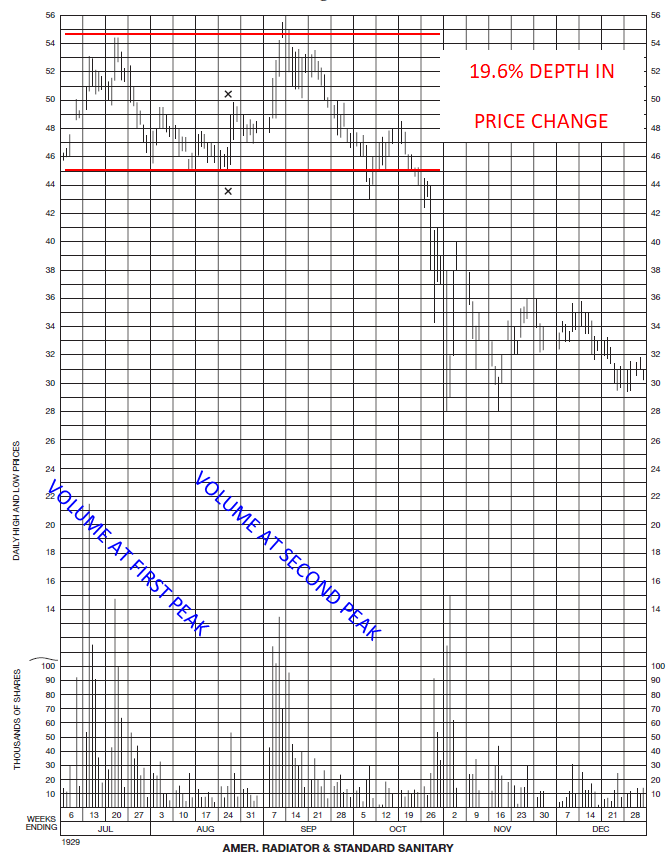
Here is a chart he used to explain a typical double top chart pattern.
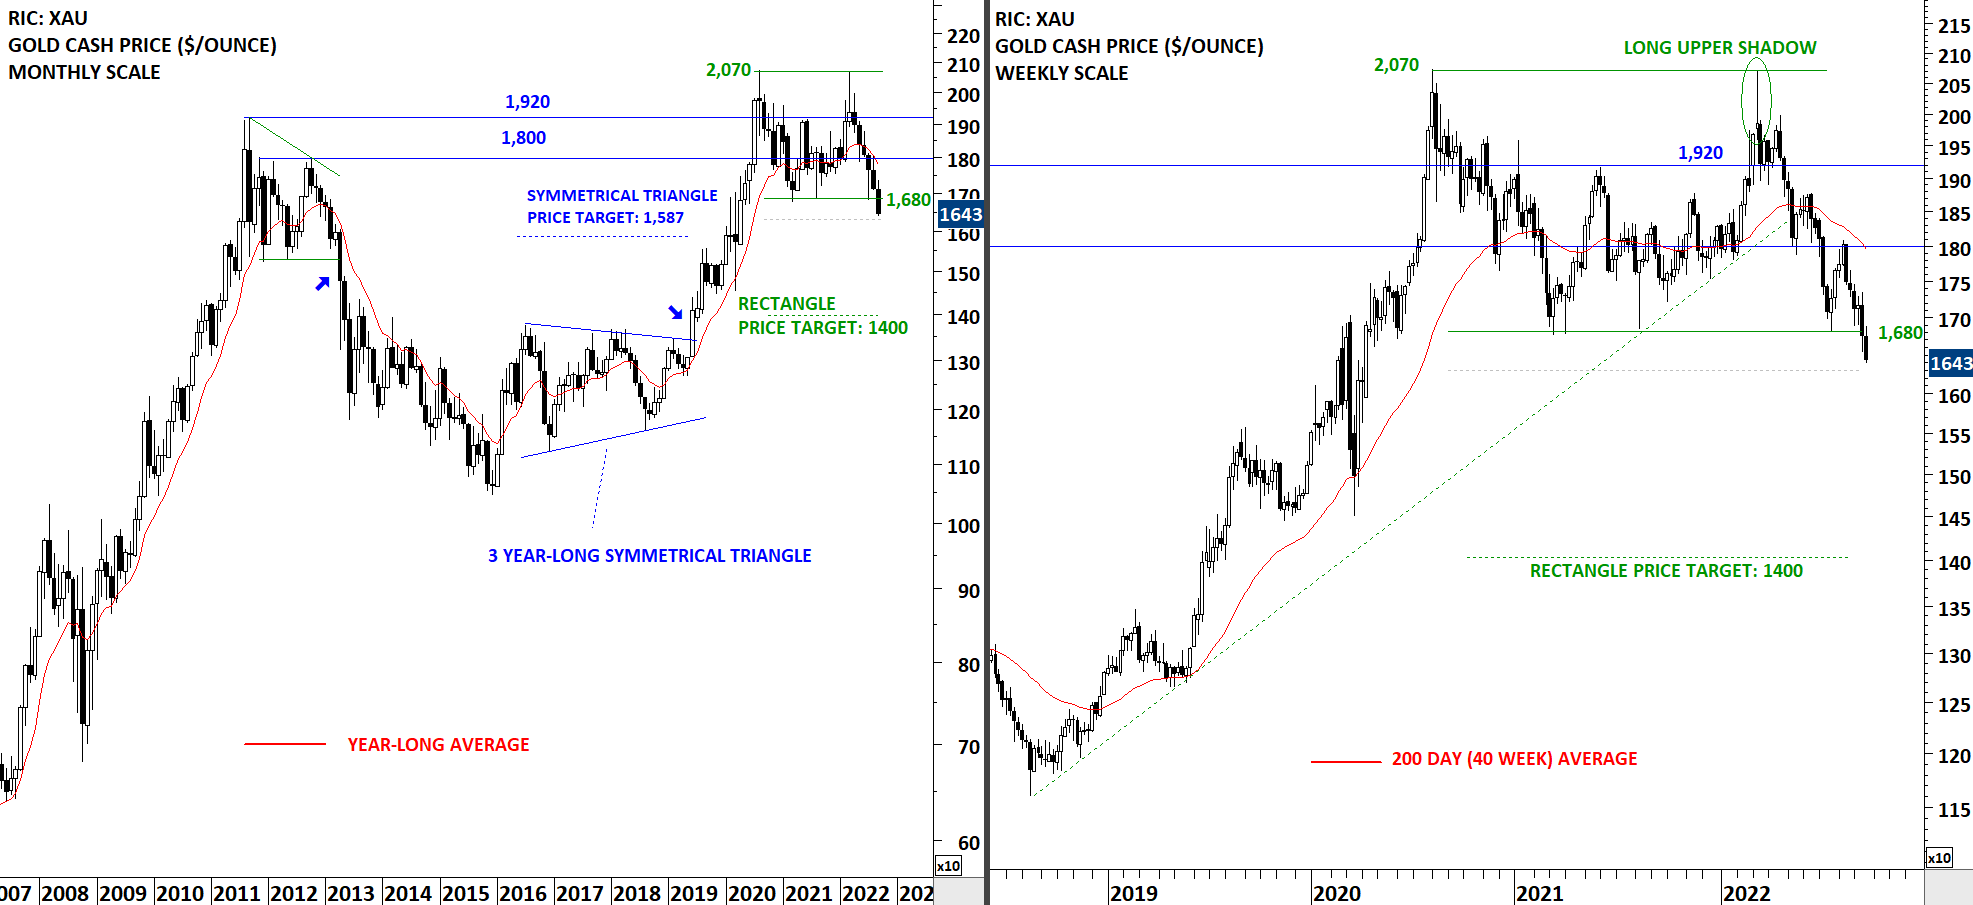
Looking at the chart pattern development on GOLD, the labelling can fit the definition of a Double Top.
Coverage on Gold from September 24, 2022 Global Equity Markets report:
Gold might be completing a rectangle/double top on the monthly scale price charts. Daily close below 1,630 levels will confirm the breakdown and suggest lower levels in the coming months. Low volatility condition on monthly scale price chart is similar to 2013 and 2019 consolidations. Each one of those was followed by strong directional movement. If the pattern completes on the downside with a long monthly candle, I will expect the directional move continue towards 1,400 levels. 1,680 levels becomes the new resistance. A sharp reversal above 1,680 levels can change the negative outlook to neutral.
Tech Charts Membership

By becoming a Premium Member, you’ll be able to improve your knowledge of the principles of classical charting.
With this knowledge, you can merge them with your investing system. In fact, some investors use my analyses to modify their existing style to invest more efficiently and successfully.

As a Premium Member of Aksel Kibar’s Tech Charts,
You will receive:
-
Global Equities Report. Delivered weekly.
-
Classical charting principles. Learn patterns and setups.
-
Actionable information. Worldwide indices and stocks of interest.
-
Risk management advice. The important trading points of each chart.
-
Information on breakout opportunities. Identify the ones you want to take action on.
-
Video tutorials. How patterns form and why they succeed or fail.
-
Watch list alerts. As they become available so you can act quickly.
-
Breakout alerts. Usually once a week.
-
Access to everything (now and as it becomes available)o Reports
o Videos and video series -
Multi-part webinar course. You learn the 8 most common charting principles.
-
Webinars. Actionable and timely advice on breaking out chart patterns.
For your convenience your membership auto renews each year.


