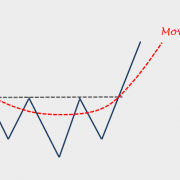
Moving Averages
This content is for members only

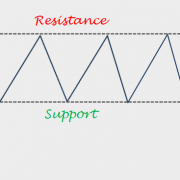


In April 2018, I was invited to share my experiences in charting the Middle East and Africa equity markets at the Dubai Traders Summit. The event was not recorded. I wanted to make this presentation available for our members so I recorded this educational video, featuring parts of the presentation I shared at the event. This section focuses on Rectangle examples. I hope you will find it valuable.
![]()

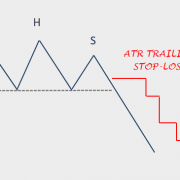
In April 2018, I was invited to share my experiences in charting the Middle East and Africa equity markets at the Dubai Traders Summit. The event was not recorded. I wanted to make this presentation available for our members so I recorded this educational video, featuring parts of the presentation I shared at the event. This section focuses on H&S bottom examples. I hope you will find it valuable.
![]()

