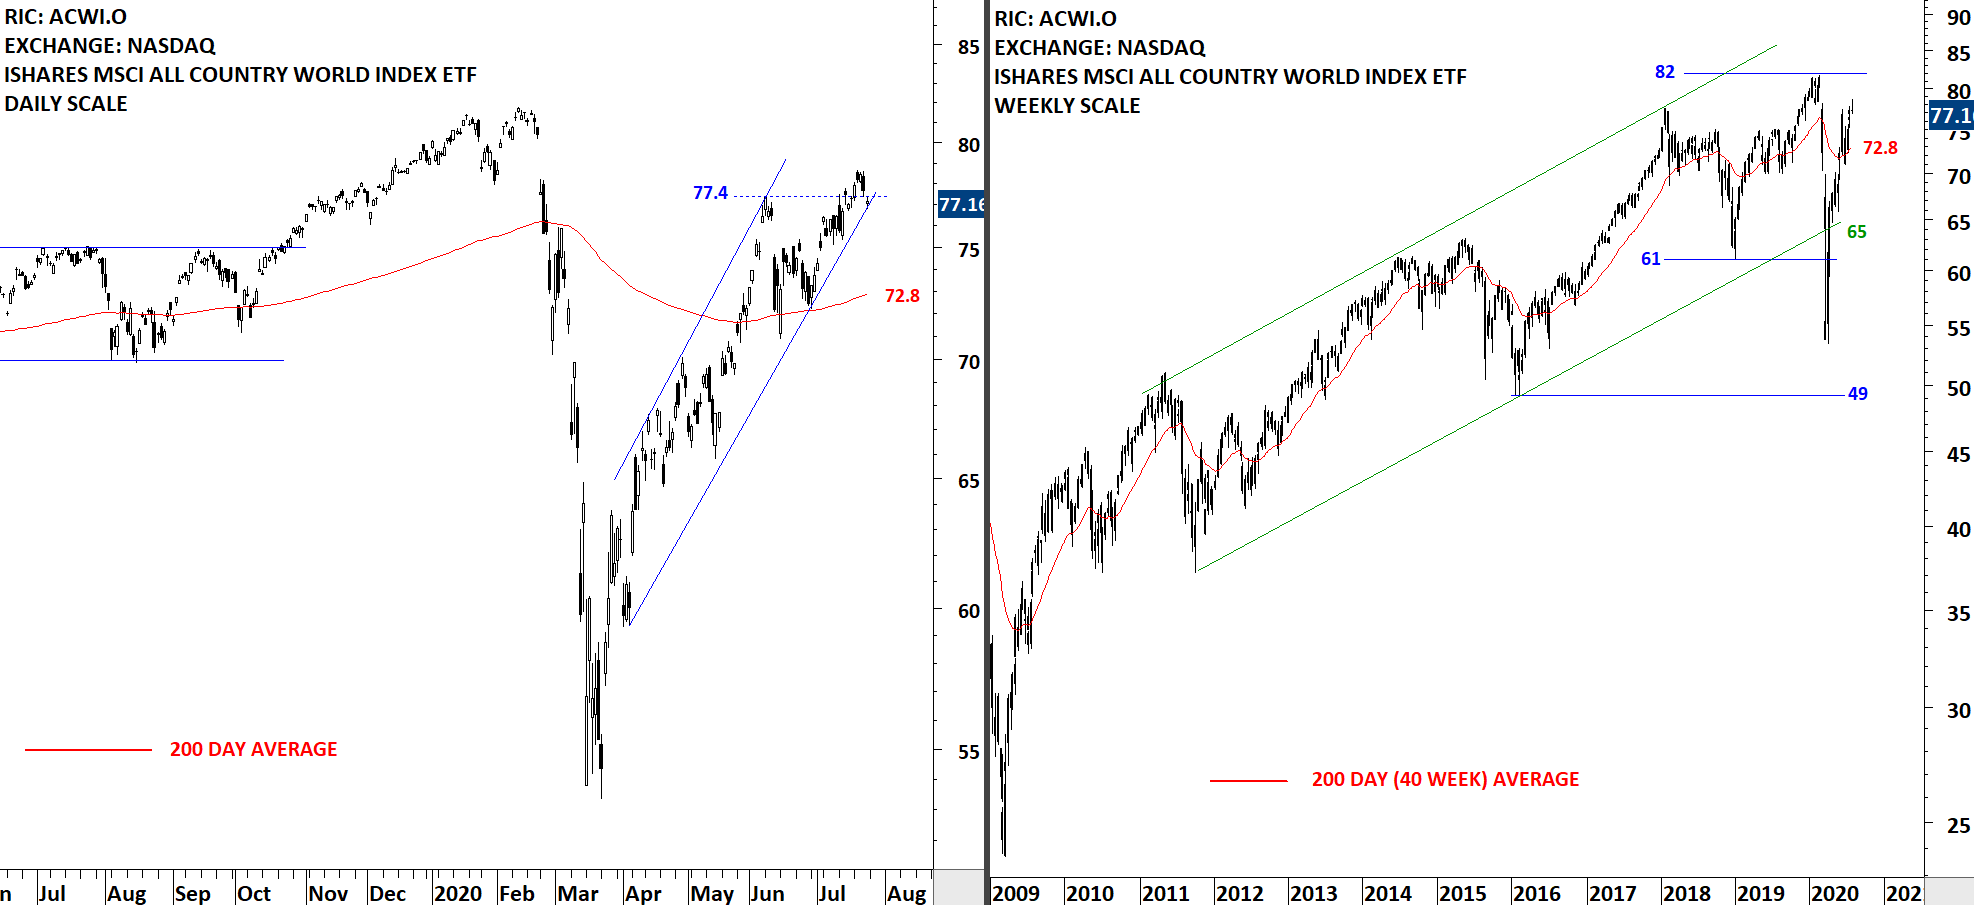
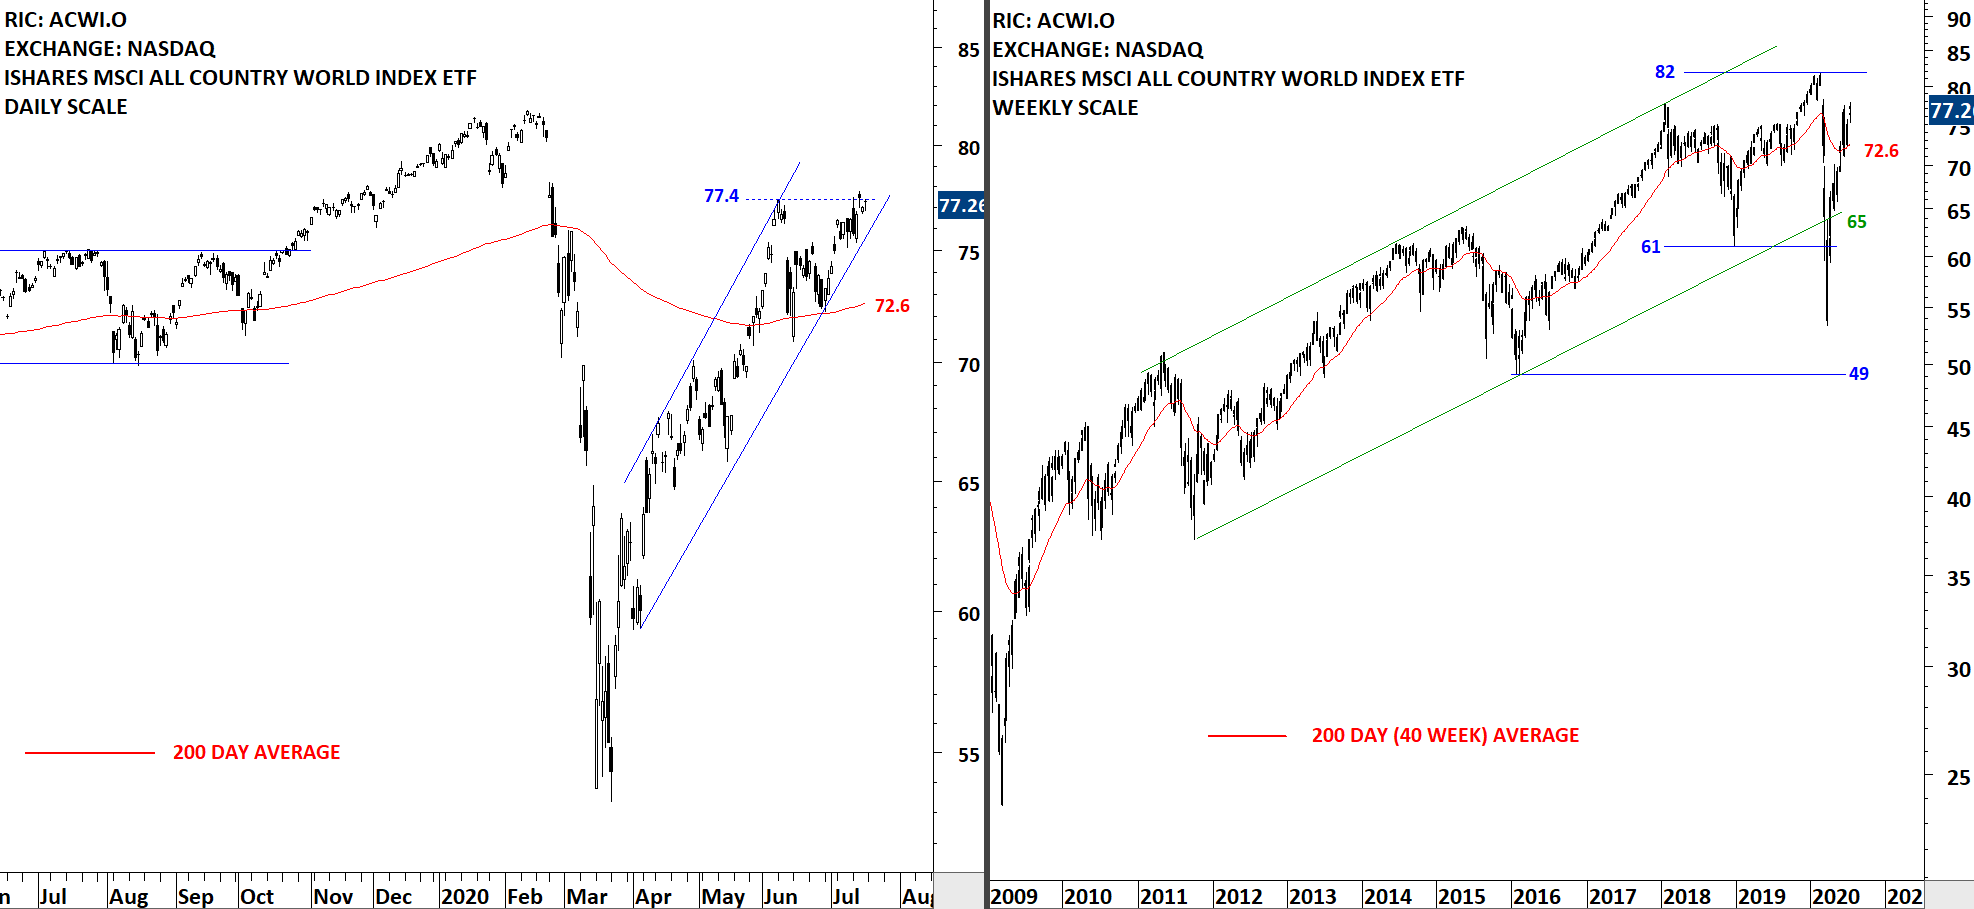
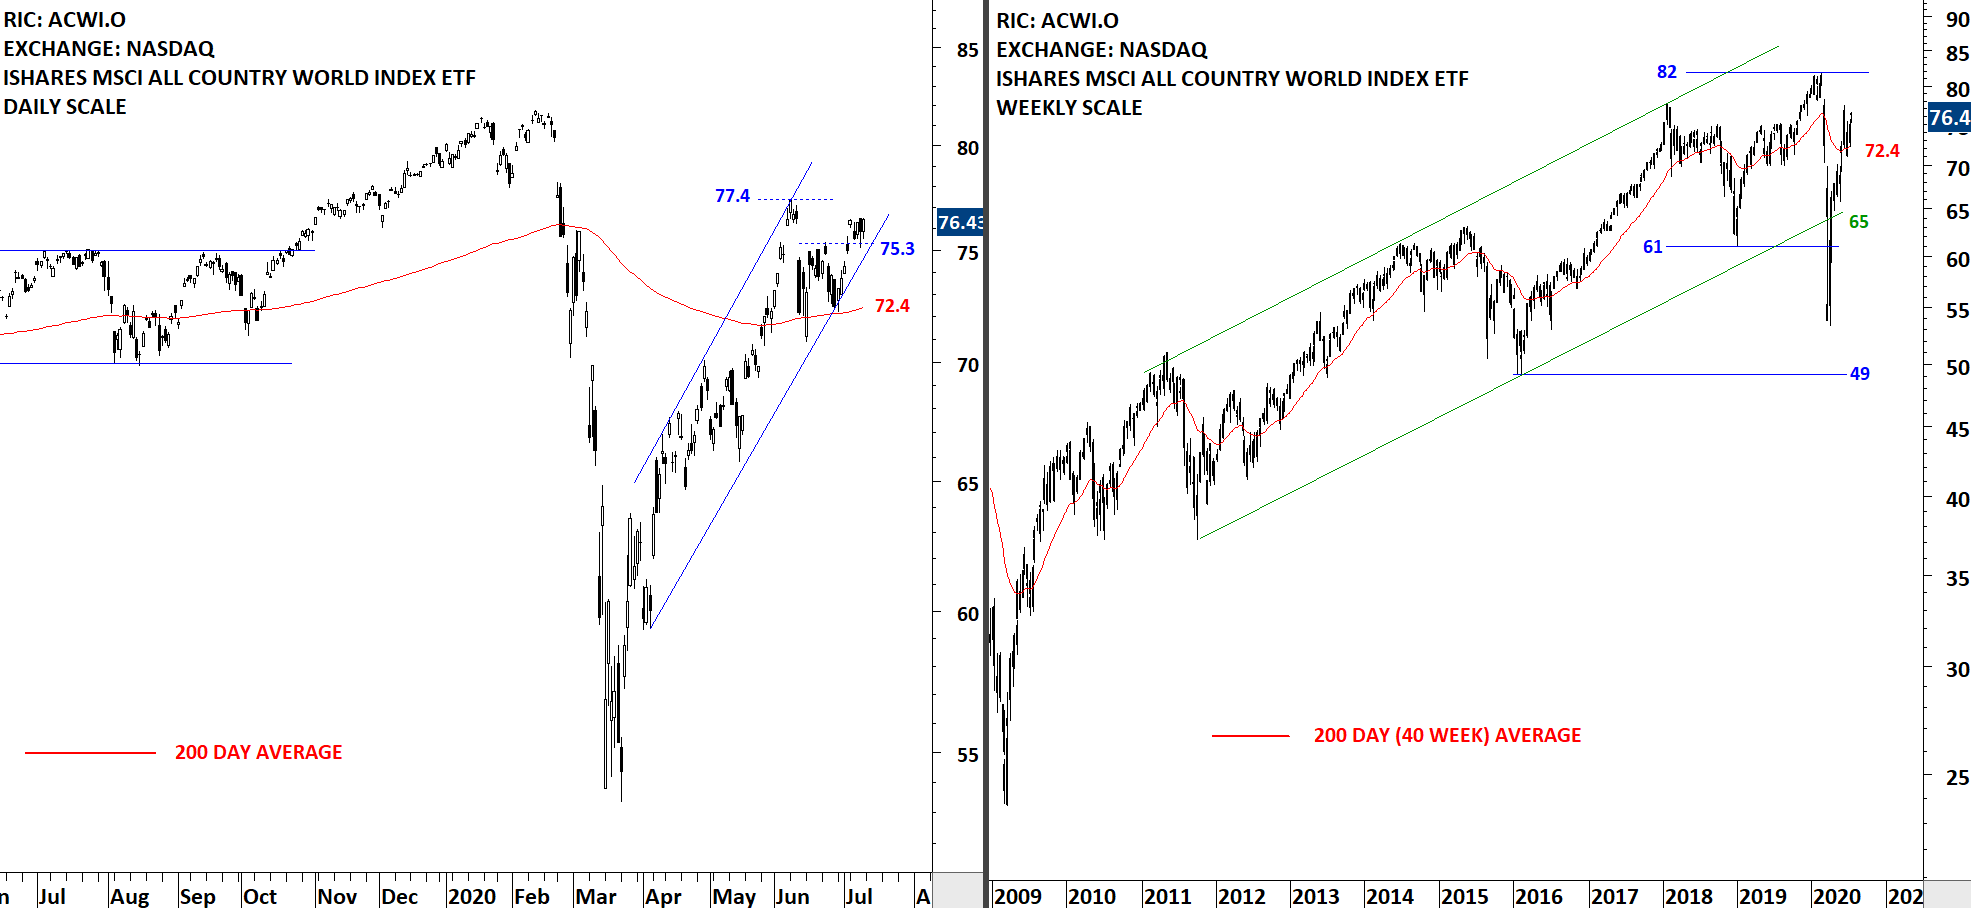
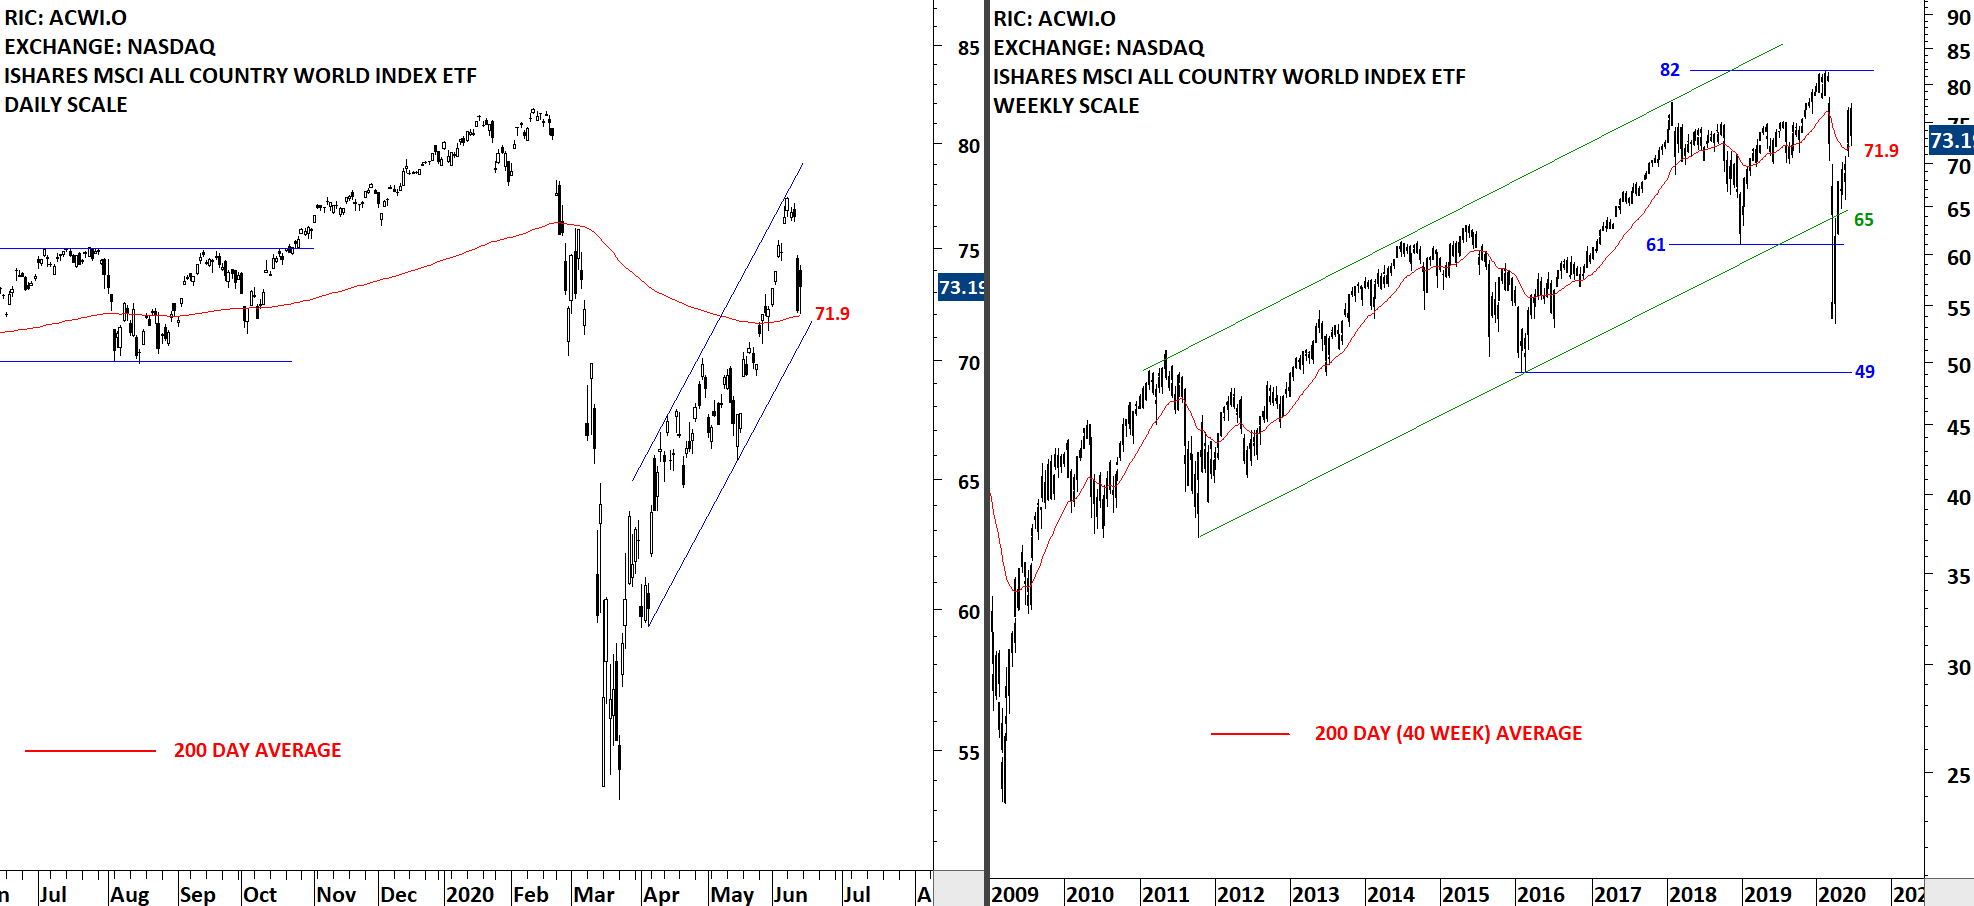
GLOBAL EQUITY MARKETS – April 20, 2019

REVIEW


The benchmark for the Global equity markets performance, the iShares MSCI All Country World Index ETF (ACWI.O), is now very close to a horizontal resistance at 74.8 levels. Given the magnitude of the strong rebound and the steady rise without any pullback, one can't rule out the possibility of a breather/pause around the resistance at 74.8 levels. If we see a pullback, the 200-day moving average which is currently at 70.6 levels can act as support.

Read More

GLOBAL EQUITY MARKETS – April 13, 2019

REVIEW


The benchmark for the Global equity markets performance, the iShares MSCI All Country World Index ETF (ACWI.O) is now close to a horizontal resistance at 74.8 levels. The ETF had a strong rebound from 63 levels. The V-bottom reversal was followed by the ETF clearing its long-term moving average in February. Since then the ACWI ETF has been trending above its long-term average. I consider price action above the long-term average as positive and classify it as an uptrend. Though it is important to note that, last few month's price action has been steep and such steep advances are not sustainable. During any setback the long-term moving average at 70.45 levels will act as support. Short-term resistance stands at 74.8 levels.

Read More

Live Webinar and Q&A with Aksel – Thursday, April 18, 8:30am mountain

Dear Tech Charts Members,

We are continuing our Member webinar series with inverse H&S chart pattern that acts as a bottom reversal and also as a continuation. Over the past few weeks Global equity markets report identified some well-defined and mature H&S bottom reversals and H&S continuation chart patterns. I hope to highlight differences between these two types of bullish chart patterns and discuss how they develop in the general context of overall price action.

Scheduled for: Thursday, April 18 at 8:30am MST (register below)

The upcoming webinar is dedicated to a thorough discussion on inverse head and shoulder (reversal) and bullish H&S continuation.

  • We will review some of those chart pattern breakouts that were featured in the Global Equity Markets report.
  • We will review some of the qualities we look for when identifying and differentiating H&S bottom and H&S continuation
  • We will look at some of the developing bullish continuation chart patterns
  • We will continue to highlight Tech Charts members favorite chart pattern setups in different equity markets. As always please feel free to send charts for discussion.
  • We will have a member Q&A at the end of the webinar.

Read More

INTERIM UPDATE – April 11, 2019

A short-term bullish opportunity might be developing in Energy sector equities in Global markets. Last week's Global Equity Markets report featured SPDR S&P OIL & GAS EXPLORATION & PRODUCTION ETF (XOP). This interim update adds few more well-defined horizontal chart pattern setups that can resolve on the upside. Breakouts from these consolidations can add momentum to Energy related equities.

Read More

GLOBAL EQUITY MARKETS – April 6, 2019

REVIEW


The benchmark for Global equity markets performance, the iShares MSCI All Country World Index ETF (ACWI.O) continues to remain strong. The ETF had a strong rebound from support at 63 levels and since then the uptrend resumed without any significant setback. In February the ETF cleared its 200-day moving average and continues to trend above its long-term average. In the short-term horizontal resistance at 74.8 levels can act as an overhead supply. Strong support is the 200-day average at 70.3 levels.

Read More

Moving Averages

This content is for members only

GLOBAL EQUITY MARKETS – March 30, 2019

REVIEW


The benchmark for the Global equity markets performance, the iShares MSCI All Country World Index ETF (ACWI.O) is trying to find direction above its long-term average. We can see choppy price action around the 200-day average. More important is how the index will consolidate around the average. If it forms an orderly, recognizable short-term consolidation (in the form of a flag, pennant, rectangle, symmetrical triangle) I will conclude that the index is preparing for a new leg up. 200-day moving average is forming support at 70.15 levels.

Read More

INTERIM UPDATE – March 29, 2019

One of my daily tasks is to go through +/- 2,000 names in search for well-defined classical chart patterns. I do this throughout the week. I disconnect from the markets during trading hours and run my research. As the weekend nears, I start finalizing new additions to the watchlist section of the weekly report. I like to inform members ahead of breakouts letting enough time to run their own due diligence on the companies discussed.

The chart below was part of the upcoming report's watchlist. However, it seems like there is a possibility of a breakout prior to the weekend. I think it is important for our members to be informed about this chart  setup.

Read More

GLOBAL EQUITY MARKETS – March 23, 2019

REVIEW


The benchmark for the Global equity markets performance the iShares MSCI All Country World Index ETF (ACWI.O) is trying to find direction above its long-term average. In March the index pulled back to the 200-day average and rebounded. Past few day's trading once again pulled the index towards the long-term average that can act as support around 70 levels. We can see choppy price action around the 200-day average. More important is how the index will consolidate around the average. If it forms an orderly, recognizable short-term consolidation (in the form of a flag, pennant, rectangle, symmetrical triangle) I will conclude that the index is preparing for a new leg up. Price action in 2016 is a good explanation of what I would like to see around the 200-day average to call for a change in trend. (A sharp drop, followed by a strong rebound that breaches the 200-day average, followed by choppy price action in search of a new trend and eventually forming a recognizable chart pattern)

Read More

GLOBAL EQUITY MARKETS – March 16, 2019

REVIEW


The benchmark for the Global equity markets performance, the iShares MSCI All Country World Index ETF (ACWI.O) found support above its 200-day (40 week) average. Sharp V-reversal from the low of January 2019 didn't encounter a pullback/correction. I analyze the price action that manages to consolidate and find support above its long-term average as positive and review the ACWI ETF with a bullish bias. During any pullback or further sideways consolidation, the 200-day moving average at 69.9 levels will act as support.

Read More