GLOBAL EQUITY MARKETS – December 10, 2022
REVIEW
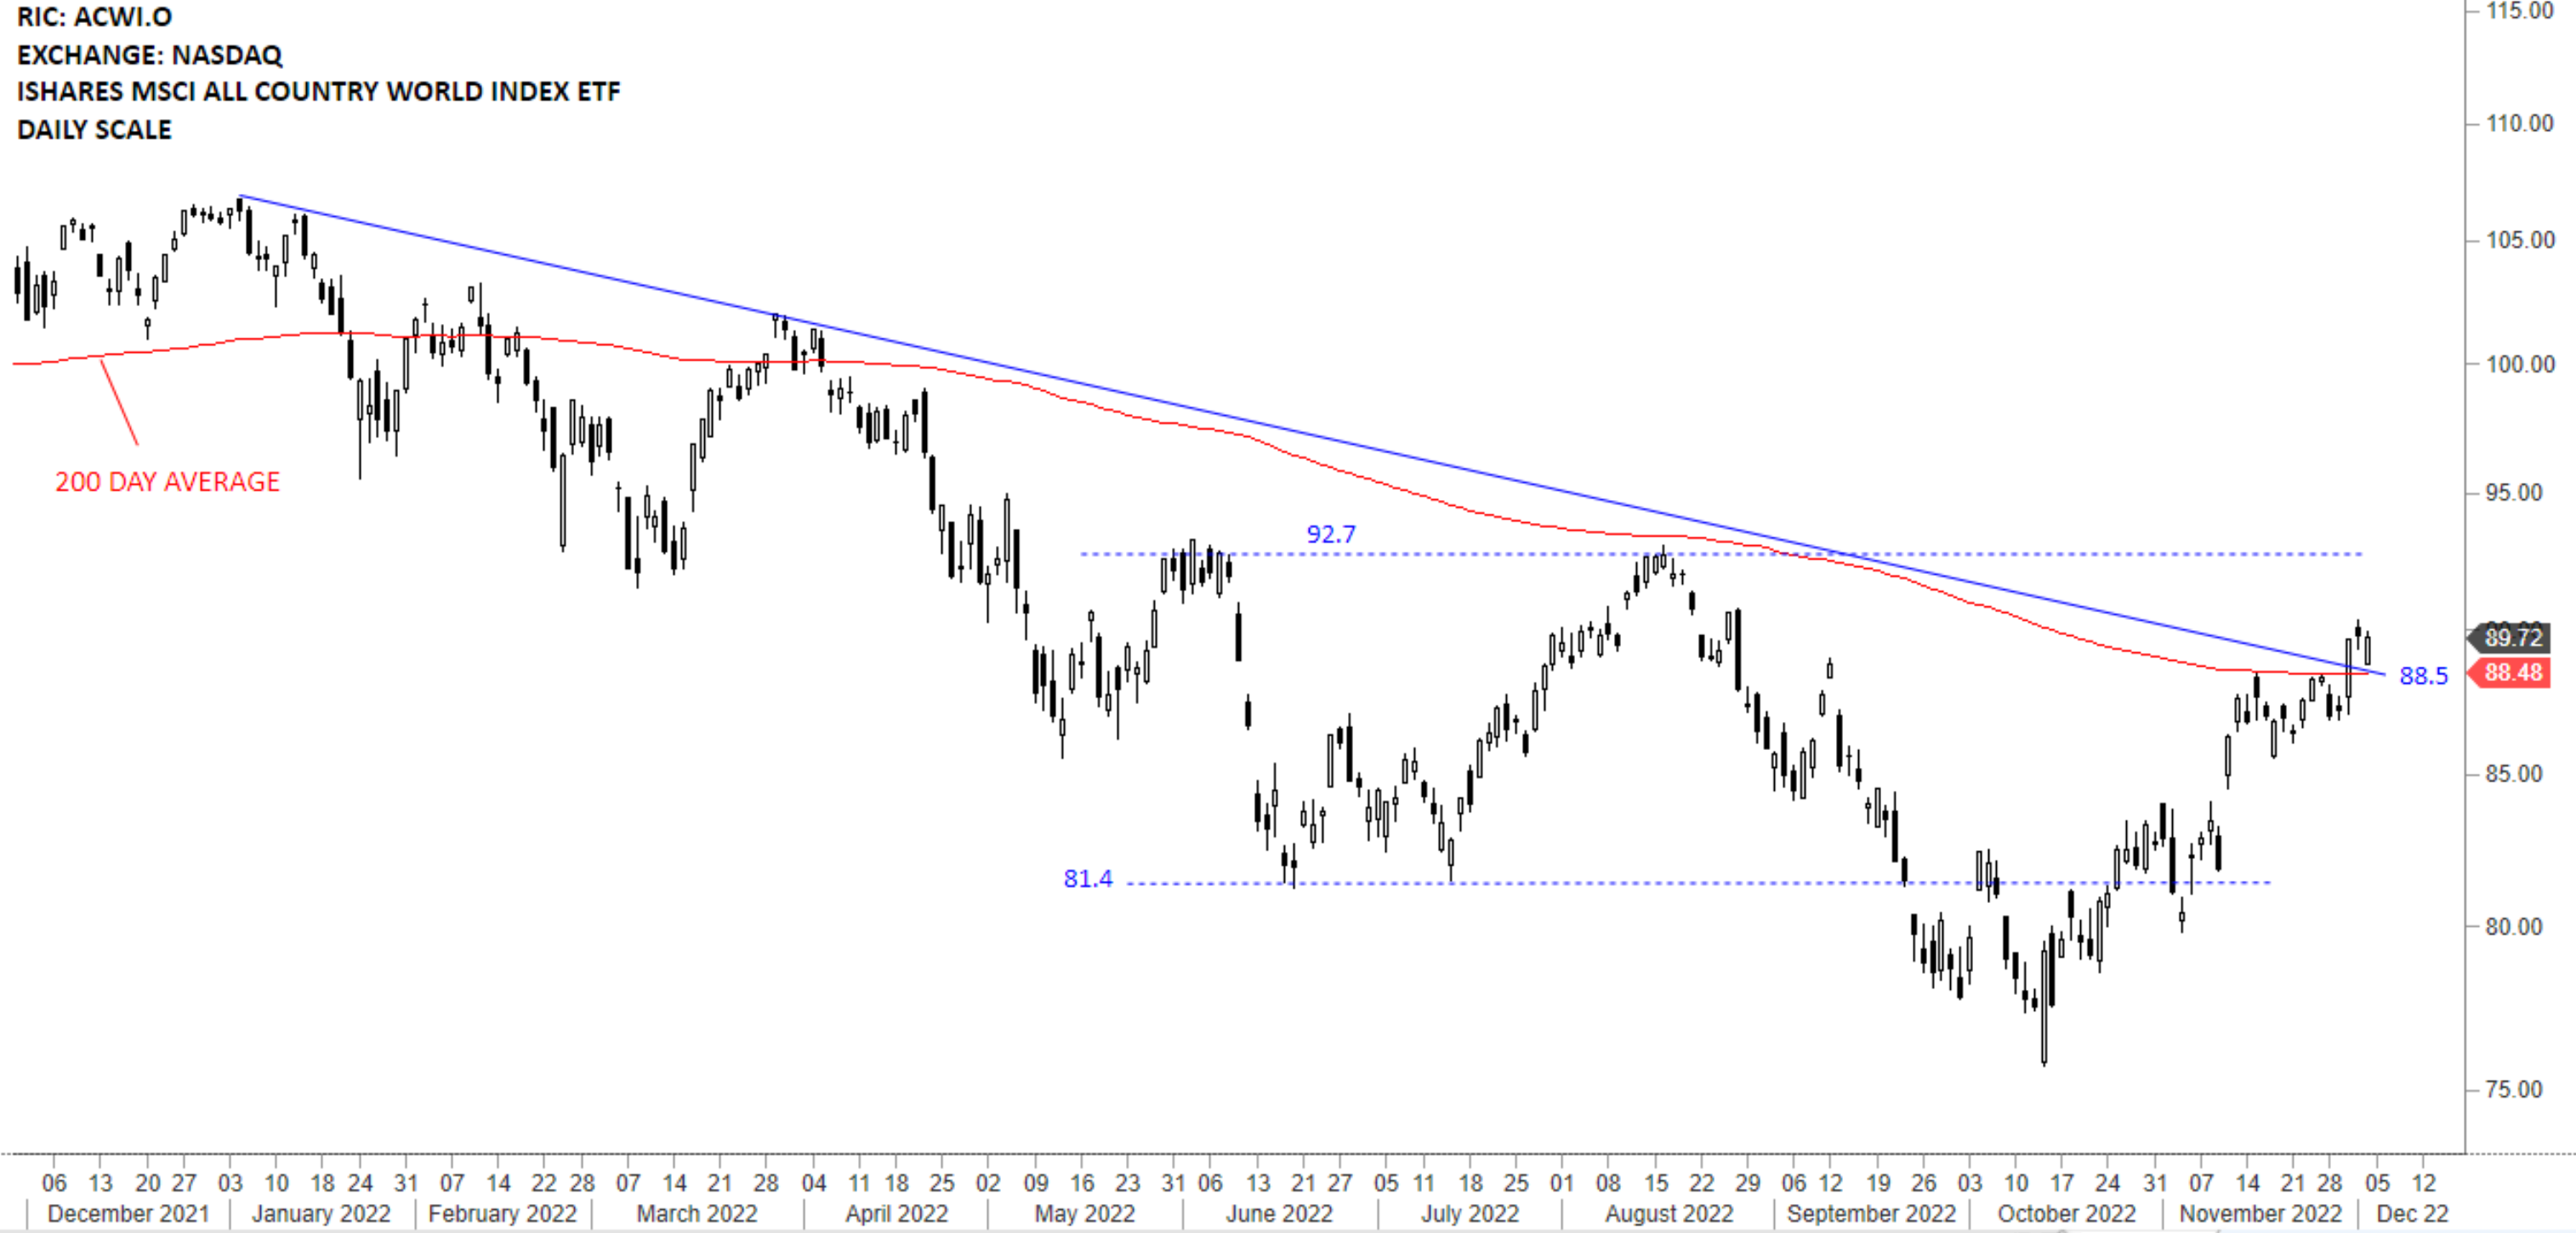
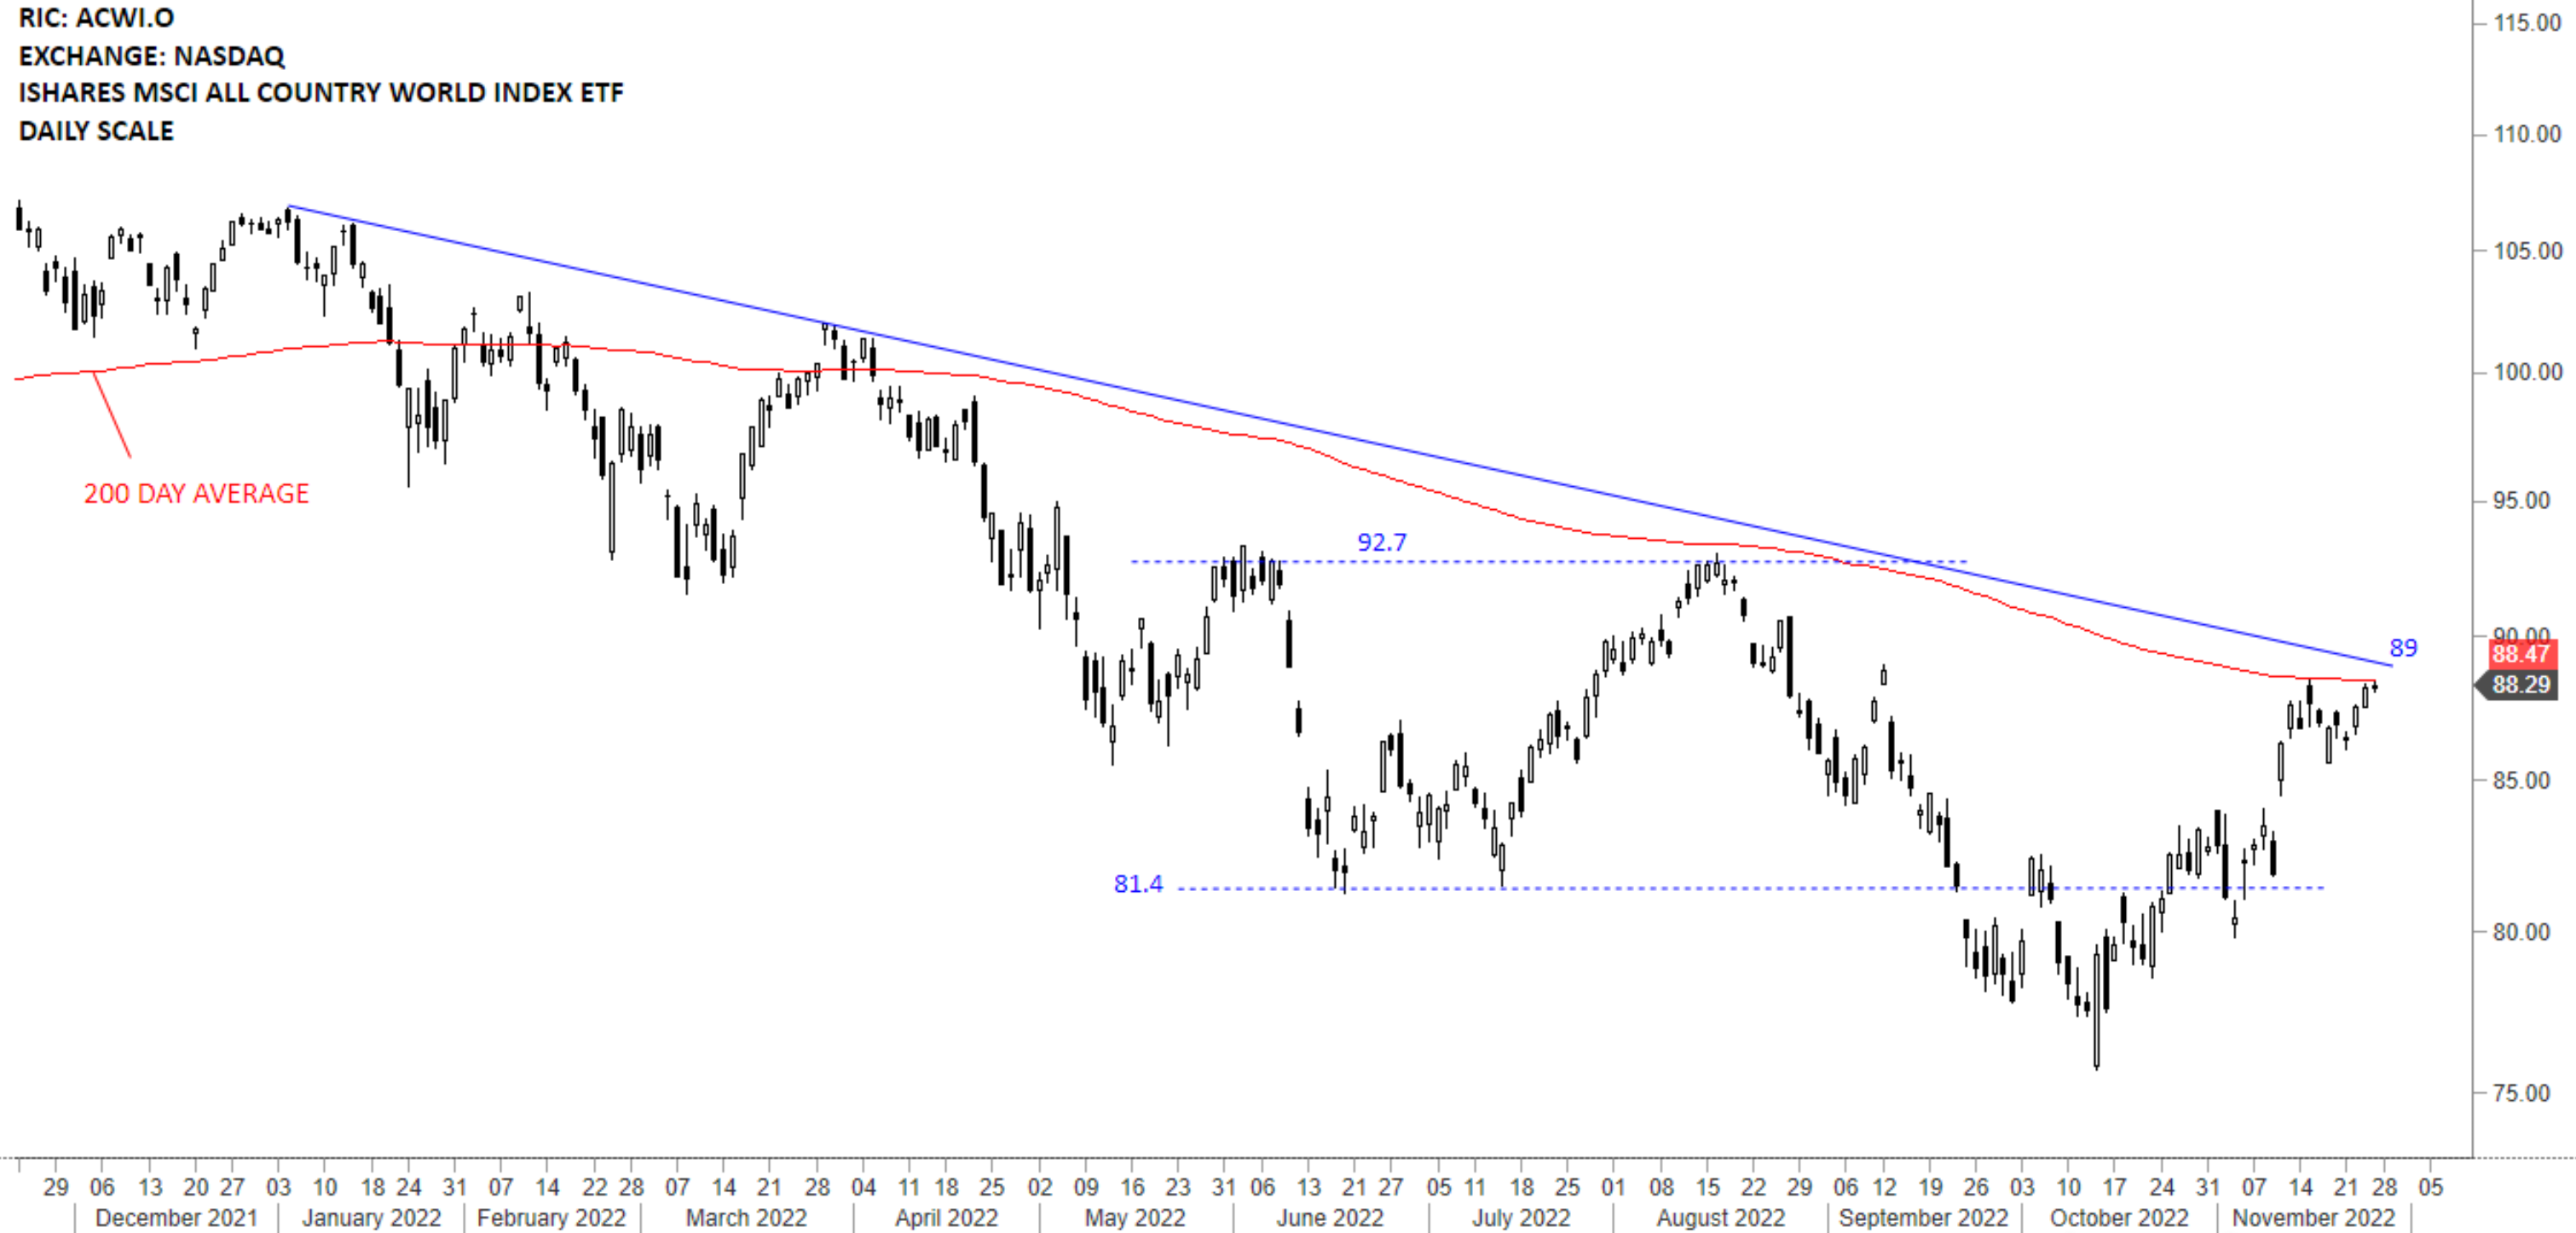
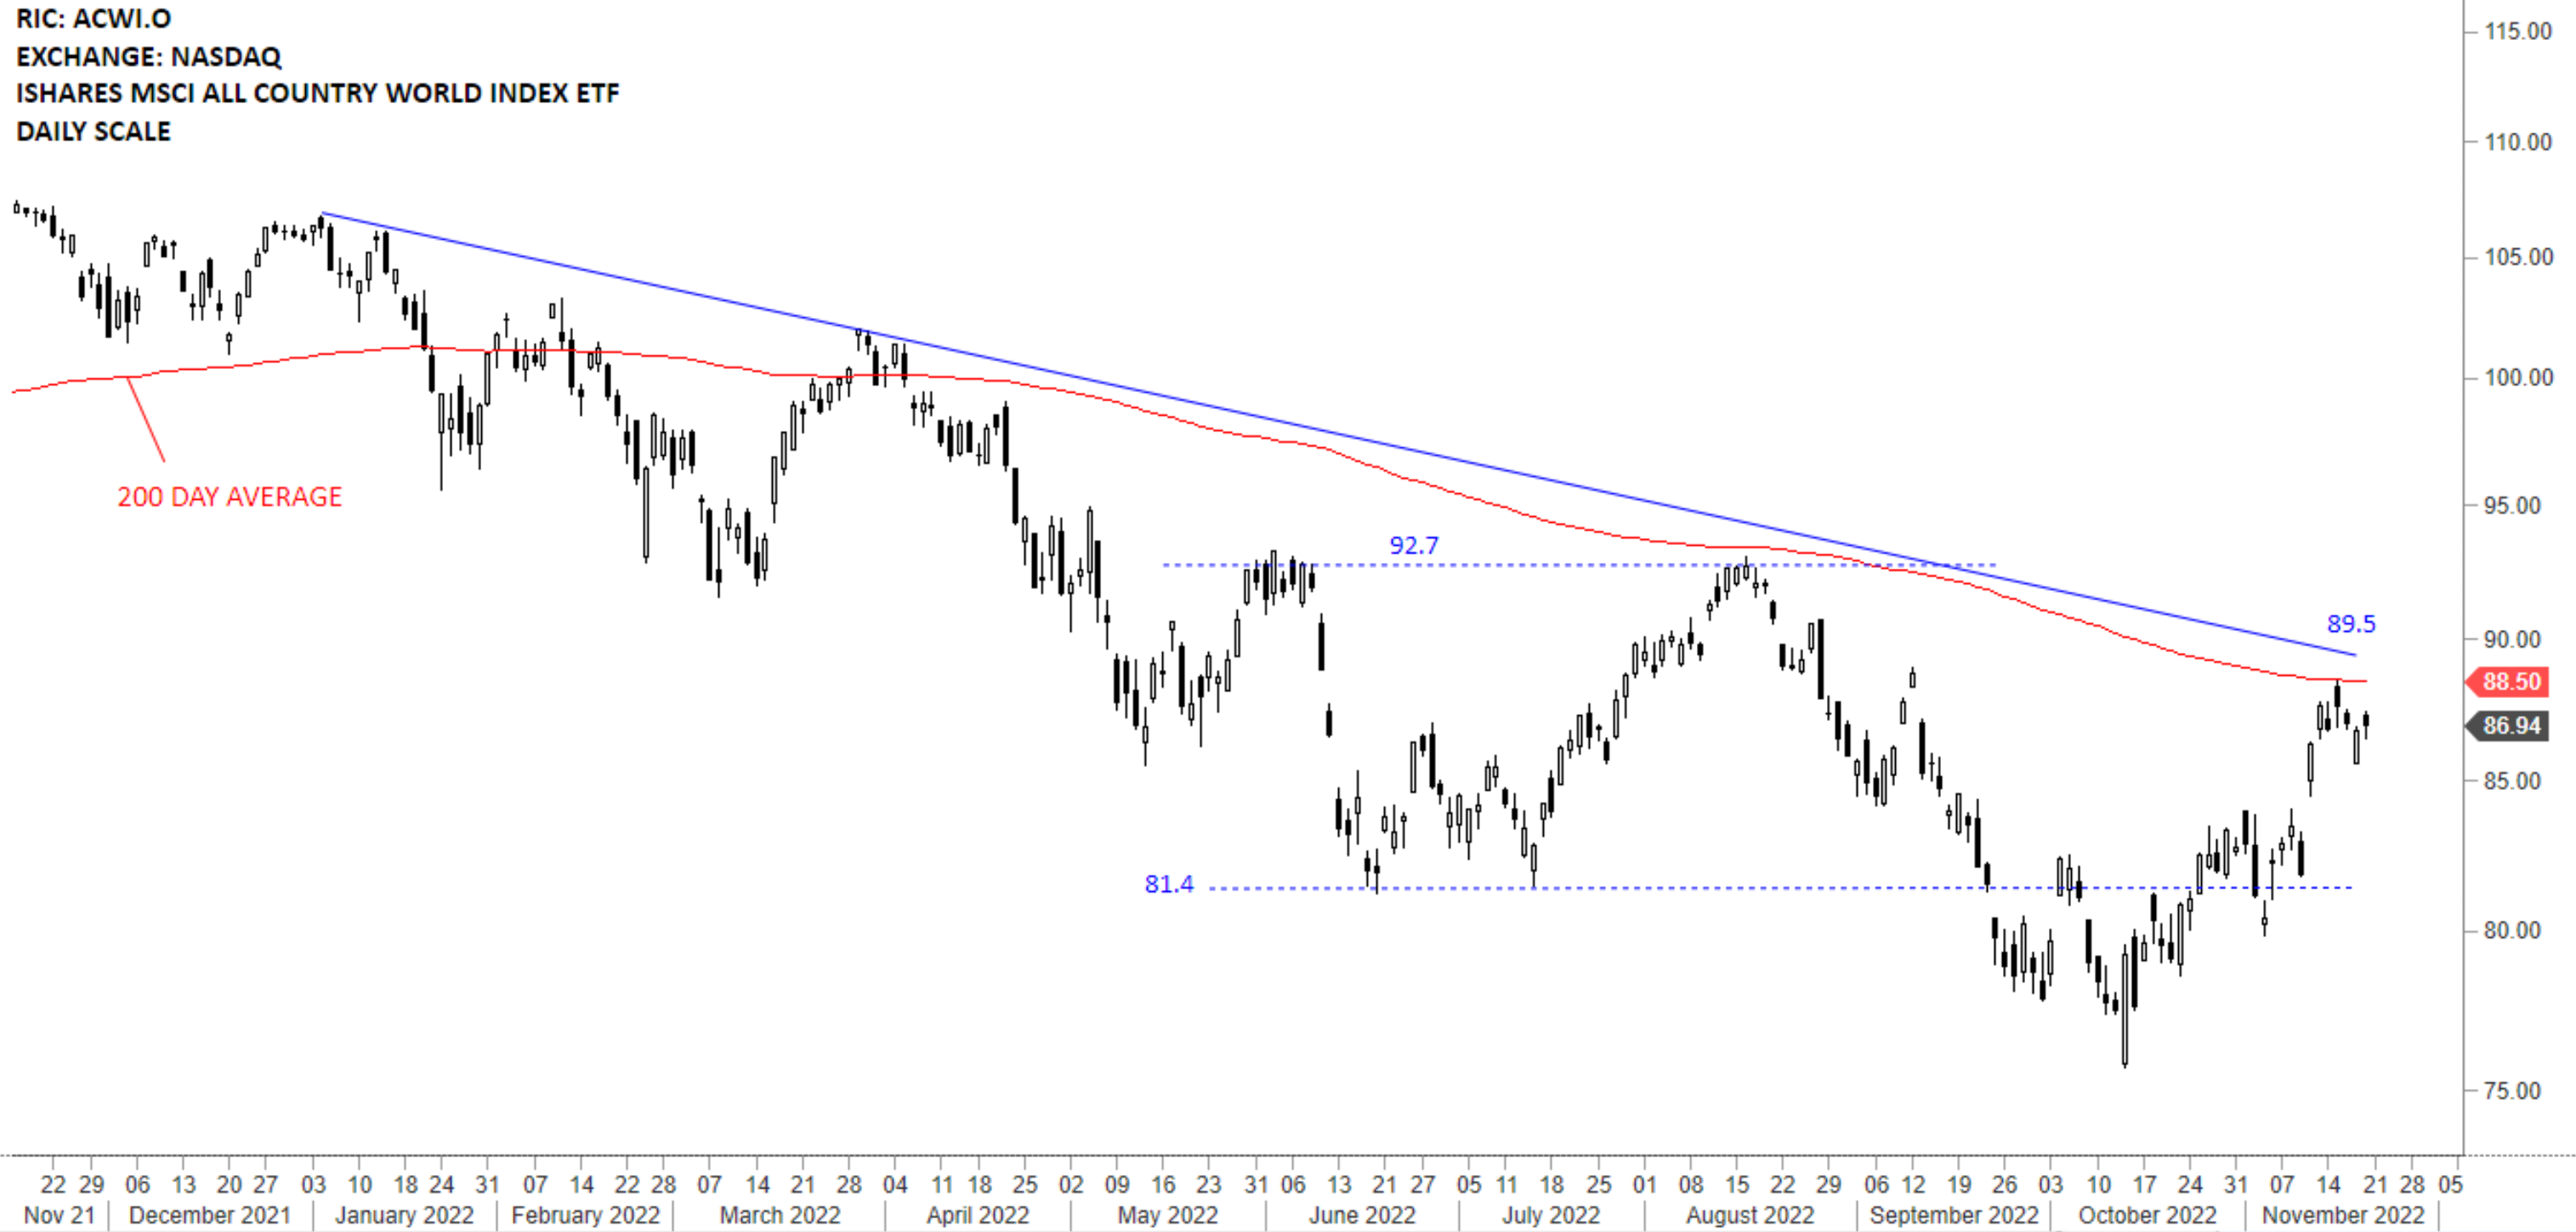
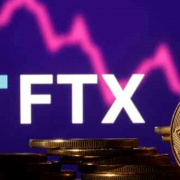
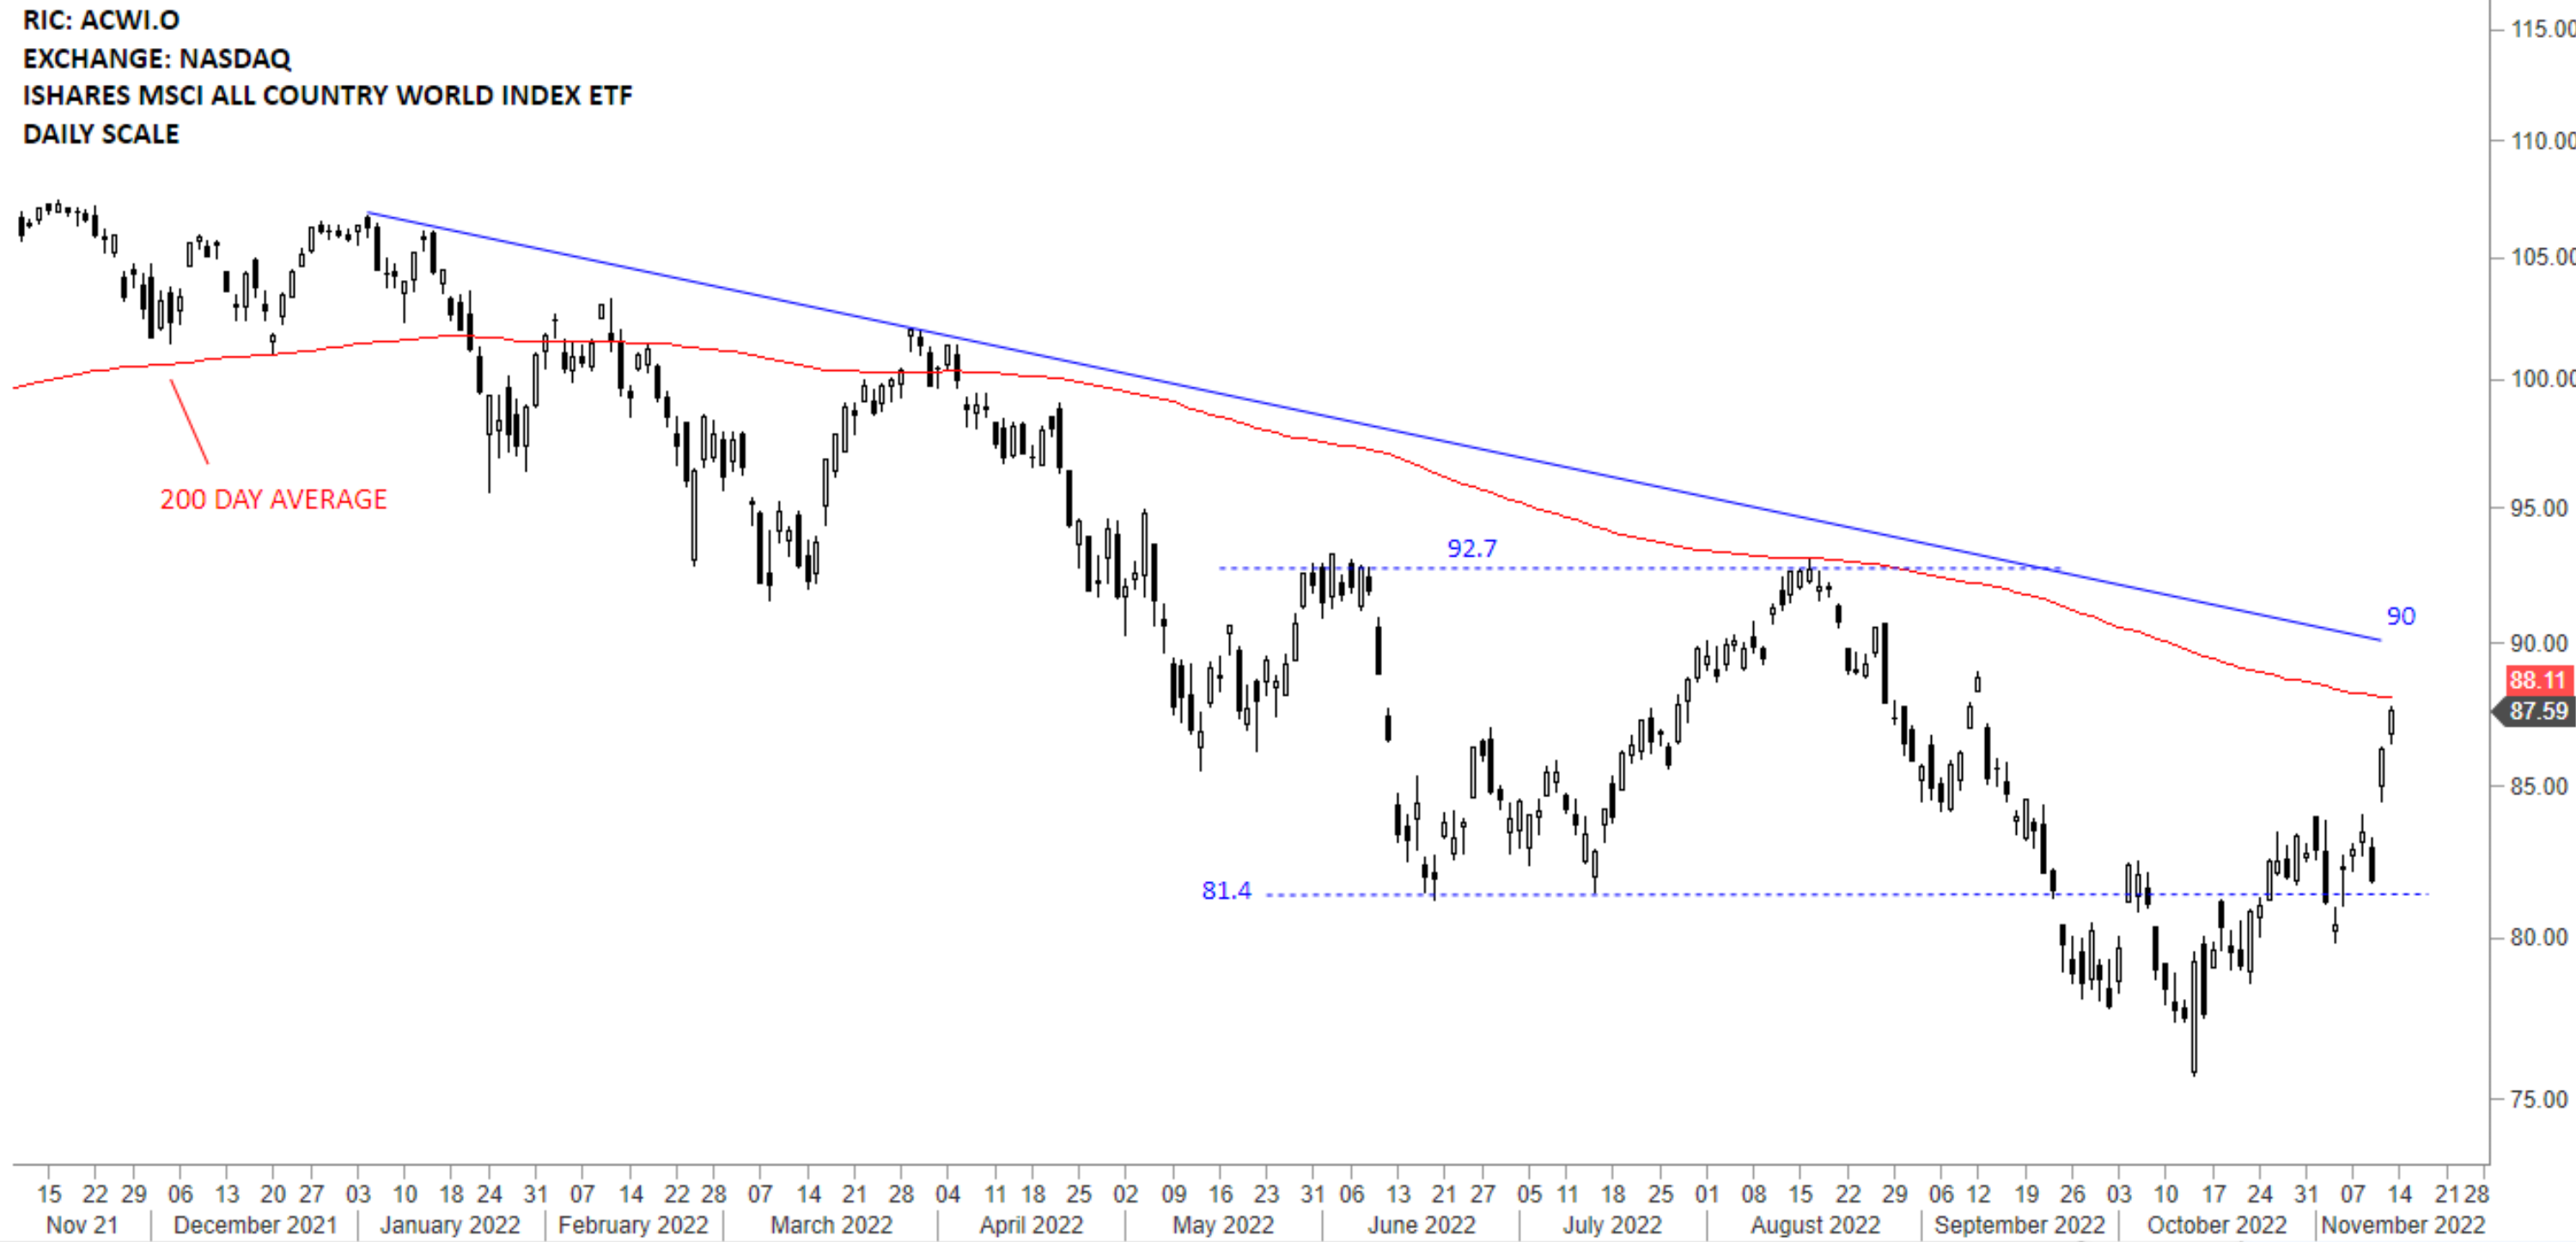
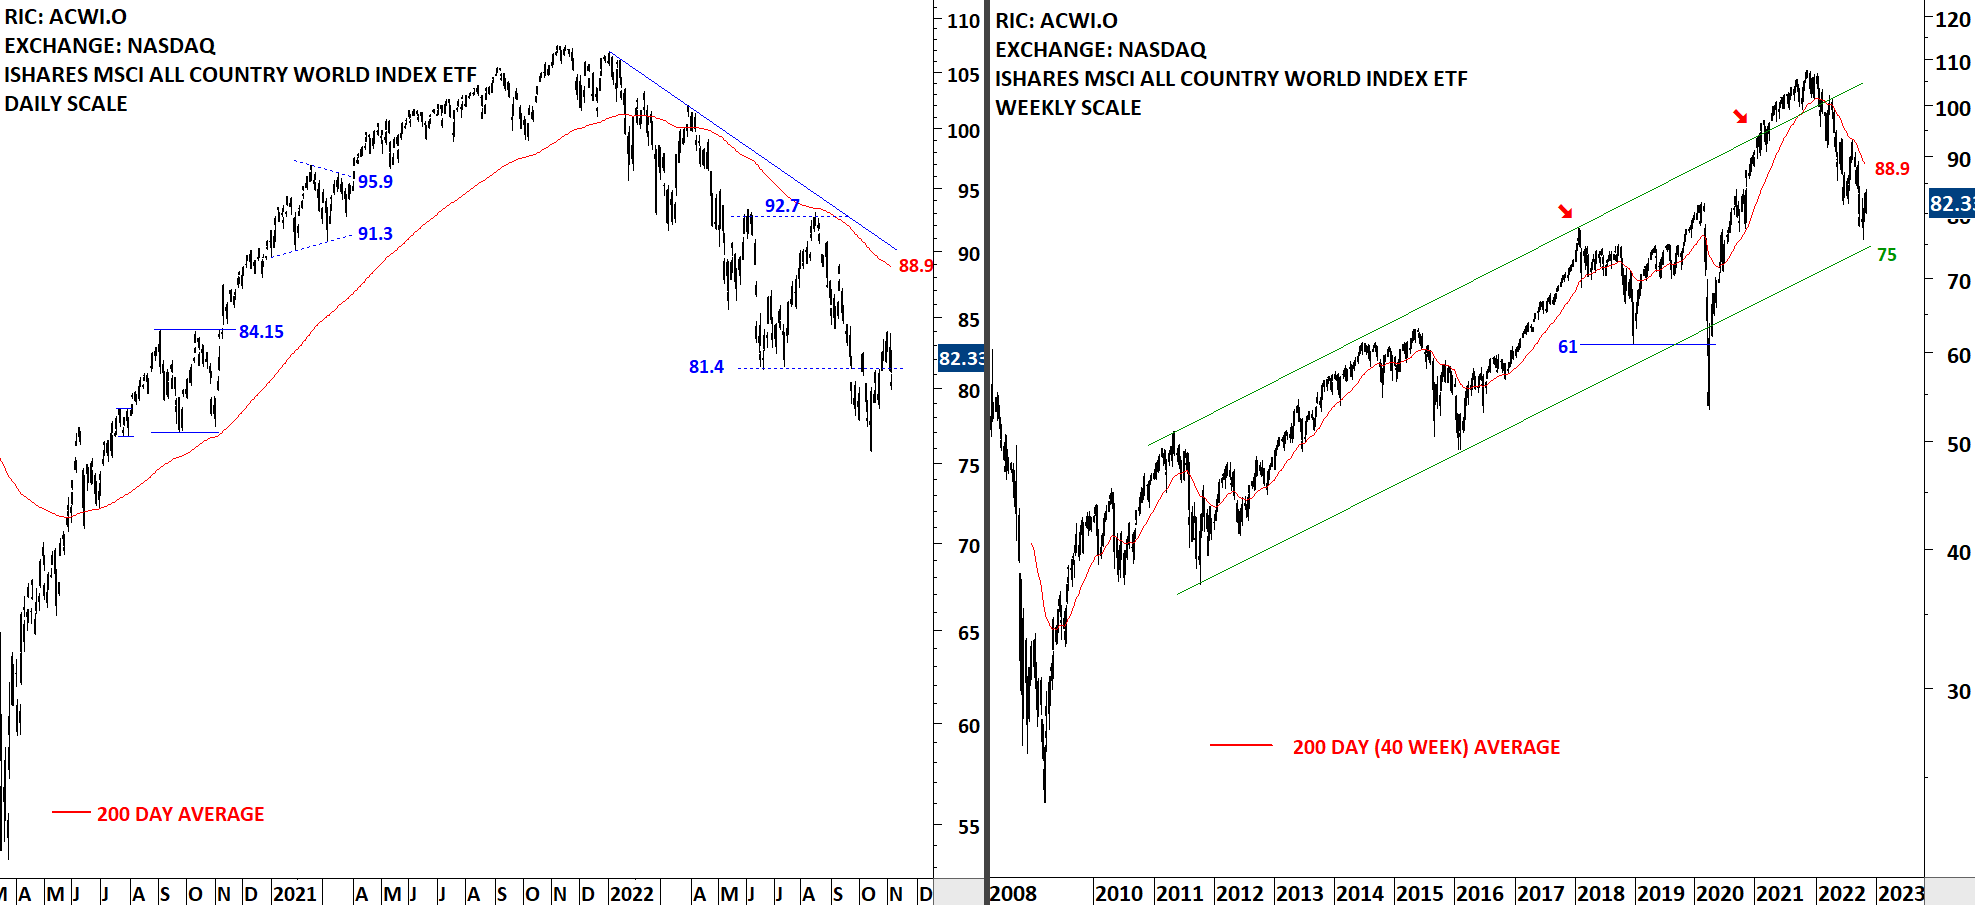
The benchmark for the Global equity markets performance, the iShares MSCI All Country World Index ETF (ACWI.O) is consolidating around its 200-day average at 88.4 levels. The ETF is looking for direction. On the daily scale price action is going through low volatility condition which is usually followed by directional movement. Next week will be important in understanding the short/medium-term trend direction. Failure to recover and stabilize above the 200-day average can result in a downtrend towards 81.4 levels. Another strong daily price action towards 90 levels can start a new uptrend above the long-term average.
 Read More