CHINESE YUAN

Still a highly managed currency Chinese yuan is trading above its 200 day moving average – with only one exception since 2005. China was criticized for currency manipulation during the financial crisis between 2008 and 2009. PBOC (The People’s Bank of China) was asked to strengthen the yuan and China to focus on internal demand rather than an export driven economy.

USDCNY

CHINA SSE 50 INDEX

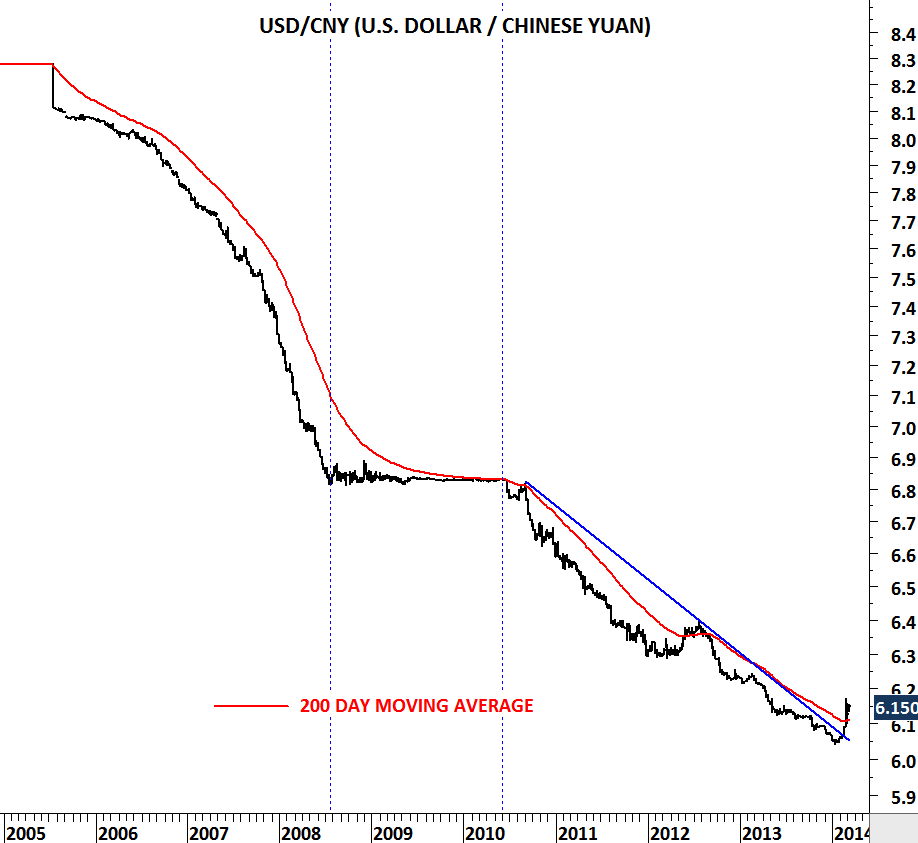
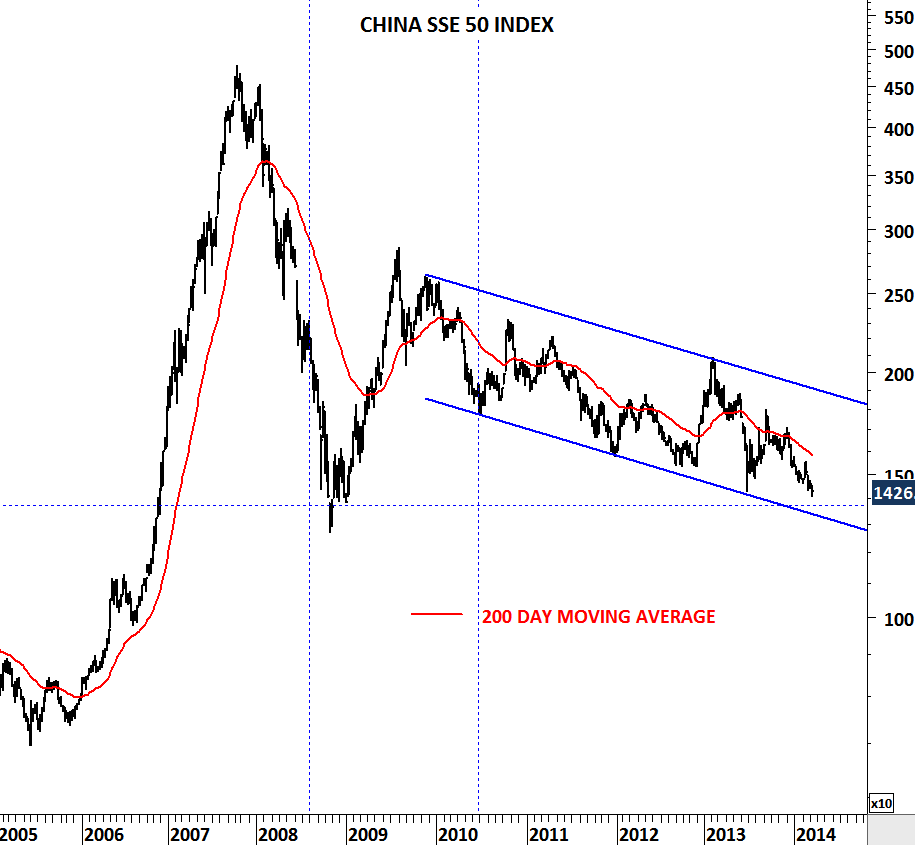
In the second half of 2010, USD/CNY started moving lower resulting in weak U.S. dollar against the Chinese yuan. Over the past 4 years China lagged the global recovery. China SSE 50 index is now testing 2009 low levels. However, since the beginning of 2014, USD/CNY started moving in the opposite direction of the major downtrend. Similar price action occurred in the second half of 2012 but it was short-lived. Cross rate failed to hold above the long-term average.

Technical outlook could be different now. 6.1 levels will be an important threshold in the following months. Given that SSE 50 index is now very close to a major support both Chinese equities and the currency should be watched closely. If USD/CNY holds above the 200-day moving average, this will signal a major shift in the long-term trend.

USD/TRY – case study of parabolic moves

Parabolic moves are common in the financial markets. They are widely participated (though not anticipated). During these type of moves volatility increases tremendously. Similar to a ball thrown in the air, once they run out of energy they fall back with the same speed. Below are four different chart examples with similar price actions. Frome a technical perspective all of them reached their upper boundary and reversed.

Steep price actions are not sustainable and they should be followed by sharp pull-backs. Both on the upside and the downside volatility remains high and daily price swings are sharp during these type of price actions.

USD/TRY (U.S. dollar/Turkish Lira) is experiencing a similar price action over the past few weeks.  We should accept high volatility and be prepared for pull-backs.

USDTRY II

GOLD

ROUGH RICE

USDKES

U.S. dollar vs. MXN, TRY, PHP, TWD…

My latest updates on twitter. I believe these charts are very valuable and suggest U.S. dollar strength against the currencies analyzed.

INDIA BSE SENSEX and USD/INR

INDIA BSE SENSEX INDEX

Strong price action should be followed by a decisive breakout on the BSE Sensex Index. Since 2007, Sensex tested 21,250 levels for three times and over the past few months price action suggests a breakout to all time highs is very likely. Confirmation of the breakout should come after a decisive weekly closing above the strong resistance at 21,250 levels. 200-day moving average should act as medium-term support at 20,000 levels if the index fails to clear the strong resistance. Breakout above 21,250 levels will push the index towards 25,000 levels in a short period of time.

USDINR

Indian rupee gained strength against the U.S. dollar and this trend is likely to continue towards 58-60 area. Strong equity market should bode well for the local currency.

US DOLLAR/INDONESIAN RUPIAH

 USDIDR

Indonesian rupiah had its share from the weakness in emerging market currencies. Over the past two years Rupiah weakened against the U.S. dollar similar to earlier price depreciation that took the cross rate from the lower boundary of its long-term consolidation to test the upper boundary. Fluctuations were between 8,300 and 12,400 levels. It is now the 4th time that the USD/IDR is testing its decade-long trend resistance. Price chart suggests Rupiah strength against the U.S. dollar, should the history repeats itself. Until we see a decisive breakout above 12,400 levels, we should expect reversion to the mean – a breath-taking period after the sharp depreciation in IDR.

USD/ZAR & USD/IDR

ZAR

IDR

Emerging market currencies are going through challenging times as they lose ground against the U.S. dollar. After two decades of massive depreciation against the U.S. dollar (1980-2000), most of the EM currencies stabilized and started moving sideways in a wide range. Latest sell-off pushed the cross rates to test their upper boundaries. South African Rand reached the upper boundary of its contracting range (possibly a symmetrical triangle) and Indonesian Rupiah the upper boundary of its flat consolidation range. The question now is whether the decade long consolidations will resume or will be followed by strong breakouts. These long-term charts should be on our watch-list in the following months.

USD/TRY

USDTRY

It is uncharted territory once again for the USD/TRY. For more than a decade USD/TRY (U.S. dollar/Turkish lira) consolidated between 1.75 and 1.15 levels. Cross rate managed to stabilize for more than a decade after the inflationary years of 1990s. It was mid-2011 when the USD/TRY breached the decade-long resistance at 1.75 levels. First the cross rate reached 1.92 levels and then pulled back to 1.75. Short/medium-term consolidation formed a bullish flag and in May we have discussed the possibility of a strong breakout. Breakout above 1.83 was followed by a sharp upward move. Emerging market currencies are weakening against the U.S. dollar. Turkish lira is one of them. Price, breaking to a new all time high increases the risk of further depreciation towards 2.0 levels. Medium-term stop-loss area becomes 1.75-1.83. With the medium-term stop-loss area in place, we can expect higher USD/TRY in the following weeks.

USD/ZAR

USDZAR

U.S. dollar continues to gain strength against major emerging market currencies. In this update I’m analyzing the USD/ZAR (South African Rand). USD has been strong against the Rand since mid-2011. We are now seeing the uptrend accelerating towards the long-term resistance at 10.70 levels. Earlier tops in 2001 and in 2008 was marked with an upward spike. 10.70 is the likely short-term target.

USD/INR & USD/TRY

Earlier in May I’ve updated two charts on the emerging market currencies USD/INR (Indian Rupee) and USD/TRY (Turkish Lira). Both suggested strong USD in the short/medium-term. We are seeing clear breakouts from consolidation ranges and weakness in major emerging market currencies.

USDINR III

USDTRY II

USD/TRY (U.S. DOLLAR/TURKISH LIRA)

USDTRY

U.S. dollar is gaining strength against most of the developed and emerging market currencies. I analyzed USD/TRY in the previous updates and drew attention to the bullish outlook on the dollar versus Turkish Lira. In mid-2011, cross rate broke above 1.75 levels and since then it has been consolidating between 1.75 and 1.90. Last year’s consolidation appears to be a flag formation; usually considered to be a bullish continuation pattern. As long as 1.75 holds as a medium-term support, breakout to higher levels will remain likely. Breakout above 1.83 levels could initiate another upward spike on the USD/TRY towards 1.92 levels.