GLOBAL EQUITY MARKETS – May 1, 2021

REVIEW


The benchmark for the Global equity markets performance, the iShares MSCI All Country World Index ETF (ACWI.O) is resuming its uptrend after completing the sideways consolidation, a symmetrical triangle. The upper boundary of a possible symmetrical triangle was breached at 95.9 levels. We can conclude that the uptrend is intact. Price objective stands at 102.7 levels. During any pullback 95.9 will act as support.

Read More

ISHARES MSCI EMERGING MARKETS ETF – EEM

Every week Tech Charts Global Equity Markets report features some of the well-defined, mature classical chart patterns under a lengthy watchlist and the chart pattern breakout signals that took place during that week. Global Equity Markets report covers single stocks from developed, emerging and frontier markets, ETF’s and global equity indices. The report starts with a review section that highlights the important chart developments on global equity benchmarks. This blog post features from the review section IShares MSCI Emerging Markets ETF (EEM) listed on the New York Stock Exchange.

ISHARES MSCI EMERGING MARKETS ETF (EEM)

The benchmark for the Emerging Markets performance, the iShares MSCI Emerging Markets Index ETF (EEM) rebounded strongly from support at 51.7. The uptrend is intact with the ETF trading above its 200-day average. Support at 51.7 held and EEM might be forming a medium-term low. I’m monitoring the possibility of a minor H&S bottom reversal with the neckline standing at 54.7 levels. Breakout above 54.7 levels can target 57.7.


Tech Charts Membership

By becoming a Premium Member, you’ll be able to improve your knowledge of the principles of classical charting.

With this knowledge, you can merge them with your investing system. In fact, some investors use my analyses to modify their existing style to invest more efficiently and successfully.

Get Access Now

As a Premium Member of Aksel Kibar’s Tech Charts,

You will receive:

  • Global Equities Report. Delivered weekly.
  • Classical charting principles. Learn patterns and setups.
  • Actionable information. Worldwide indices and stocks of interest.
  • Risk management advice. The important trading points of each chart.
  • Information on breakout opportunities. Identify the ones you want to take action on.
  • Video tutorials. How patterns form and why they succeed or fail.
  • Watch list alerts. As they become available so you can act quickly.
  • Breakout alerts. Usually once a week.
  • Access to everything (now and as it becomes available)
    o Reports
    o Videos and video series
  • Multi-part webinar course. You learn the 8 most common charting principles.
  • Webinars. Actionable and timely advice on breaking out chart patterns.

For your convenience your membership auto renews each year.

Get Access Now

ISHARES MSCI FRONTIER MARKETS ETF – FM

Every week Tech Charts Global Equity Markets report features some of the well-defined, mature classical chart patterns under a lengthy watchlist and the chart pattern breakout signals that took place during that week. Global Equity Markets report covers single stocks from developed, emerging and frontier markets, ETF’s and global equity indices. The report starts with a review section that highlights the important chart developments on global equity benchmarks. This blog post features from the review section IShares MSCI Frontier Markets ETF (FM) listed on the New York Stock Exchange.

ISHARES MSCI FRONTIER MARKETS ETF (FM)

Strength in Frontier market equities can be an indication of increasing risk appetite. When it is a risk on environment for equities, the spillover effect is usually from Developed to Emerging and Frontier market equities. Consistent uptrend in Frontier Market equities and the possibility of a fresh breakout can suggest continued positive trend for Global equity markets.

The benchmark for the Frontier equity markets performance, the iShares MSCI Frontier 100 ETF, is consolidating in a range between 28.77 and 30 levels. The well-defined consolidation range can act as a continuation chart pattern. Breakout above 30 levels can renew the strength for Frontier market equities. Several tests of pattern boundary can be followed by a reliable breakout. Possible chart pattern price target stands at 31.15 levels.

Top 10 holdings as of March 1st 2021

Country Allocation of the Frontier Markets ETF as of March 1st 2021

Industry Allocation of the Frontier Markets ETF as of March 1st 2021


Tech Charts Membership

By becoming a Premium Member, you’ll be able to improve your knowledge of the principles of classical charting.

With this knowledge, you can merge them with your investing system. In fact, some investors use my analyses to modify their existing style to invest more efficiently and successfully.

Get Access Now

As a Premium Member of Aksel Kibar’s Tech Charts,

You will receive:

  • Global Equities Report. Delivered weekly.
  • Classical charting principles. Learn patterns and setups.
  • Actionable information. Worldwide indices and stocks of interest.
  • Risk management advice. The important trading points of each chart.
  • Information on breakout opportunities. Identify the ones you want to take action on.
  • Video tutorials. How patterns form and why they succeed or fail.
  • Watch list alerts. As they become available so you can act quickly.
  • Breakout alerts. Usually once a week.
  • Access to everything (now and as it becomes available)
    o Reports
    o Videos and video series
  • Multi-part webinar course. You learn the 8 most common charting principles.
  • Webinars. Actionable and timely advice on breaking out chart patterns.

For your convenience your membership auto renews each year.

Get Access Now

2 BULLISH CHART PATTERNS – MMC

Every week Tech Charts Global Equity Markets report features some of the well-defined, mature classical chart patterns under a lengthy watchlist and the chart pattern breakout signals that took place during that week. Global Equity Markets report covers single stocks from developed, emerging and frontier markets, ETF’s and global equity indices. The report starts with a review section that highlights the important chart developments on global equity benchmarks. This blog post features from the watchlist section Marsh & McLennan Companies, Inc.

MARSH & MCLENNAN COMPANIES INC (MMC)

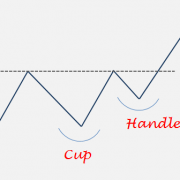
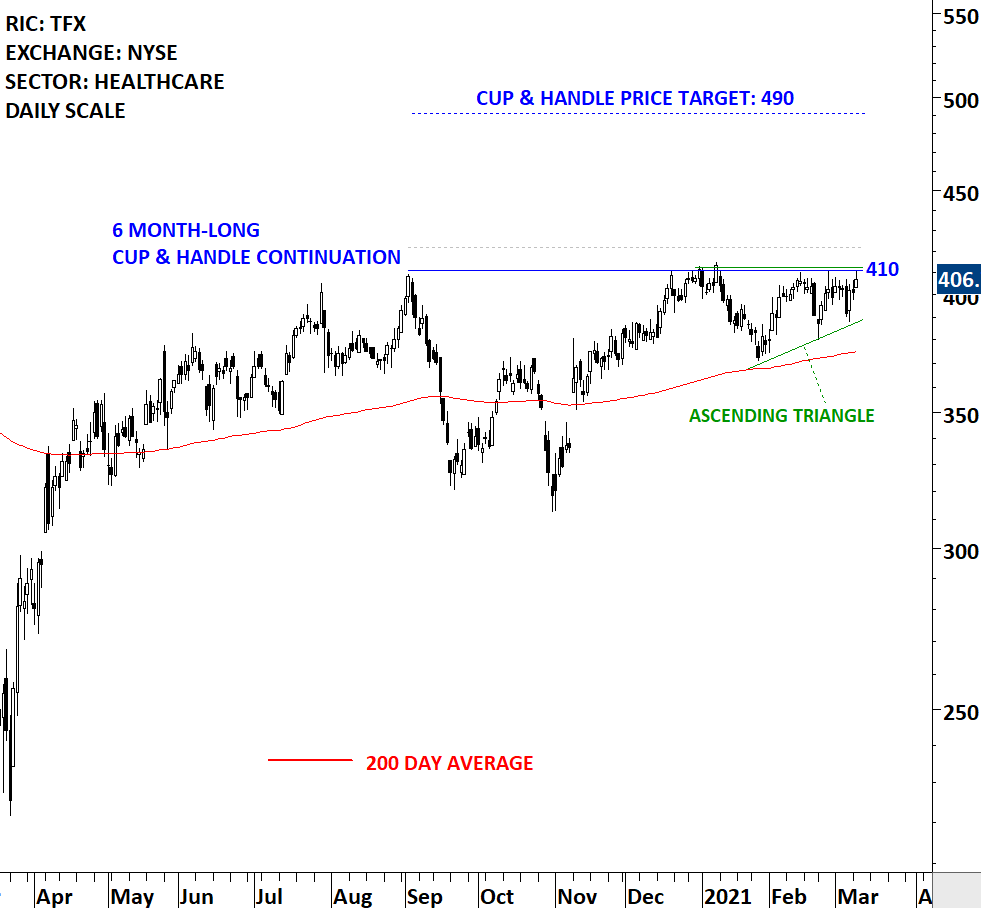
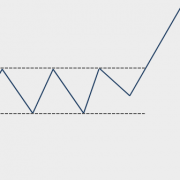
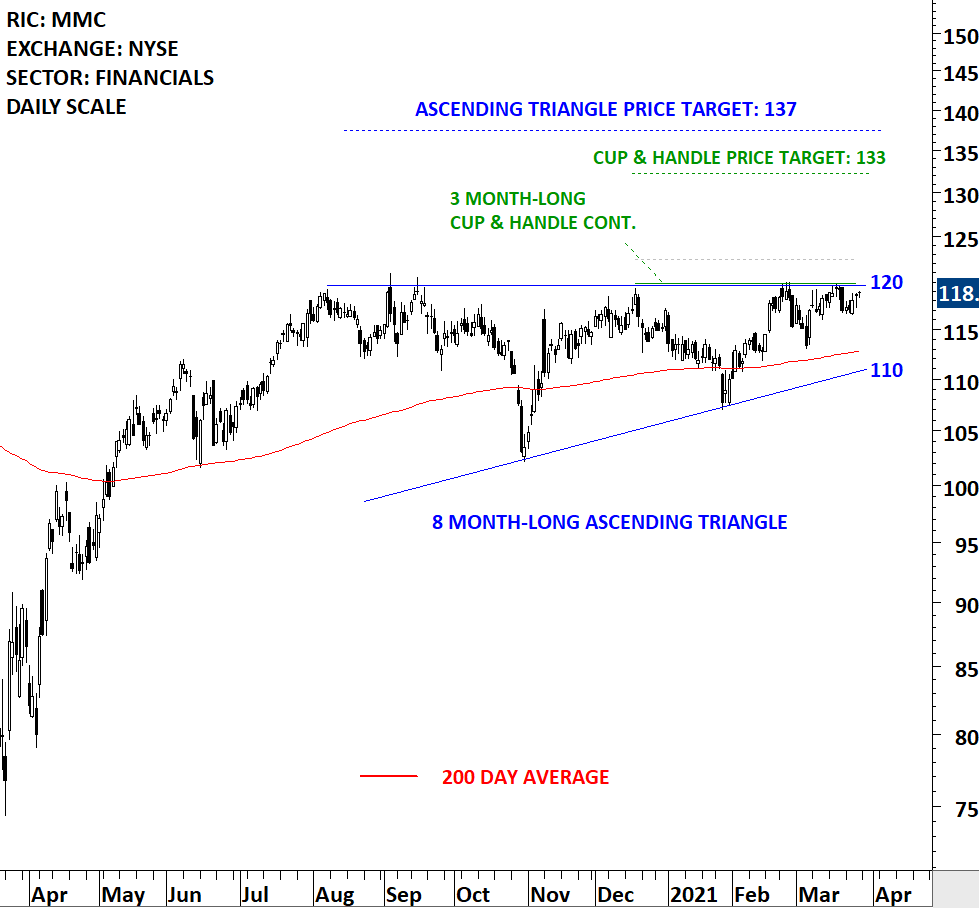
Marsh & McLennan Companies, Inc. is a professional services firm offering clients advice and solutions in risk, strategy and people. The Company is the parent company of various risk advisors and specialty consultants, including Marsh, the insurance broker; Guy Carpenter, the risk and reinsurance specialist; Mercer, the provider of human resource and investment related financial advice and services, and Oliver Wyman Group, the management and economic consultancy. The stock is listed on the New York Stock Exchange. Price chart formed a 3 month-long cup & handle continuation with the horizontal boundary acting as strong resistance at 120.00 levels. The horizontal boundary was tested several times over the course of the chart pattern. A daily close above 122.50 levels will confirm the breakout from the 3 month-long cup & handle continuation with the possible chart pattern price target of 133.00 levels. The cup & handle continuation is part of a larger scale ascending triangle that can complete at the same price level. (Data as of 26/03/2021, EST 9:30)


Tech Charts Membership

By becoming a Premium Member, you’ll be able to improve your knowledge of the principles of classical charting.

With this knowledge, you can merge them with your investing system. In fact, some investors use my analyses to modify their existing style to invest more efficiently and successfully.

Get Access Now

As a Premium Member of Aksel Kibar’s Tech Charts,

You will receive:

  • Global Equities Report. Delivered weekly.
  • Classical charting principles. Learn patterns and setups.
  • Actionable information. Worldwide indices and stocks of interest.
  • Risk management advice. The important trading points of each chart.
  • Information on breakout opportunities. Identify the ones you want to take action on.
  • Video tutorials. How patterns form and why they succeed or fail.
  • Watch list alerts. As they become available so you can act quickly.
  • Breakout alerts. Usually once a week.
  • Access to everything (now and as it becomes available)
    o Reports
    o Videos and video series
  • Multi-part webinar course. You learn the 8 most common charting principles.
  • Webinars. Actionable and timely advice on breaking out chart patterns.

For your convenience your membership auto renews each year.

Get Access Now

CUP WITH HANDLE (BULLISH CONTINUATION)

Every week Tech Charts Global Equity Markets report features some of the well-defined, mature classical chart patterns under a lengthy watchlist and the chart pattern breakout signals that took place during that week. Global Equity Markets report covers single stocks from developed, emerging and frontier markets, ETF’s and global equity indices. The report starts with a review section that highlights the important chart developments on global equity benchmarks. This blog post features from the watchlist section Teleflex Incorporated.

TELEFLEX INC (TFX) – new addition to watchlist

Teleflex Incorporated is a provider of medical technology products. The Company designs, develops, manufactures and supplies single-use medical devices used by hospitals and healthcare providers for diagnostic and therapeutic procedures in critical care and surgical applications. The stock is listed on the New York Stock Exchange. Price chart formed a 6 month-long cup & handle continuation with the horizontal boundary acting as strong resistance at 410.00 levels. The horizontal boundary was tested several times over the course of the chart pattern. A daily close above 422.00 levels will confirm the breakout from the 6 month-long cup & handle continuation with the possible chart pattern price target of 490.00 levels. The handle part of the cup & handle continuation can be identified as a possible ascending triangle that can act as a bullish continuation chart pattern. Breakout can push the stock to all-time highs. (Data as of Mar 9, 2021)


Tech Charts Membership

By becoming a Premium Member, you’ll be able to improve your knowledge of the principles of classical charting.

With this knowledge, you can merge them with your investing system. In fact, some investors use my analyses to modify their existing style to invest more efficiently and successfully.

Get Access Now

As a Premium Member of Aksel Kibar’s Tech Charts,

You will receive:

  • Global Equities Report. Delivered weekly.
  • Classical charting principles. Learn patterns and setups.
  • Actionable information. Worldwide indices and stocks of interest.
  • Risk management advice. The important trading points of each chart.
  • Information on breakout opportunities. Identify the ones you want to take action on.
  • Video tutorials. How patterns form and why they succeed or fail.
  • Watch list alerts. As they become available so you can act quickly.
  • Breakout alerts. Usually once a week.
  • Access to everything (now and as it becomes available)
    o Reports
    o Videos and video series
  • Multi-part webinar course. You learn the 8 most common charting principles.
  • Webinars. Actionable and timely advice on breaking out chart patterns.

For your convenience your membership auto renews each year.

Get Access Now

RECTANGLE (BULLISH CONTINUATION)

Every week Tech Charts Global Equity Markets report features some of the well-defined, mature classical chart patterns under a lengthy watchlist and the chart pattern breakout signals that took place during that week. Global Equity Markets report covers single stocks from developed, emerging and frontier markets, ETF’s and global equity indices. The report starts with a review section that highlights the important chart developments on global equity benchmarks. This blog post features from the watchlist section Leggett & Platt, Incorporated.

LEGGETT & PLATT INC (LEG.N)

Leggett & Platt, Incorporated is a manufacturer that conceives, designs and produces a range of engineered components and products found in homes, offices and automobiles. The stock is listed on the New York Stock Exchange. Price chart formed a 5 month-long rectangle with the horizontal boundary acting as strong resistance at 45.40 levels. The horizontal boundary was tested several times over the course of the chart pattern. A daily close above 46.70 levels will confirm the breakout from the 5 month-long rectangle with the possible chart pattern price target of 51.00 levels. (Data as of Mar 2, 2021)


Tech Charts Membership

By becoming a Premium Member, you’ll be able to improve your knowledge of the principles of classical charting.

With this knowledge, you can merge them with your investing system. In fact, some investors use my analyses to modify their existing style to invest more efficiently and successfully.

Get Access Now

As a Premium Member of Aksel Kibar’s Tech Charts,

You will receive:

  • Global Equities Report. Delivered weekly.
  • Classical charting principles. Learn patterns and setups.
  • Actionable information. Worldwide indices and stocks of interest.
  • Risk management advice. The important trading points of each chart.
  • Information on breakout opportunities. Identify the ones you want to take action on.
  • Video tutorials. How patterns form and why they succeed or fail.
  • Watch list alerts. As they become available so you can act quickly.
  • Breakout alerts. Usually once a week.
  • Access to everything (now and as it becomes available)
    o Reports
    o Videos and video series
  • Multi-part webinar course. You learn the 8 most common charting principles.
  • Webinars. Actionable and timely advice on breaking out chart patterns.

For your convenience your membership auto renews each year.

Get Access Now

H&S TOP OR A FAILURE?

Every week Tech Charts Global Equity Markets report features some of the well-defined, mature classical chart patterns under a lengthy watchlist and the chart pattern breakout signals that took place during that week. Global Equity Markets report covers single stocks from developed, emerging and frontier markets, ETF’s and global equity indices. The report starts with a review section that highlights the important chart developments on global equity benchmarks. This blog post features from the watchlist section Trillium Therapeutics Inc.

TRILLIUM THERAPEUTICS INC (TRIL.O)

Trillium Therapeutics Inc is a Canada-based clinical stage immuno-oncology company developing therapies for the treatment of cancer. The stock is listed on the Nasdaq Stock Exchange. Price chart formed a 5 month-long head and shoulder top with the horizontal boundary (neckline) acting as strong support at 11.75 levels. The horizontal boundary was tested several times over the course of the chart pattern. A daily close below 11.40 levels will confirm the breakdown from the 5 month-long head and shoulder top with the possible chart pattern price target of 7.16 levels. I’m also monitoring this chart pattern for a possible H&S failure. A breach above the right shoulder is required for the pattern negation and acting on this from the long side. 15.9 is the chart pattern negation level. (Learn more: Video Tutorial) (Data as of Feb 24, 2021)


Short educational video on H&S top failure


Tech Charts Membership

By becoming a Premium Member, you’ll be able to improve your knowledge of the principles of classical charting.

With this knowledge, you can merge them with your investing system. In fact, some investors use my analyses to modify their existing style to invest more efficiently and successfully.

Get Access Now

As a Premium Member of Aksel Kibar’s Tech Charts,

You will receive:

  • Global Equities Report. Delivered weekly.
  • Classical charting principles. Learn patterns and setups.
  • Actionable information. Worldwide indices and stocks of interest.
  • Risk management advice. The important trading points of each chart.
  • Information on breakout opportunities. Identify the ones you want to take action on.
  • Video tutorials. How patterns form and why they succeed or fail.
  • Watch list alerts. As they become available so you can act quickly.
  • Breakout alerts. Usually once a week.
  • Access to everything (now and as it becomes available)
    o Reports
    o Videos and video series
  • Multi-part webinar course. You learn the 8 most common charting principles.
  • Webinars. Actionable and timely advice on breaking out chart patterns.

For your convenience your membership auto renews each year.

Get Access Now

U.S. 10 YEAR T-NOTE & TNX

Every week Tech Charts Global Equity Markets report features some of the well-defined, mature classical chart patterns under a lengthy watchlist and the chart pattern breakout signals that took place during that week. Global Equity Markets report covers single stocks from developed, emerging and frontier markets, ETF’s and global equity indices. The report starts with a review section that highlights the important chart developments on global equity benchmarks. This blog post features from the review section U.S. 10 Year Government Bonds and the U.S. 10 Year Yield Index (TNX).

U.S. 10 YEAR T-NOTE

The U.S. 10 Year T-Note broke down the support at 137.2 levels. Last 8 month’s price action can be identified as a possible rectangle. Breakdown not only breached the horizontal support but also the 200-day average. Given the extreme low volatility conditions, I expect a strong directional move very soon. Possible chart pattern price target (rectangle reversal) stands at 134.25 levels. The 200-day average and the horizontal boundary at 137.2 levels is acting as resistance. (Data as of Feb 16, 2021)

U.S. 10 YEAR TREASURY YIELD INDEX (TNX)

The chart below is the 10 Year U.S. Treasury Yiled Index. The index after forming a short-term ascending triangle, broke out of both a long-term base and the bullish ascending triangle. Breakout took place at 9.8 levels which acted as the support level. If yields completed a multi-month long rectangle reversal, chart pattern price target will be 14. A minor resistance stands at 12.7 levels. Uptrend is intact. (Data as of Feb 16, 2021)


Tech Charts Membership

By becoming a Premium Member, you’ll be able to improve your knowledge of the principles of classical charting.

With this knowledge, you can merge them with your investing system. In fact, some investors use my analyses to modify their existing style to invest more efficiently and successfully.

Get Access Now

As a Premium Member of Aksel Kibar’s Tech Charts,

You will receive:

  • Global Equities Report. Delivered weekly.
  • Classical charting principles. Learn patterns and setups.
  • Actionable information. Worldwide indices and stocks of interest.
  • Risk management advice. The important trading points of each chart.
  • Information on breakout opportunities. Identify the ones you want to take action on.
  • Video tutorials. How patterns form and why they succeed or fail.
  • Watch list alerts. As they become available so you can act quickly.
  • Breakout alerts. Usually once a week.
  • Access to everything (now and as it becomes available)
    o Reports
    o Videos and video series
  • Multi-part webinar course. You learn the 8 most common charting principles.
  • Webinars. Actionable and timely advice on breaking out chart patterns.

For your convenience your membership auto renews each year.

Get Access Now

ASCENDING TRIANGLE – NVIDIA CORP (NVDA.O)

Every week Tech Charts Global Equity Markets report features some of the well-defined, mature classical chart patterns under a lengthy watchlist and the chart pattern breakout signals that took place during that week. Global Equity Markets report covers single stocks from developed, emerging and frontier markets, ETF’s and global equity indices. The report starts with a review section that highlights the important chart developments on global equity benchmarks. This blog post features from the watchlist section Nvidia Corporation on the Nasdaq Stock Exchange.

NVIDIA CORP (NVDA.O)

Nvidia Corporation focuses on personal computer (PC) graphics, graphics processing unit (GPU) and also on artificial intelligence (AI). The stock is listed on the Nasdaq Stock Exchange. Price chart formed a 4 month-long ascending triangle with the horizontal boundary acting as strong resistance at 582 levels. The horizontal boundary was tested several times over the course of the chart pattern. A daily close above 600 levels will confirm the breakout from the 4 month-long ascending triangle with the possible chart pattern price target of 695 levels. (Data as of Feb 8, 2021)


Tech Charts Membership

By becoming a Premium Member, you’ll be able to improve your knowledge of the principles of classical charting.

With this knowledge, you can merge them with your investing system. In fact, some investors use my analyses to modify their existing style to invest more efficiently and successfully.

Get Access Now

As a Premium Member of Aksel Kibar’s Tech Charts,

You will receive:

  • Global Equities Report. Delivered weekly.
  • Classical charting principles. Learn patterns and setups.
  • Actionable information. Worldwide indices and stocks of interest.
  • Risk management advice. The important trading points of each chart.
  • Information on breakout opportunities. Identify the ones you want to take action on.
  • Video tutorials. How patterns form and why they succeed or fail.
  • Watch list alerts. As they become available so you can act quickly.
  • Breakout alerts. Usually once a week.
  • Access to everything (now and as it becomes available)
    o Reports
    o Videos and video series
  • Multi-part webinar course. You learn the 8 most common charting principles.
  • Webinars. Actionable and timely advice on breaking out chart patterns.

For your convenience your membership auto renews each year.

Get Access Now

SYMMETRICAL TRIANGLE – AMAZON.COM INC

Every week Tech Charts Global Equity Markets report features some of the well-defined, mature classical chart patterns under a lengthy watchlist and the chart pattern breakout signals that took place during that week. Global Equity Markets report covers single stocks from developed, emerging and frontier markets, ETF’s and global equity indices. The report starts with a review section that highlights the important chart developments on global equity benchmarks. This blog post features from the watchlist section Amazon.com, Inc. on the Nasdaq Stock Exchange.

AMAZON.COM INC (AMZN.OQ) – new addition to watchlist

Amazon.com, Inc. offers a range of products and services through its Websites. The Company’s products include merchandise and content that it purchases for resale from vendors and those offered by third-party sellers. It also manufactures and sells electronic devices. The stock is listed on the Nasdaq Stock Exchange. Price chart formed a 5 month-long symmetrical triangle with the upper boundary acting as strong resistance at 3,350.00 levels. The upper boundary was tested several times over the course of the chart pattern. A daily close above 3,450.00 levels will confirm the breakout from the 5 month-long symmetrical triangle with the possible chart pattern price target of 4,000.00 levels. (Data as of Feb 1, 2021)

A SHORT VIDEO ON SYMMETRICAL TRIANGLES


Tech Charts Membership

By becoming a Premium Member, you’ll be able to improve your knowledge of the principles of classical charting.

With this knowledge, you can merge them with your investing system. In fact, some investors use my analyses to modify their existing style to invest more efficiently and successfully.

Get Access Now

As a Premium Member of Aksel Kibar’s Tech Charts,

You will receive:

  • Global Equities Report. Delivered weekly.
  • Classical charting principles. Learn patterns and setups.
  • Actionable information. Worldwide indices and stocks of interest.
  • Risk management advice. The important trading points of each chart.
  • Information on breakout opportunities. Identify the ones you want to take action on.
  • Video tutorials. How patterns form and why they succeed or fail.
  • Watch list alerts. As they become available so you can act quickly.
  • Breakout alerts. Usually once a week.
  • Access to everything (now and as it becomes available)
    o Reports
    o Videos and video series
  • Multi-part webinar course. You learn the 8 most common charting principles.
  • Webinars. Actionable and timely advice on breaking out chart patterns.

For your convenience your membership auto renews each year.

Get Access Now