GLOBAL EQUITY MARKETS – May 1, 2021
REVIEW
The benchmark for the Global equity markets performance, the iShares MSCI All Country World Index ETF (ACWI.O) is resuming its uptrend after completing the sideways consolidation, a symmetrical triangle. The upper boundary of a possible symmetrical triangle was breached at 95.9 levels. We can conclude that the uptrend is intact. Price objective stands at 102.7 levels. During any pullback 95.9 will act as support.
Note: We have received many requests for the possibility to have the report in PDF format. Going forward I will attach a PDF version of the report for our members who would like to read on paper and also offline. Due to large size (given that I like to keep charts in large format) this is the best layout I could put the report. I hope this will be useful.

GLOBAL EQUITY MARKETS – MAY 1, 2021 – PART I
GLOBAL EQUITY MARKETS – MAY 1, 2021 – PART II
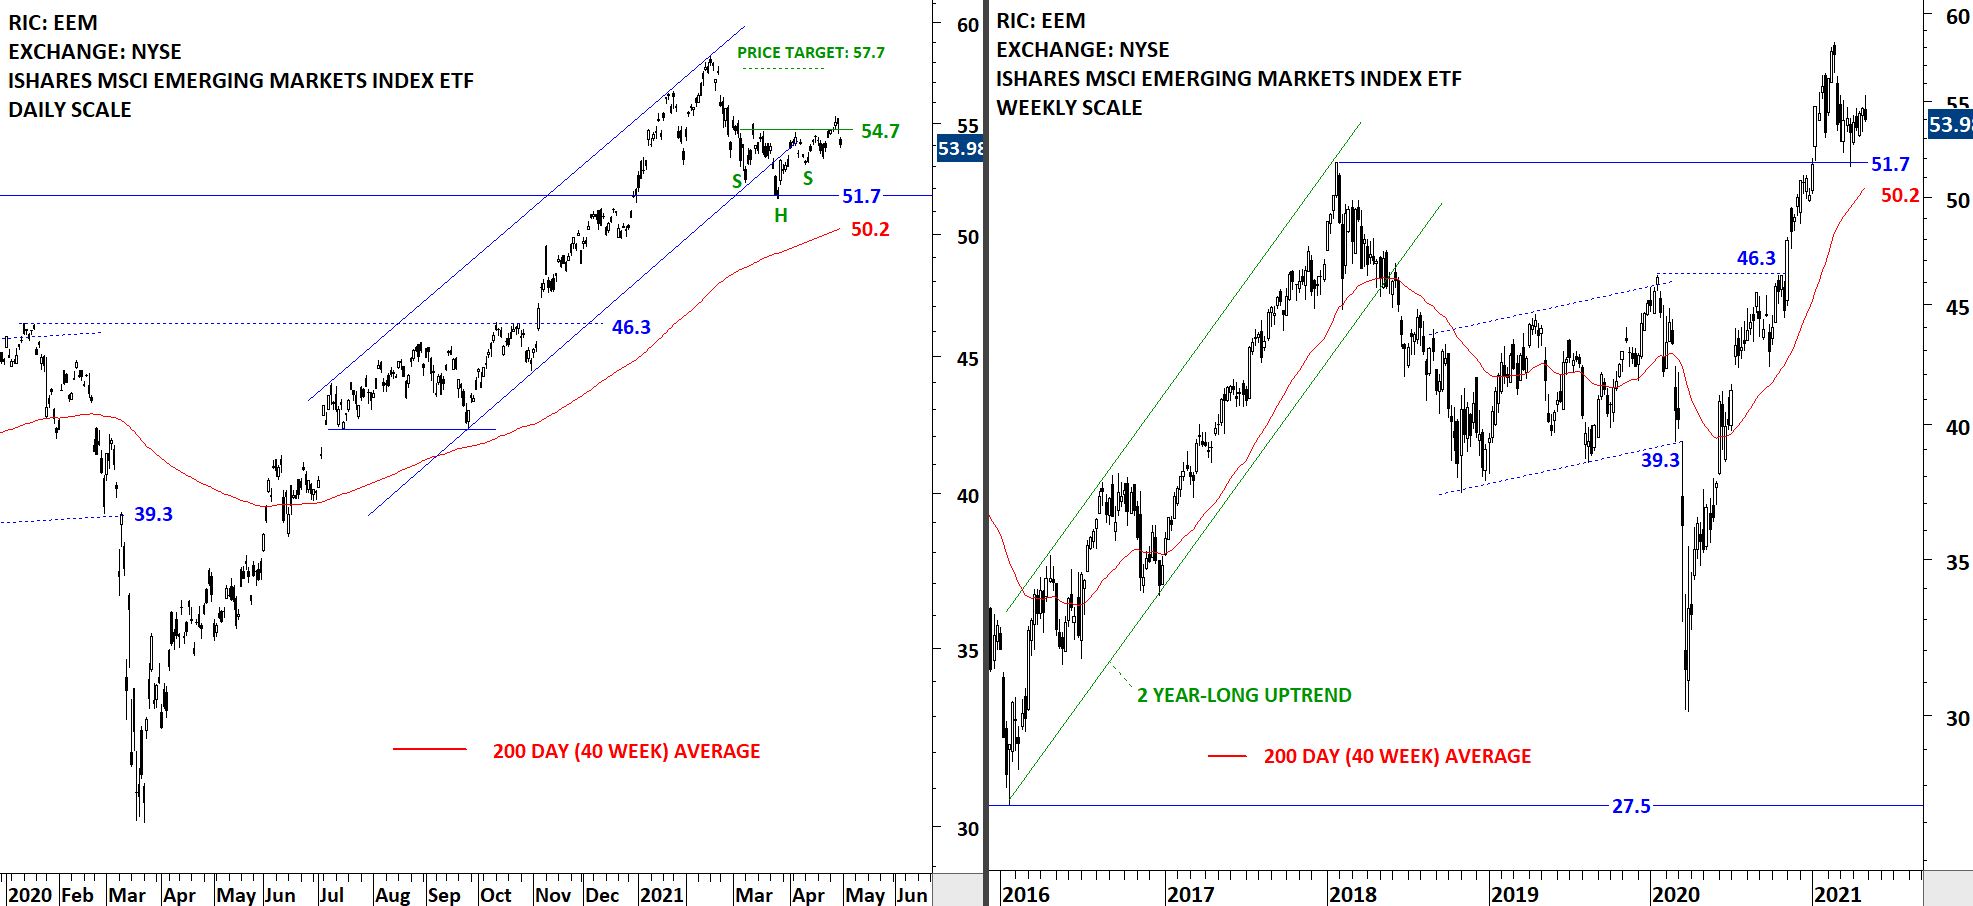
The benchmark for the Emerging Markets performance, the iShares MSCI Emerging Markets Index ETF (EEM) rebounded strongly from support at 51.7. The uptrend is intact with the ETF trading above its 200-day average. Support at 51.7 held and EEM might be forming a medium-term low. I’m monitoring the possibility of a minor H&S bottom reversal with the neckline standing at 54.7 levels. Breakout above 54.7 levels can target 57.7. This week’s price action was hesitant to clear the neckline. I’m thinking this was due to stronger U.S. Dollar by the end of the week. Chart pattern is not negated and the bullish outlook remains intact.
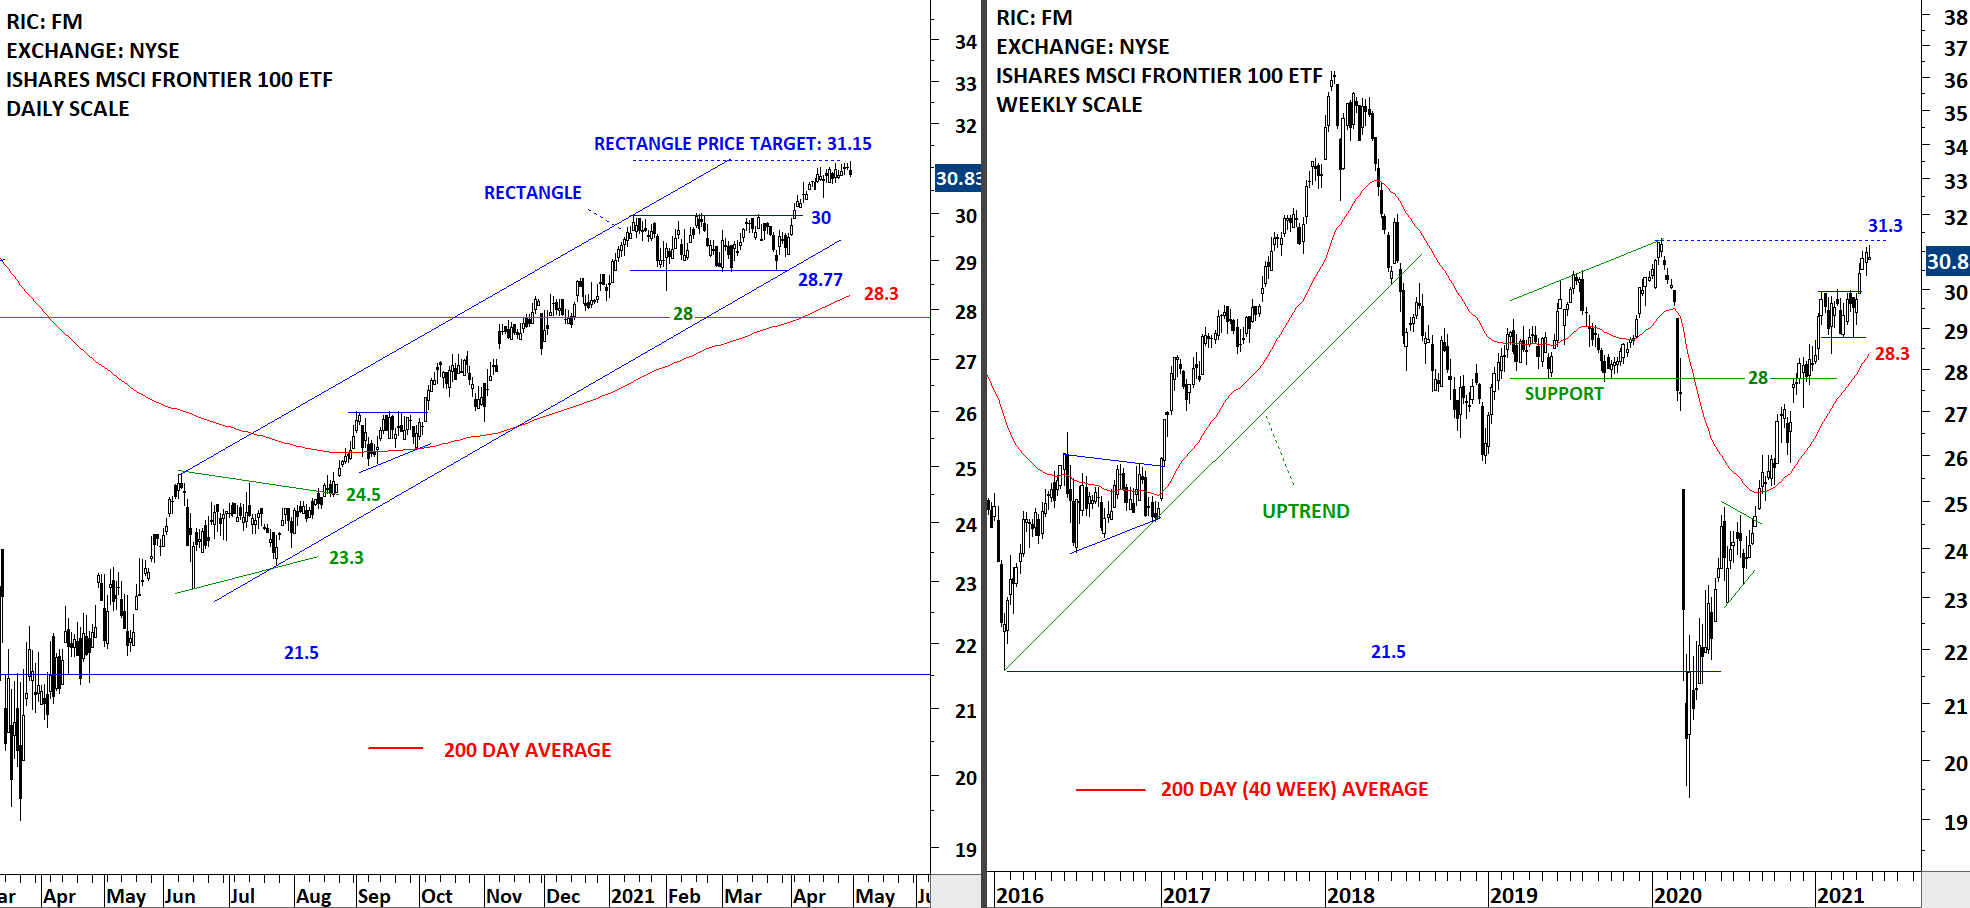
The benchmark for the Frontier equity markets performance, the iShares MSCI Frontier 100 ETF, completed its consolidation from a range between 28.77 and 30 levels. The well-defined consolidation acted as a continuation chart pattern. Breakout above 30 levels renewed the strength for Frontier market equities. This week’s price action reached the price target at 31.15 levels. The high of 2020 at 31.3 can act as short-term resistance (shown on the weekly scale price chart).
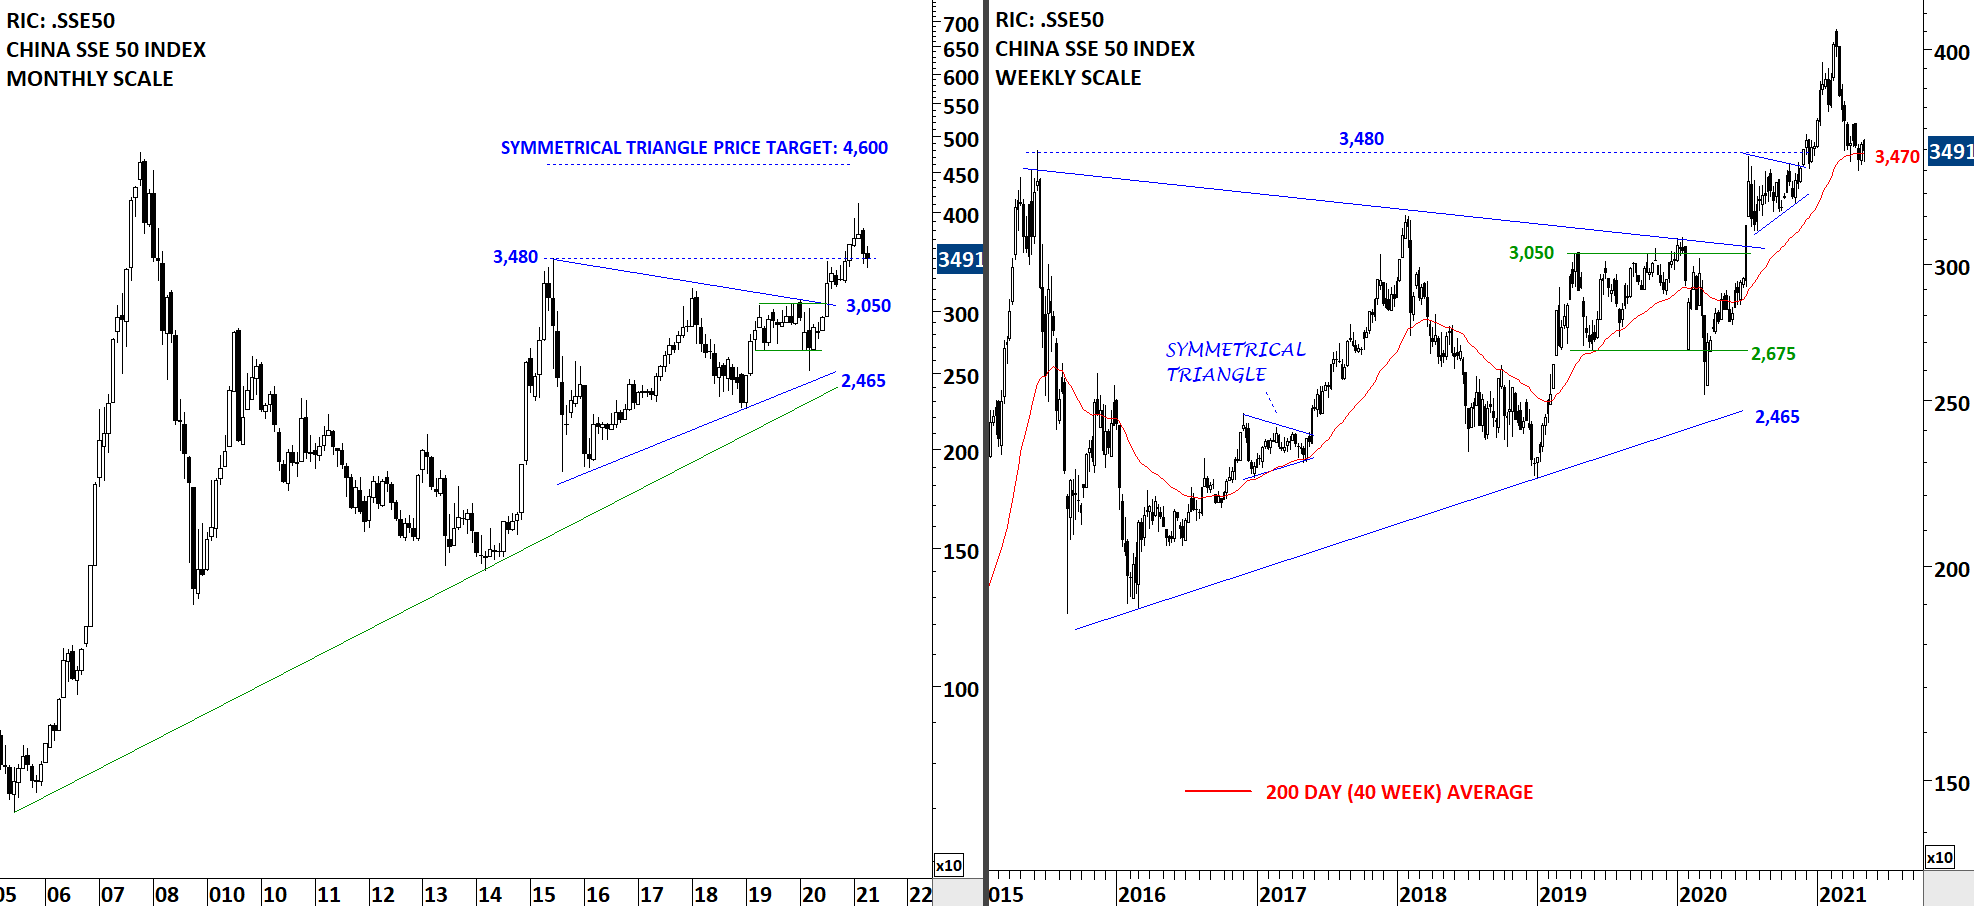
China SSE 50 Index experienced its first sharp setback after its breakout from the long-term symmetrical triangle at 3,050 levels. Current setback is possibly a pullback to the previous resistance (new support) between 3,470 and 3,480 levels. The high of the symmetrical triangle and the 200-day moving average are forming support between 3,470 and 3,480 levels. The long-term uptrend remains intact. China SSE 50 Index might be due for a strong rebound from support area. Failure to hold above the inflection point formed by the 200-day and the minor high can result in larger scale correction. I’m following the possible rebound on SSE50 with the H&S bottom reversal development on EEM (discussed above).
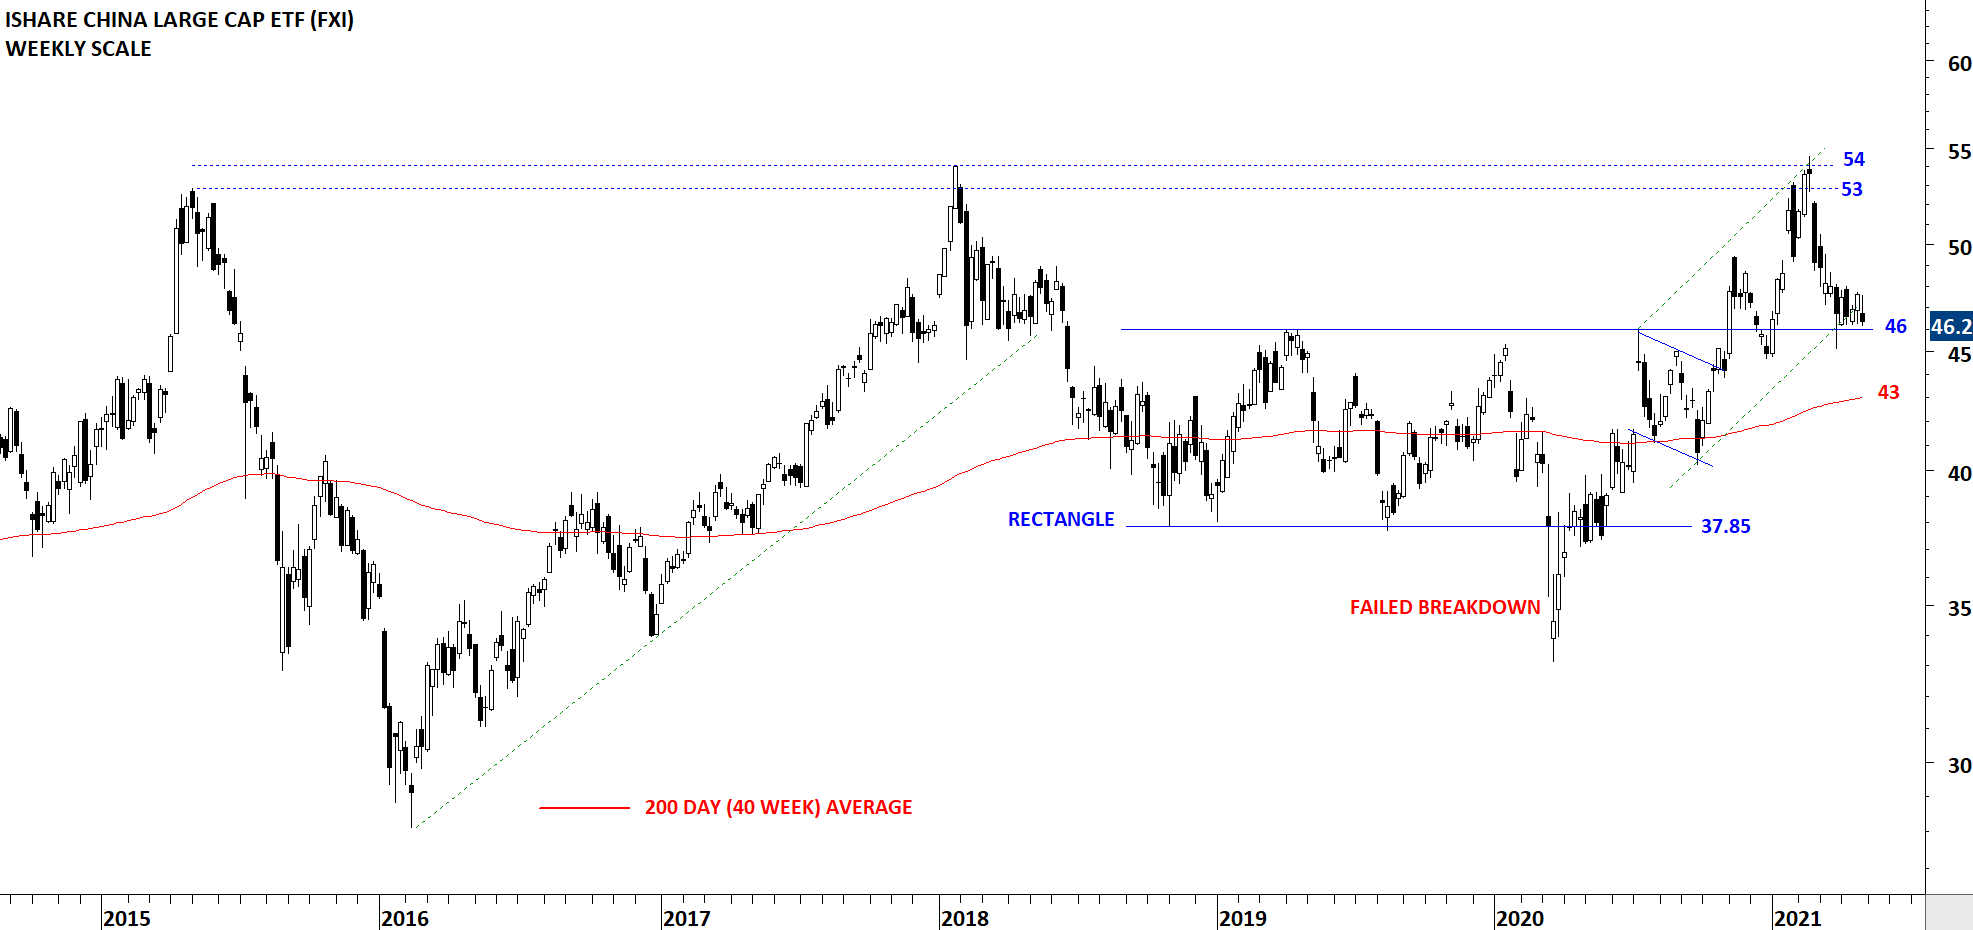
FXI, the Ishares China Large CAP ETF listed on the NYSE found support at 46 levels. The 53-54 area was an important hurdle for the ETF. Earlier tests resulted in a sharp reversal. The ETF is in a trading range between 46 and 53 levels. FXI might be due for a rebound in the second quarter. I will monitor 46 levels as an important support in the coming weeks.
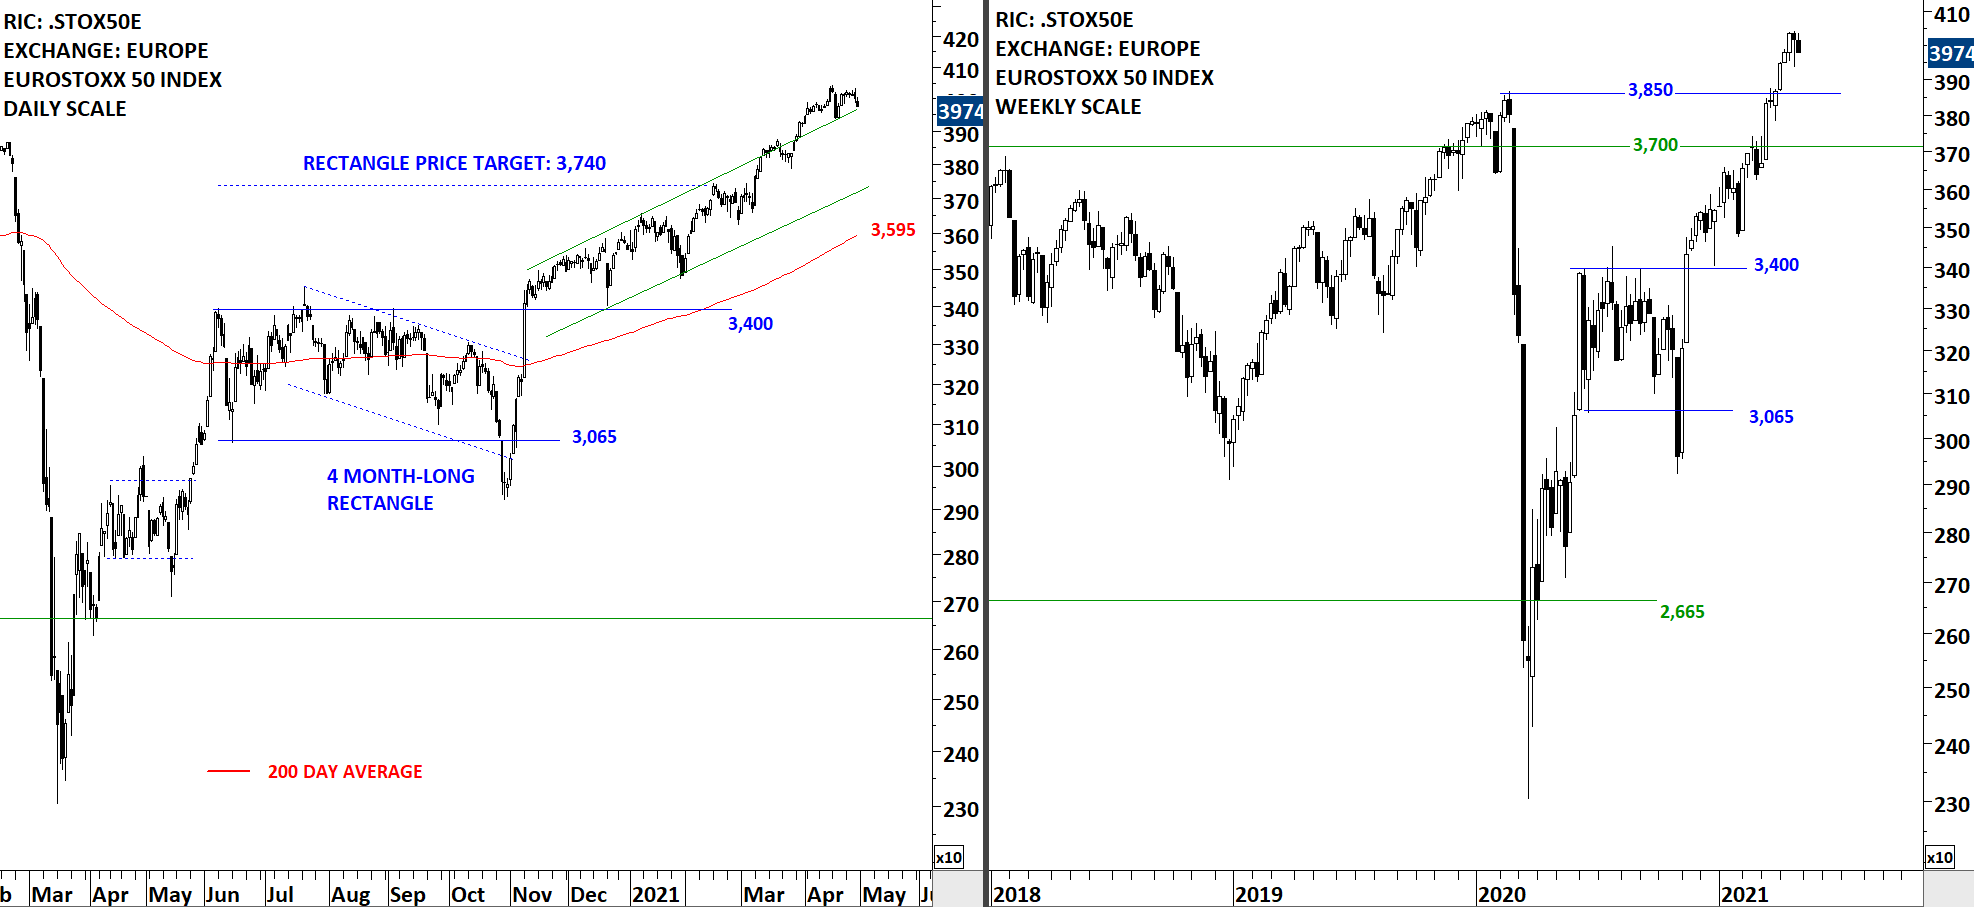
EuroStoxx 50 Index had a strong rally. The uptrend is intact. Strong support area remains between 3,700 and 3,850 (weekly scale price chart). Breakout above 3,850 is positive for European equities. On the daily scale price chart I will monitor the upper boundary of the trend channel as a short-term support.
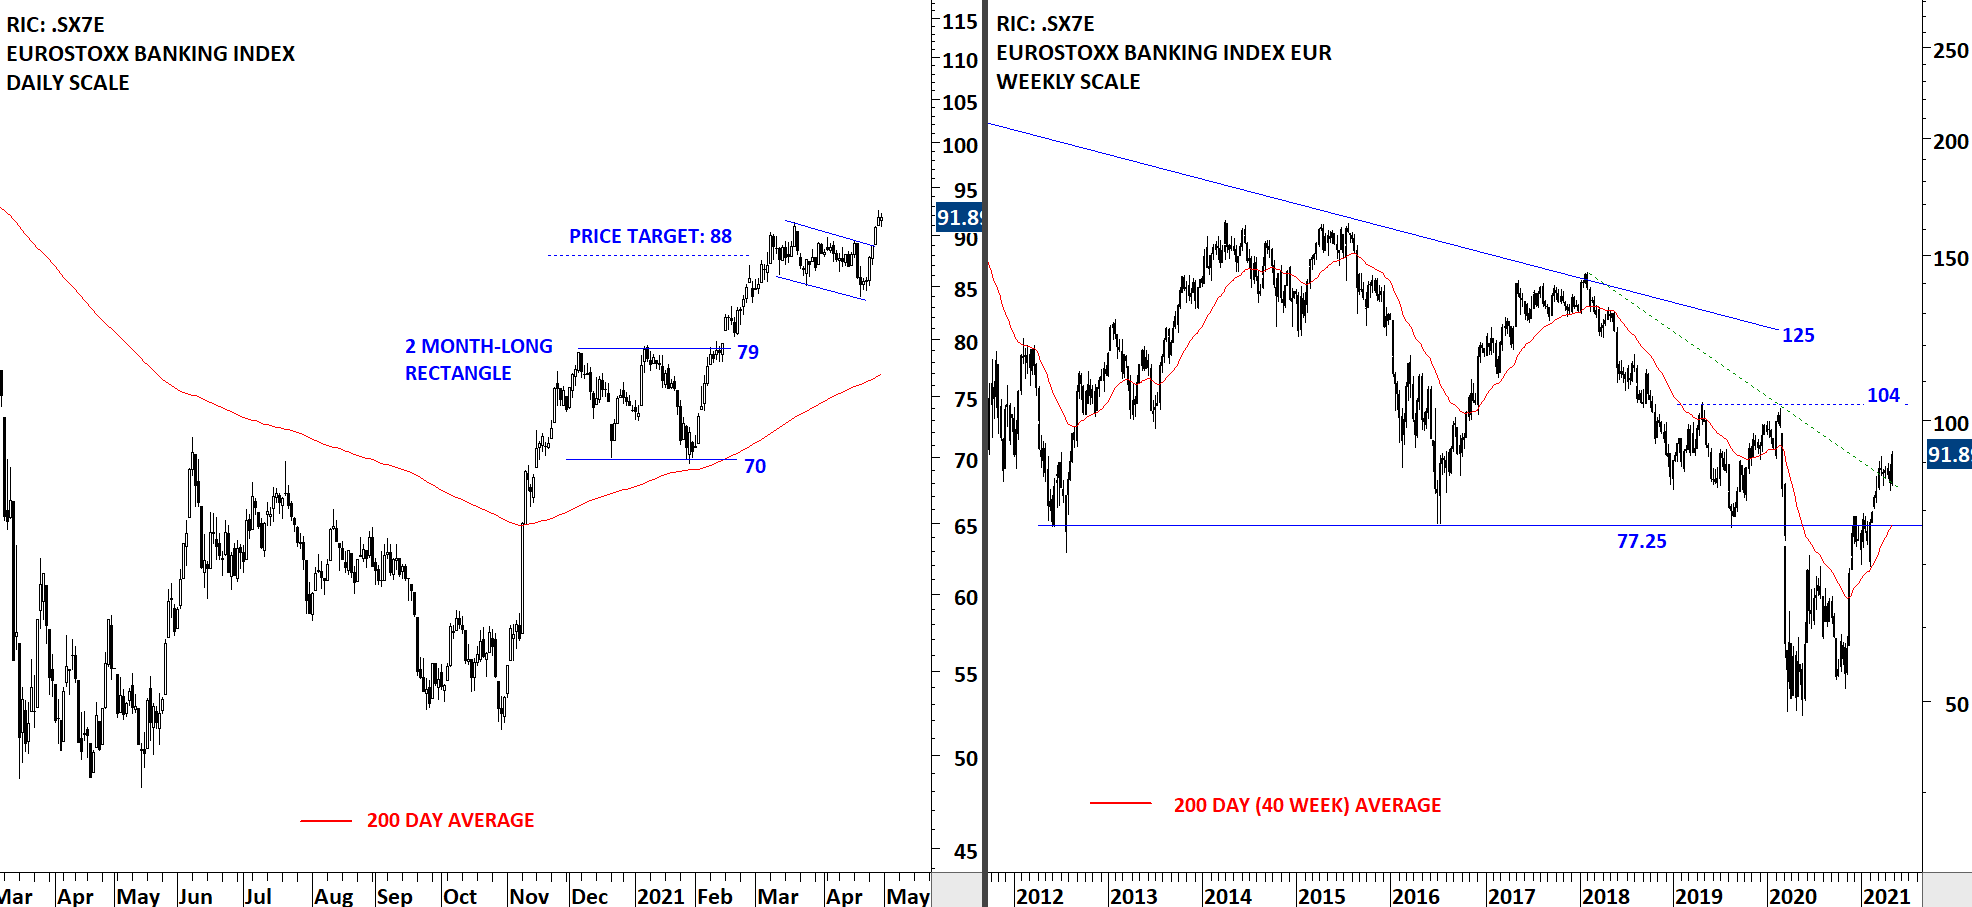
European banks are showing strength. Euro Stoxx Banking index reached its price target for the short-term rectangle at 88 levels. Last one month’s price action can be analyzed as a short-term consolidation. Breakout from the short-term consolidation has taken place with the last two days of trading. During any pullback 77.25-79 area will act as support. Recent uptrend can test the resistance at 104 levels.
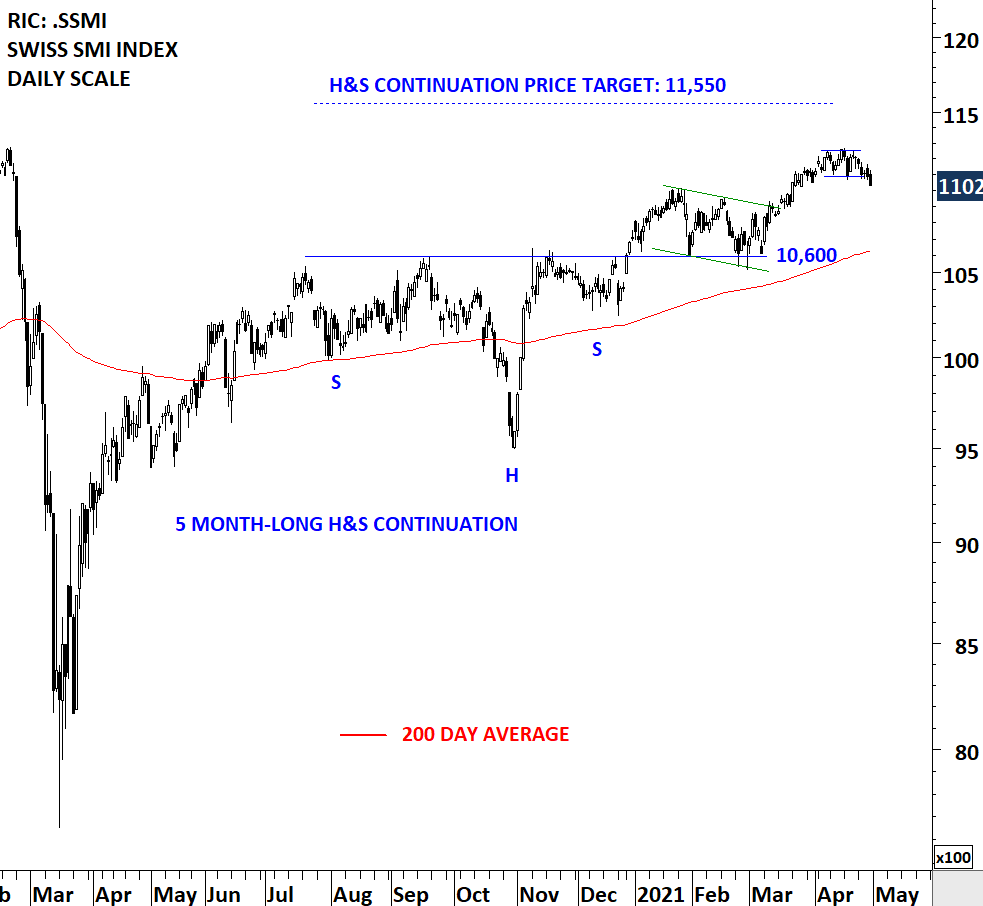
Swiss SMI Index is trending towards its possible chart pattern price target after completing a 5 month-long H&S continuation chart pattern. The index held above the neckline at 10,600 levels. Previous resistance at 10,600 became the new support. Uptrend is intact. Price target stands at 11,550 levels.
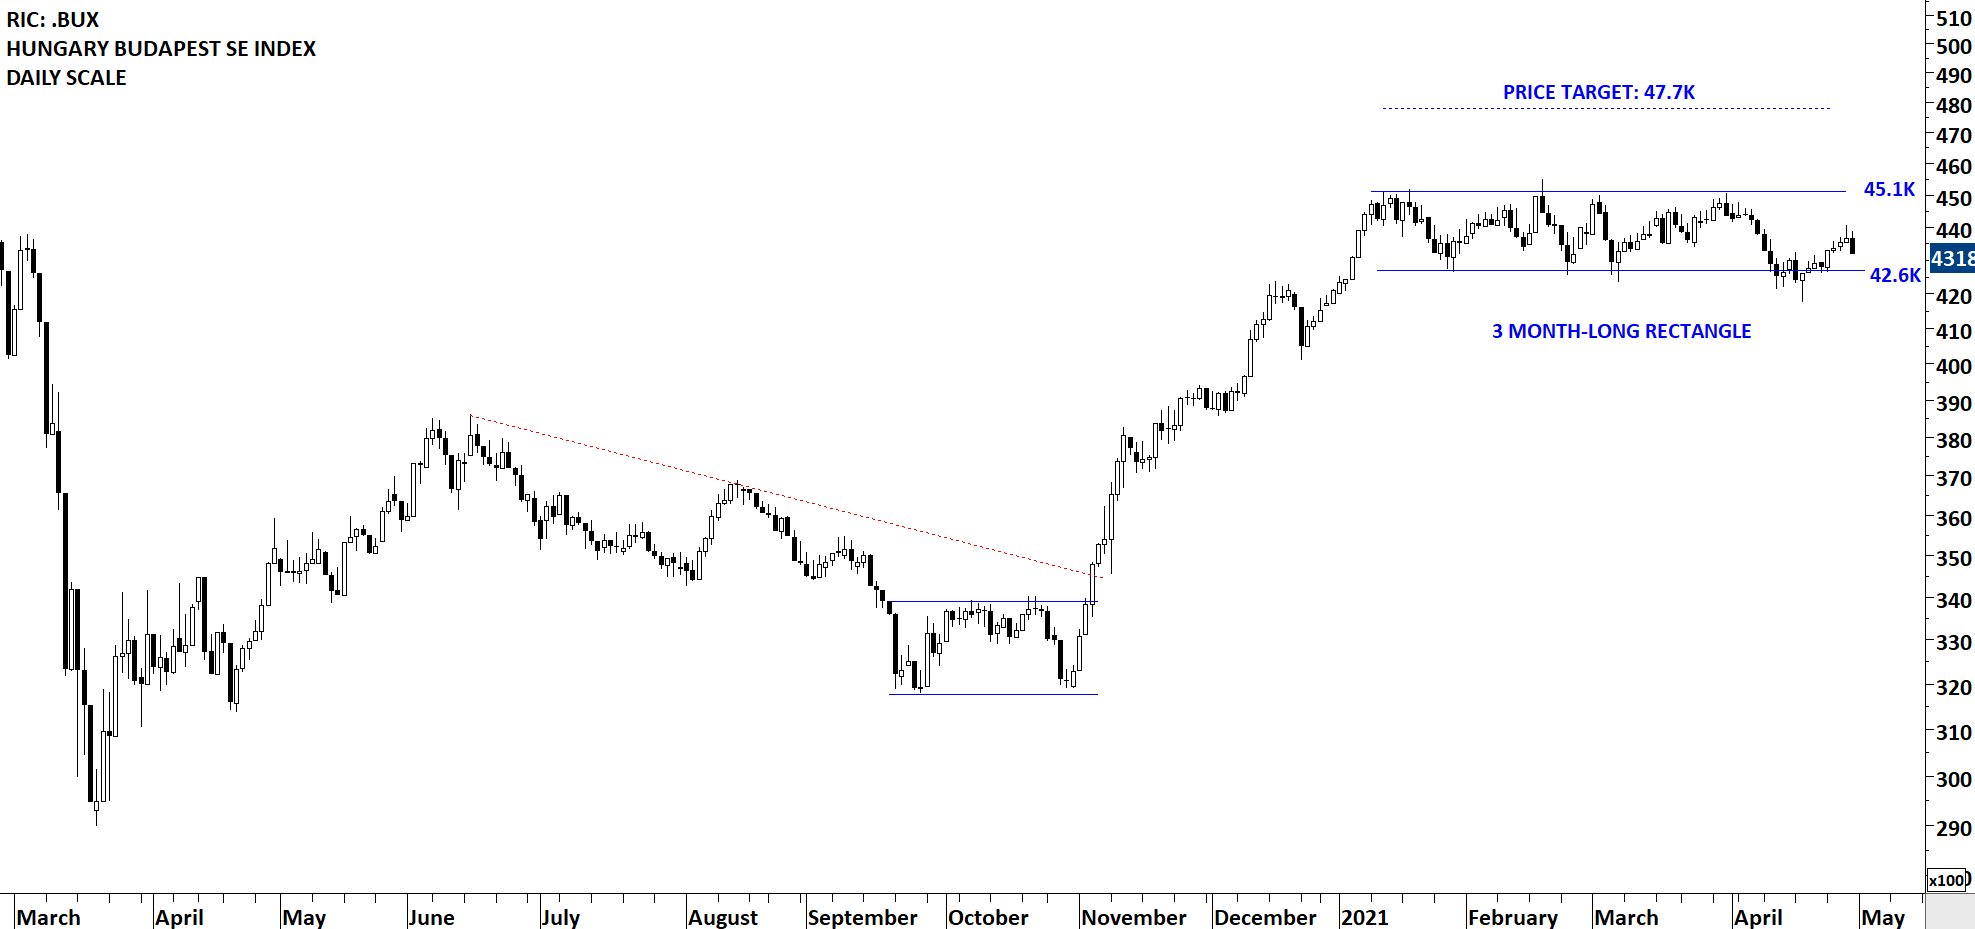
Well-defined chart patterns on indices are not very frequent. When I see clean chart patterns like these I bring to your attention in the review section of the weekly update. The Hungary Budapest SE Index is forming one of those text-book rectangle chart patterns with several tests of pattern boundaries. The horizontal resistance stands at 45.1K and the support at 42.6K. Breakout above 45.1K can target price objective at 47.7K. I’m monitoring this chart for a possible rebound from the lower boundary of the rectangle.
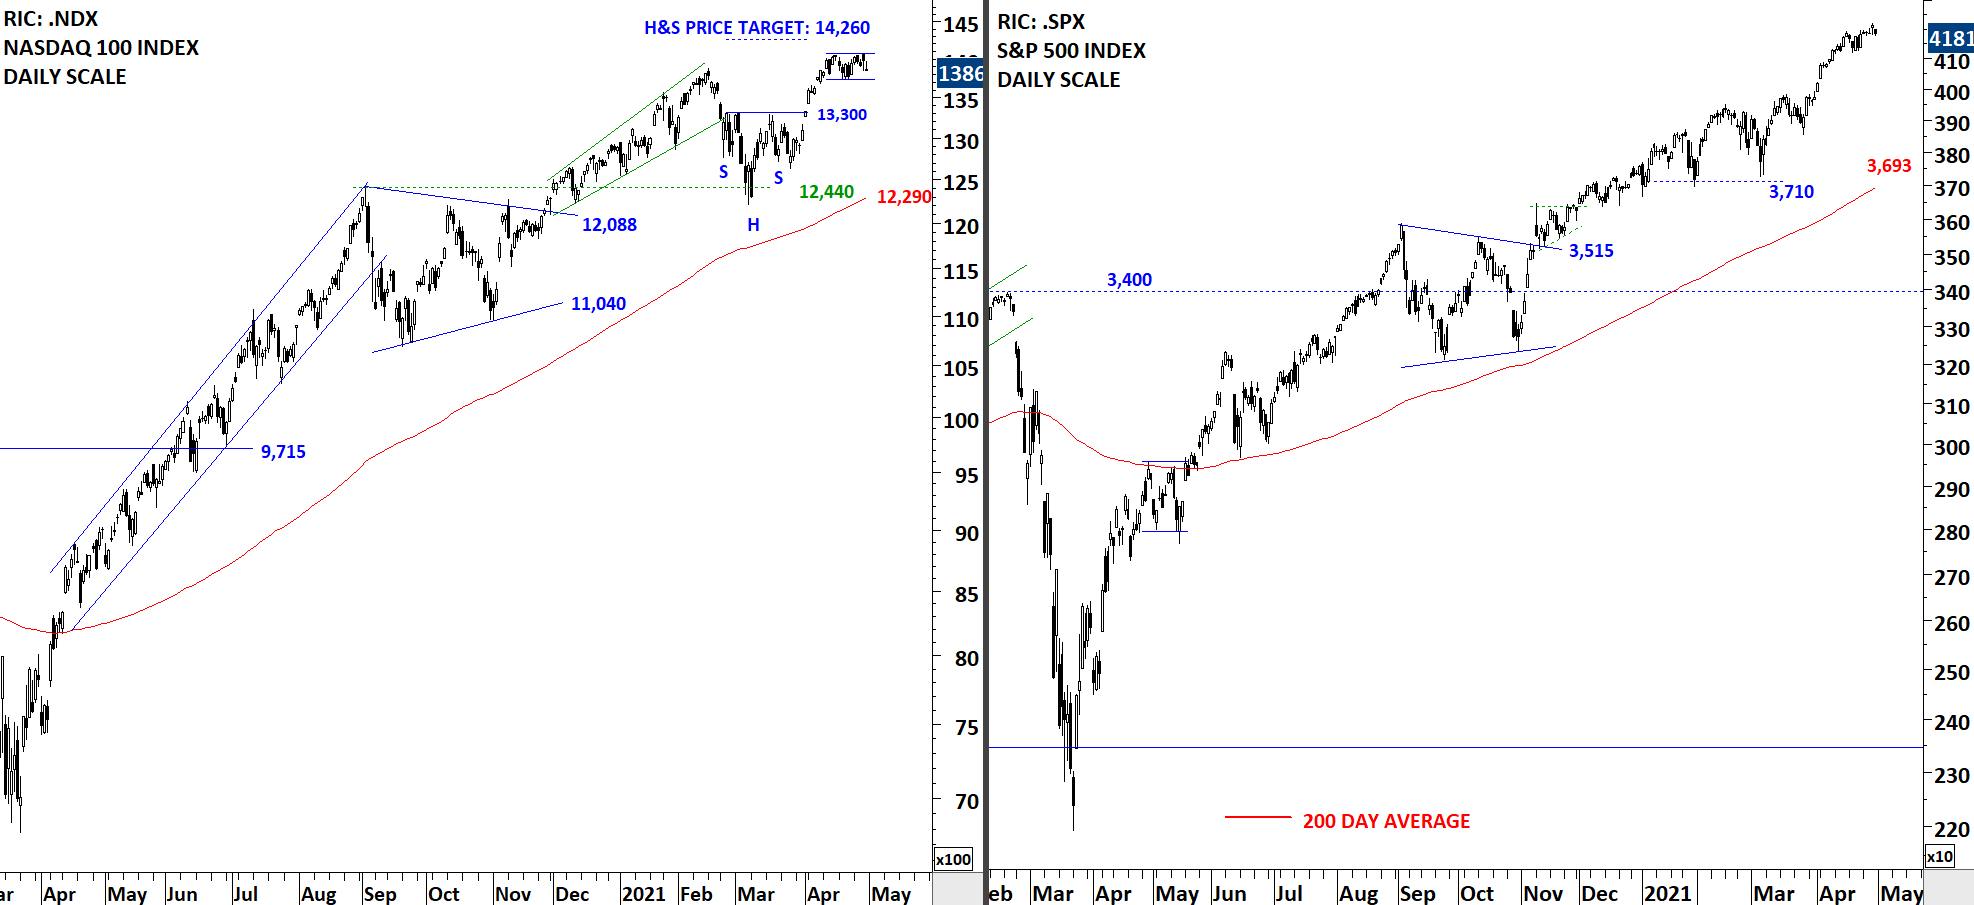
Nasdaq 100 rebounded from the support at 12,440. The index completed a short-term H&S bottom reversal with the breakout above 13,300 levels. Price objective for the short-term H&S bottom stands at 14,260 levels. S&P 500 Index pushed to all-time highs and remains strong. Both indices are trading above their respective 200-day averages. Uptrends are intact.
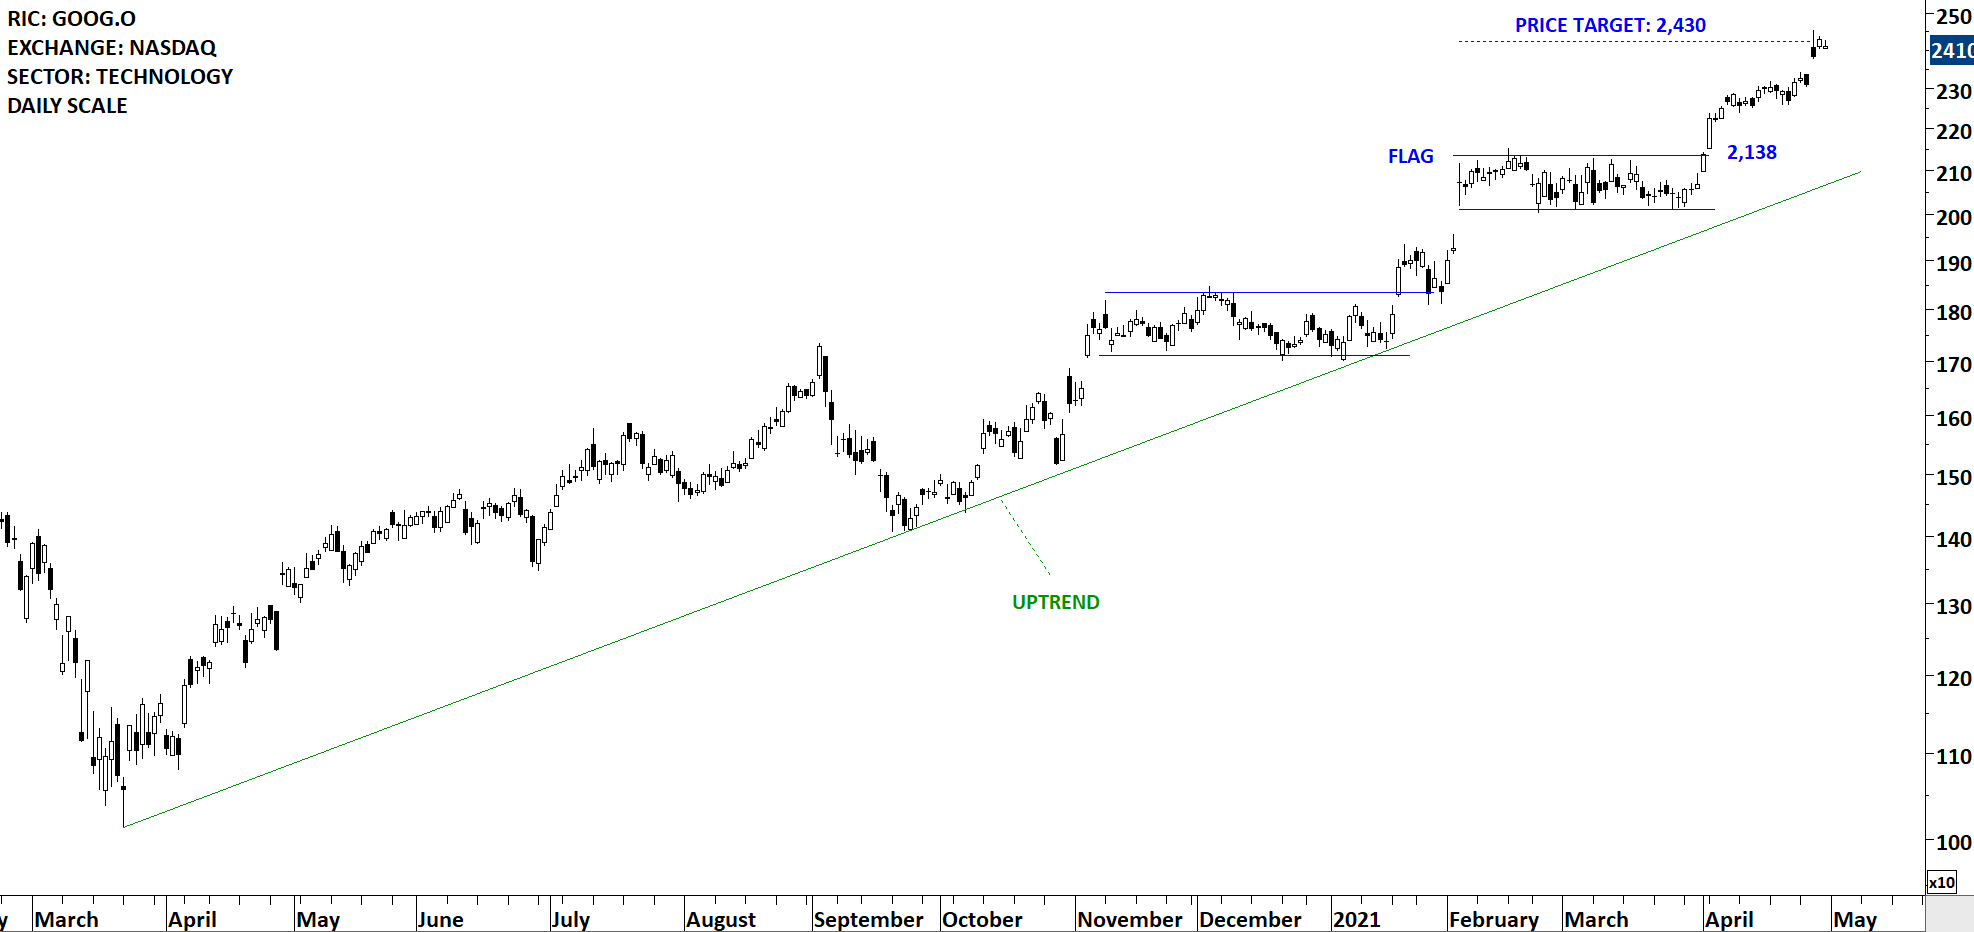
Google completed a bullish flag that acted as a continuation chart pattern. Since the beginning of March the stock has been in a steady uptrend. Price reached the target at 2,430 levels.
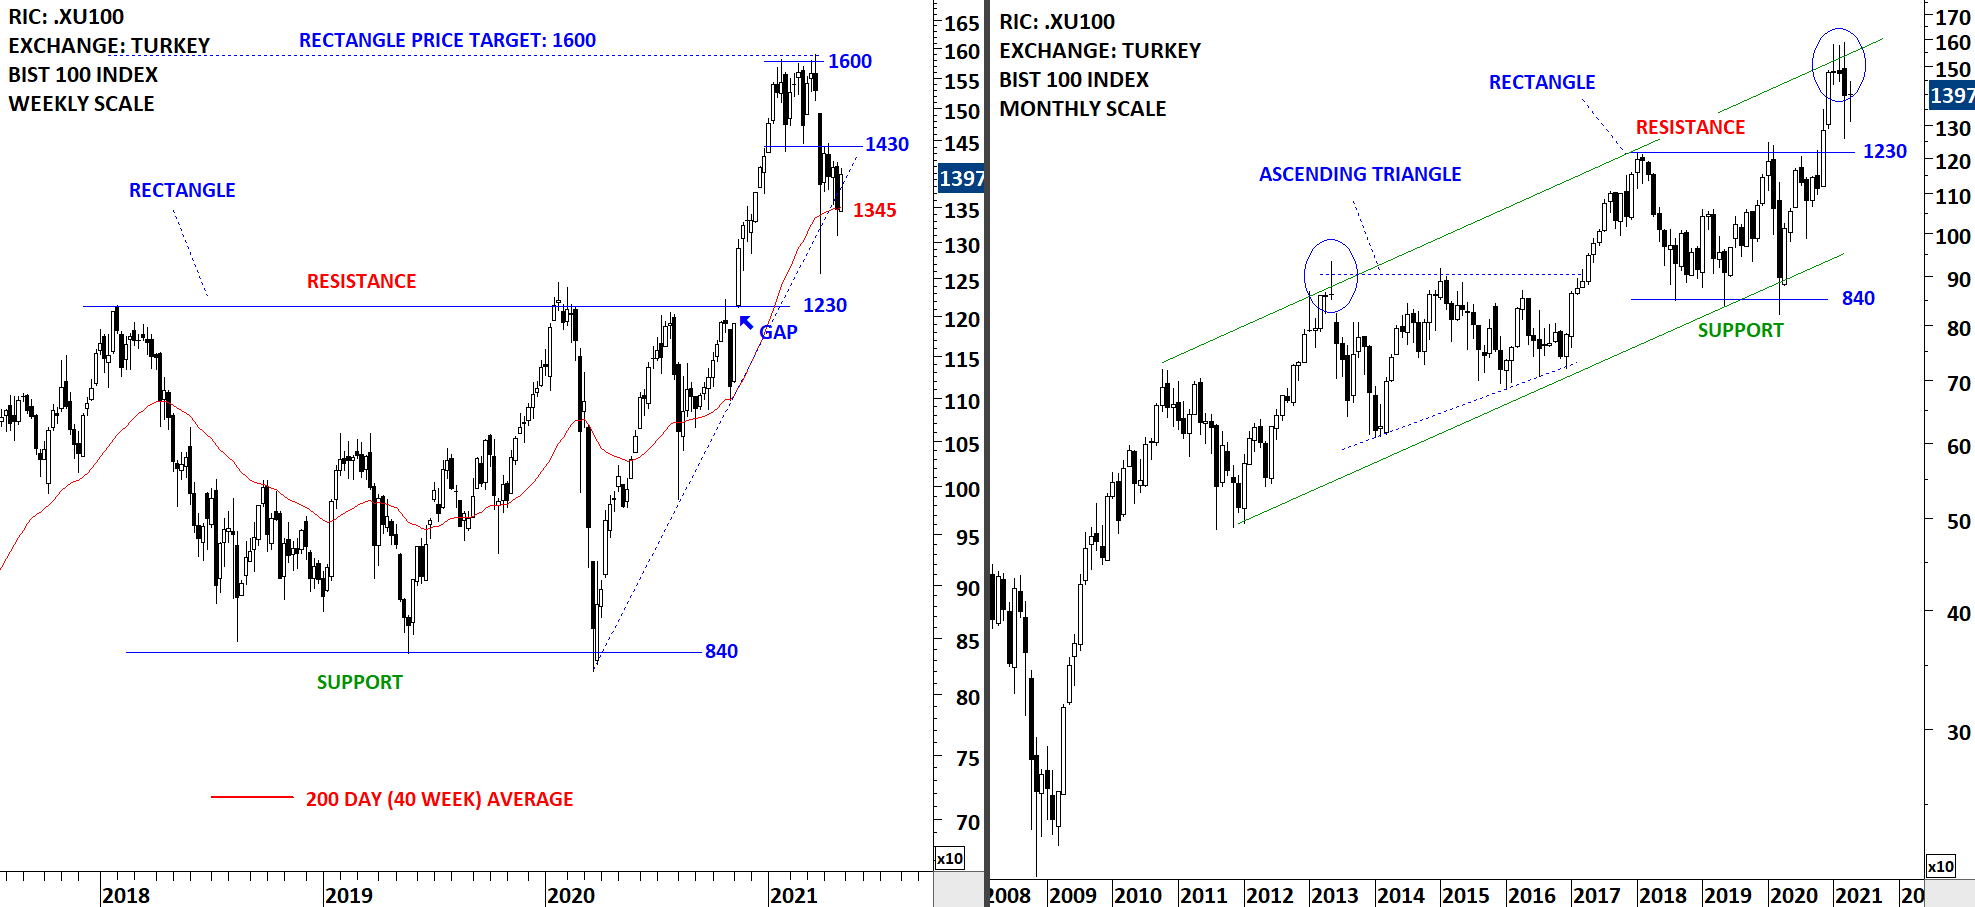
Turkey’s BIST 100 equity benchmark after reaching its rectangle chart pattern price target experienced a sharp sell-off. Earlier I have identified a trading range between 1,430 and 1,600 levels. Following the breakdown below the short-term support at 1,430 levels the index rebounded from the 200-day average. BIST 100 is now in a wide trading range between 1,230 and 1,430 levels. Long-term uptrend is still intact but in the short-term I will expect more volatility and choppy price action. I will monitor this index to see if price will be able to recover above 1,430 levels in the coming days. Failure to hold above the 200-day average can result in a re-tests of 1,230 levels.
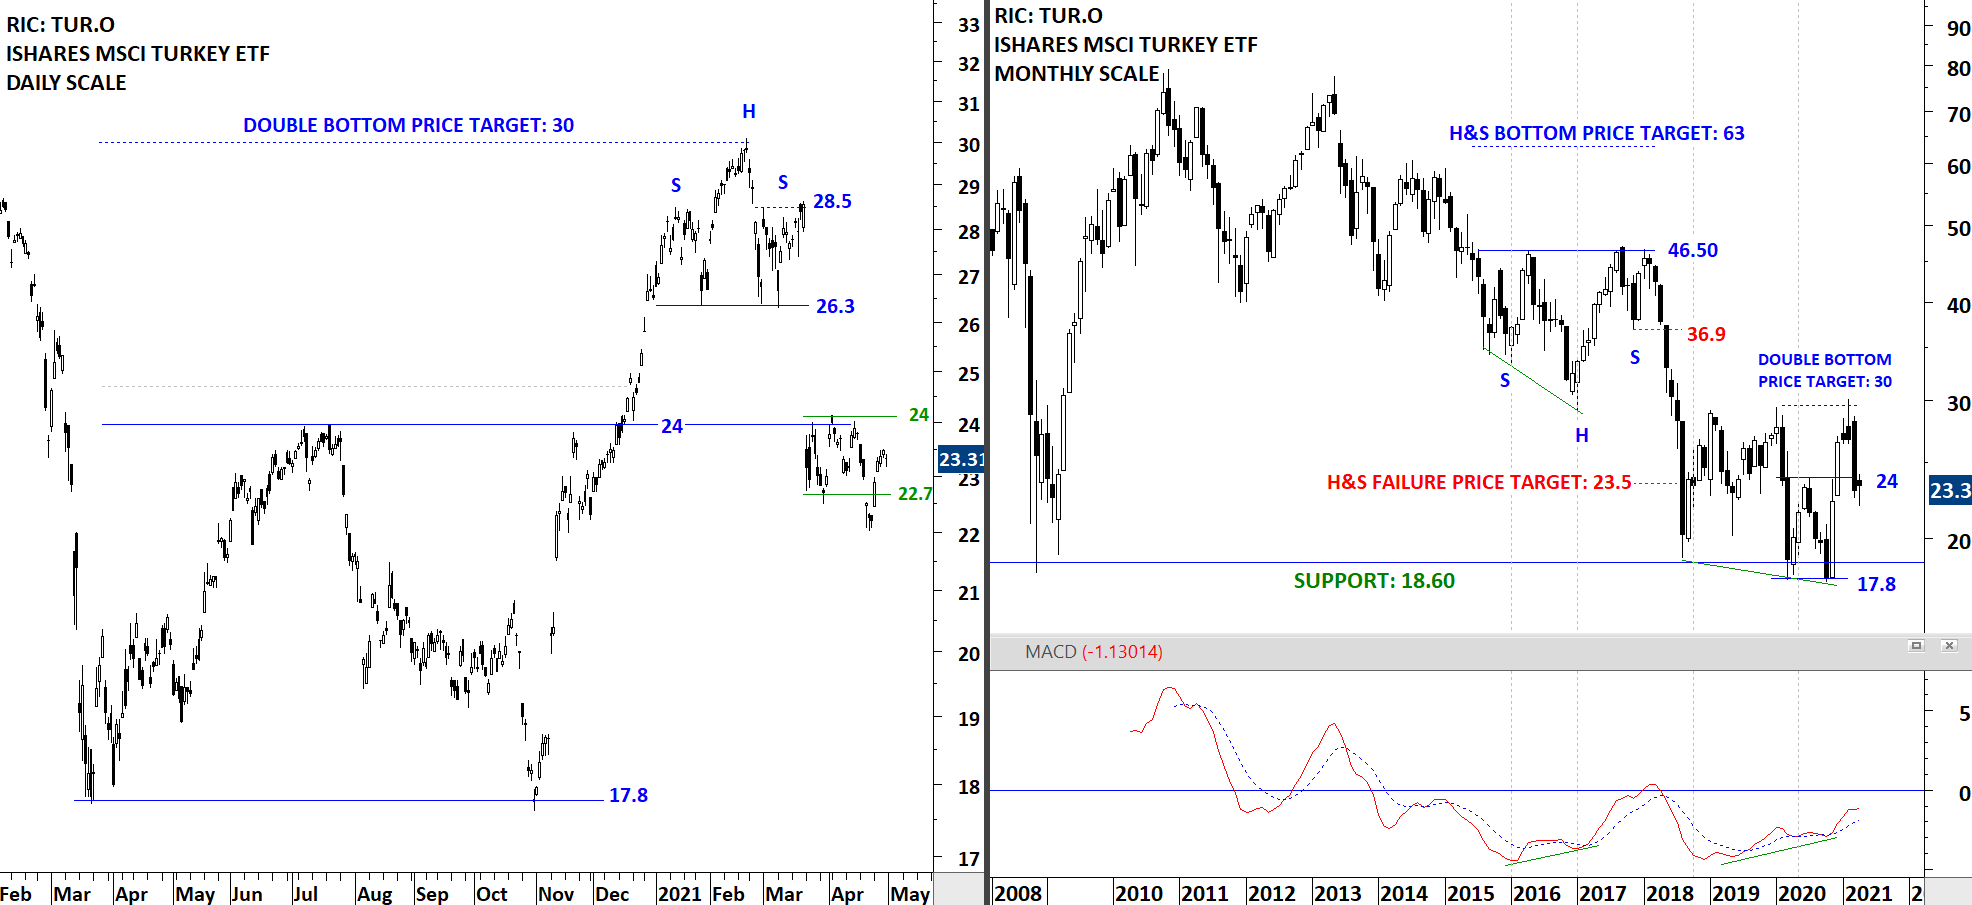
The chart below shows the Ishares MSCI Turkey ETF listed on the Nasdaq Stock Exchange both on daily and monthly scale. The ETF after breaking above the horizontal resistance at 24 levels, reached its price target at 30. 30 acted as resistance in the past as can be seen on the monthly scale price chart. The H&S top completed with a gap opening and resulted in a sell-off towards the support at 24 levels. The ETF failed to recover above 24 levels. Until price recovers above 24 levels, I will monitor this chart with a bearish perspective.
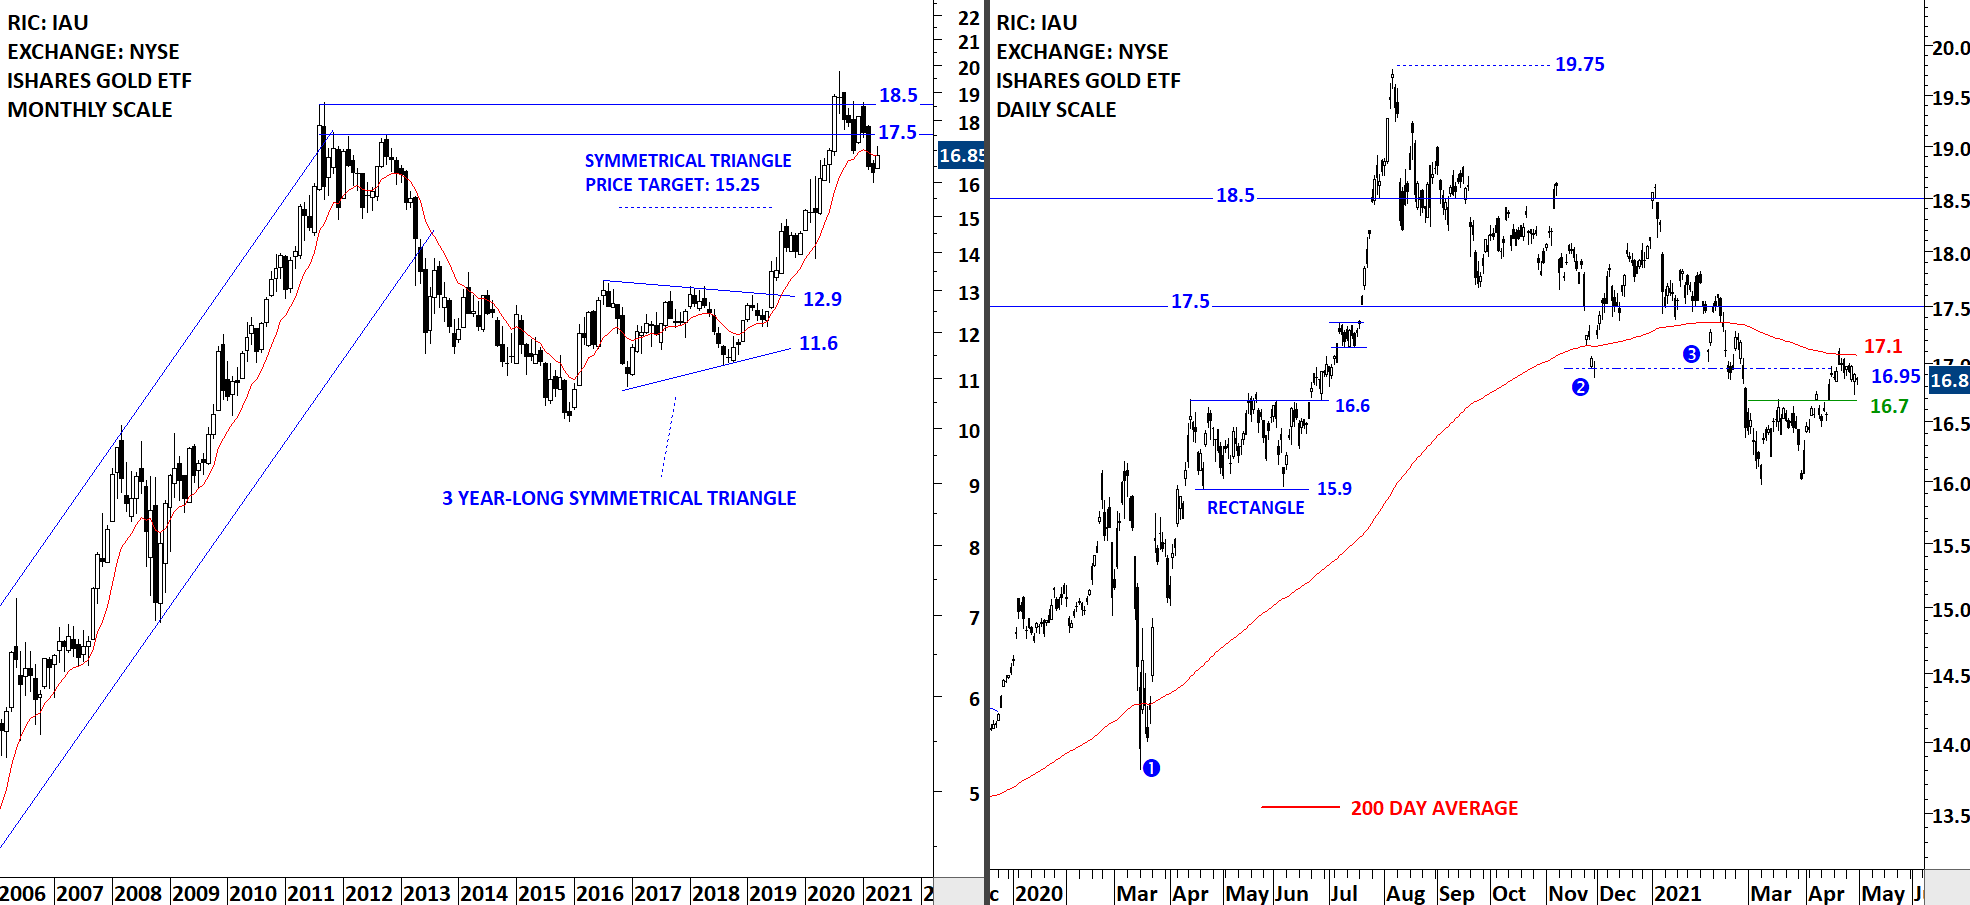
The Ishares GOLD ETF continues to remain under pressure after breaking down the minor lows labelled with 2 & 3. Failure to hold above the 200-day average is resulting in a larger-scale correction. It is possible that price completed a short-term double bottom but clearly we have several resistances ahead. Breakout above 16.7 met resistance between 16.95 and 17.1. Gold needs to prove itself. Trend is still down. Only after a recovery above the 200-day average I will view this chart with a bullish bias.
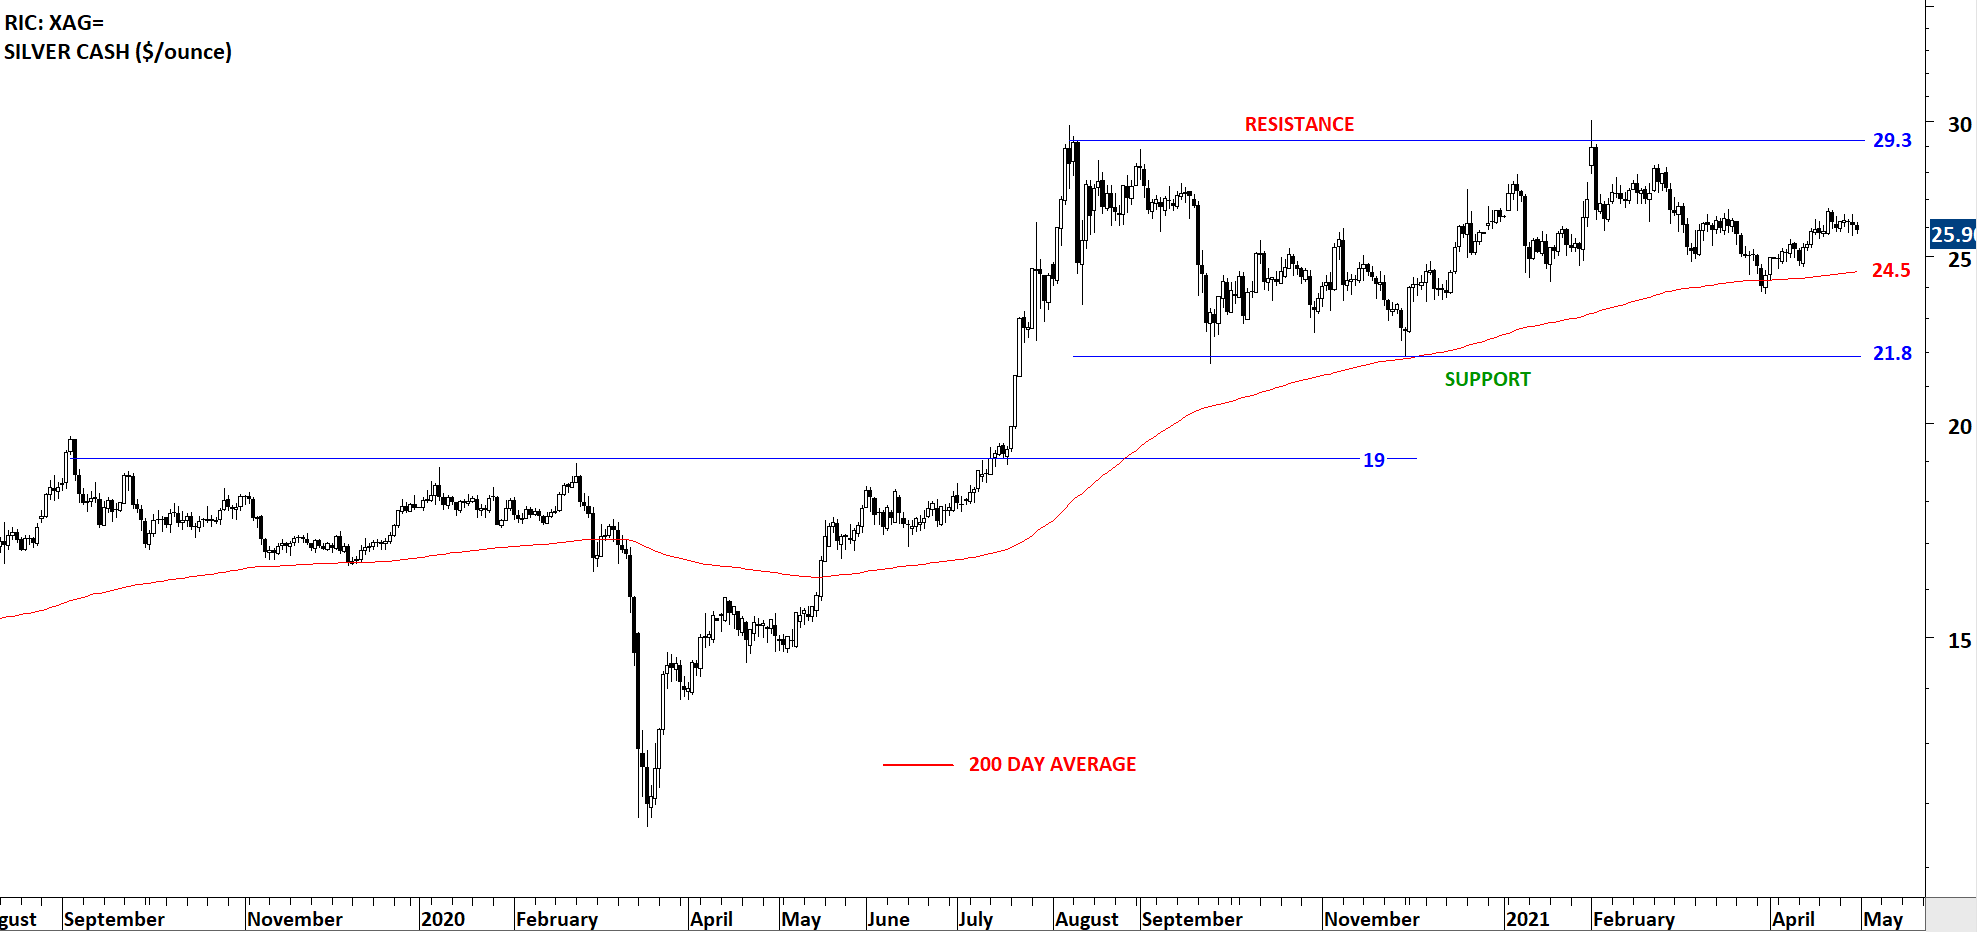
After breaking above 19 levels in July 2020, Silver is consolidating and reverting back to its 200-day average. A strong support area can be identified between 21.8 and 24.5. The boundaries of the consolidation are 21.8 and 29.3. Price remains above the 200-day average and the trend is up. Breakout above the upper boundary at 29.3 can add momentum to the uptrend. Failure to hold above the 200-day average can result in a re-test of the lower boundary at 21.8 levels. I will monitor this chart for a possible short-term H&S bottom reversal above the 200-day average.
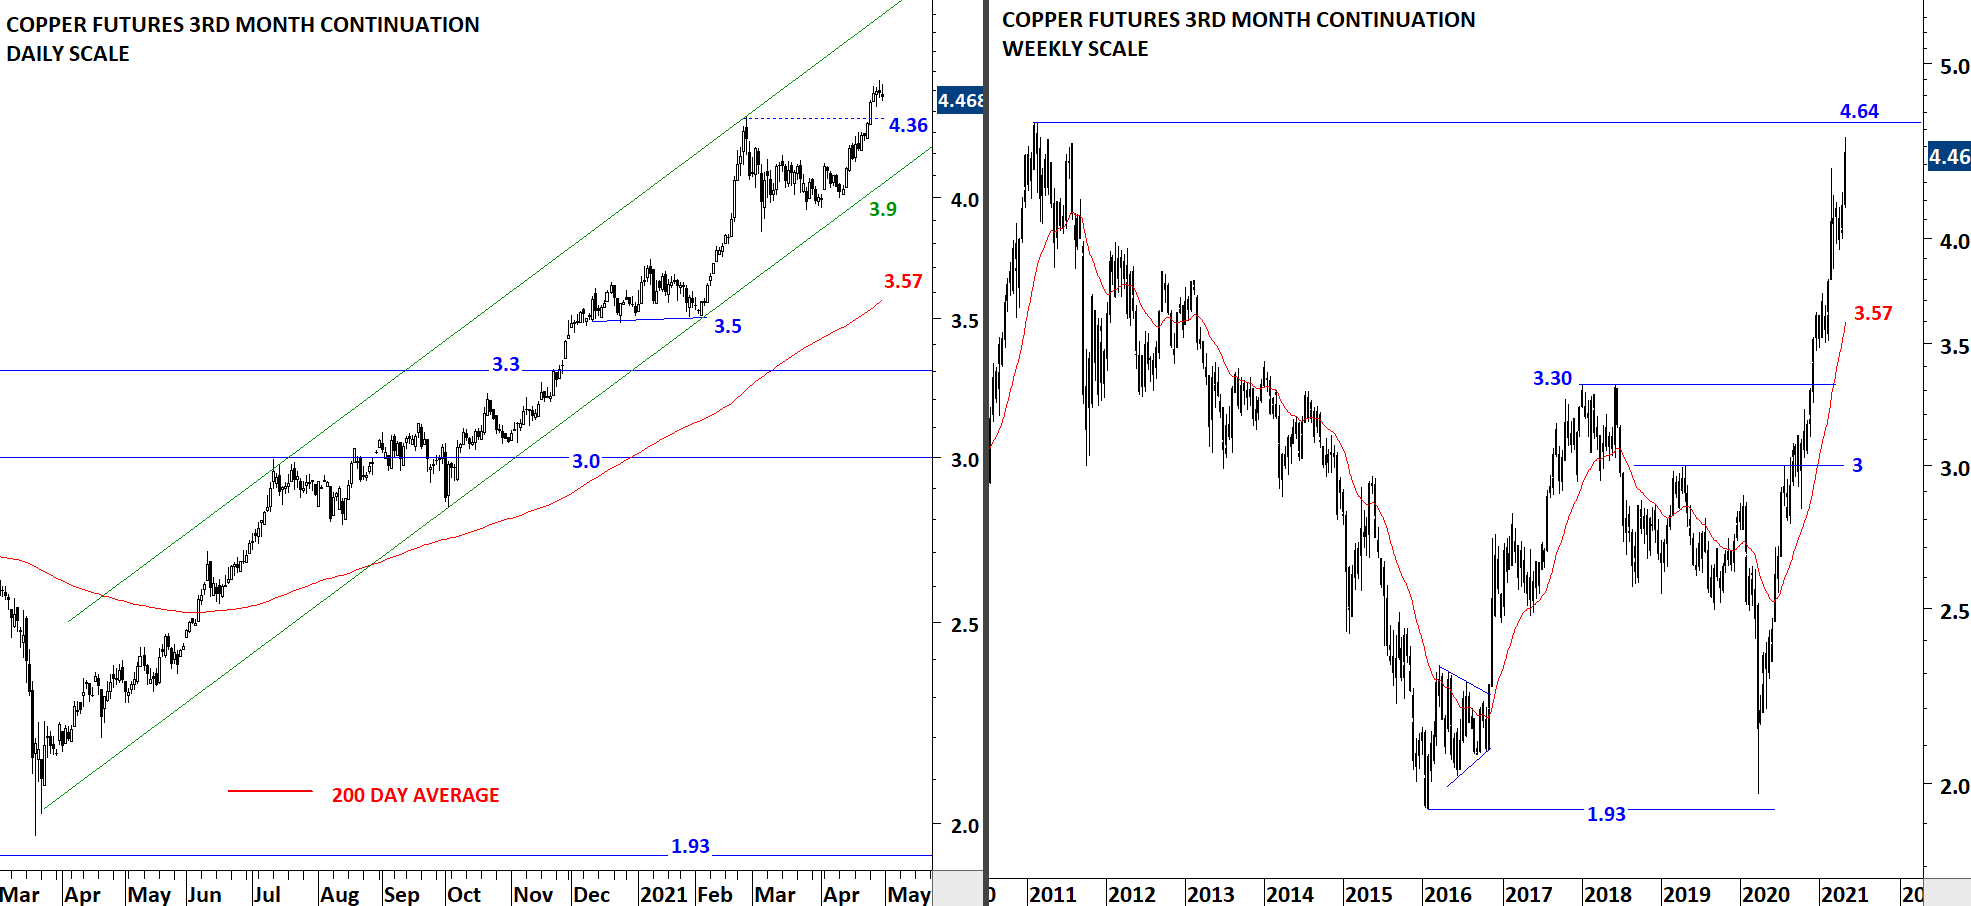
Copper’s advance has taken a steep shape without much correction. Price has deviated from the 200-day average and can be over-extended. While the trend is clearly up, during any pullback strong support will stand between 3.90 and 4.36 levels. Price has formed a clear upward trend channel with the lower boundary acting as support at 3.9 levels. On the weekly scale price chart we can see that price is now close to the long-term resistance at 4.64 levels.
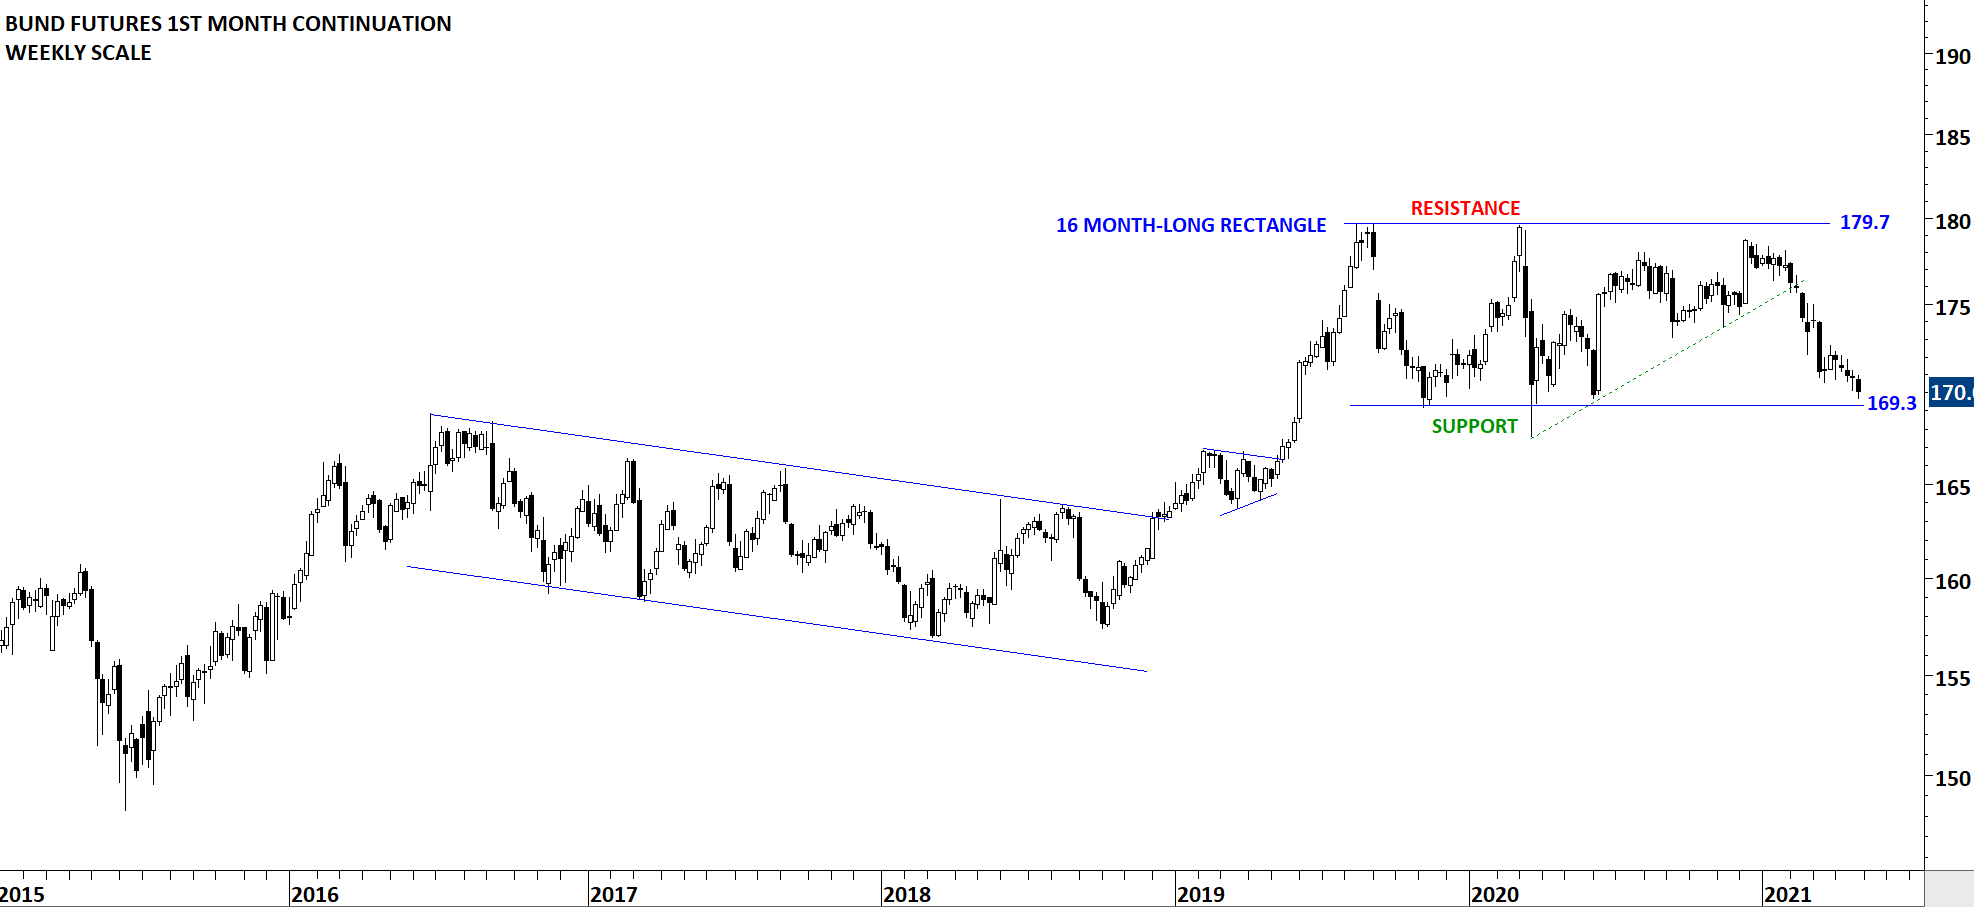
European Bund price is in a wide consolidation range between 169.3 and 179.7 levels. The trading range is possibly forming a 16 month-long rectangle. Strong support remains at 169.3 levels. I will monitor this chart for a possible rebound from strong support area. Higher Bund prices could mean lower yields.
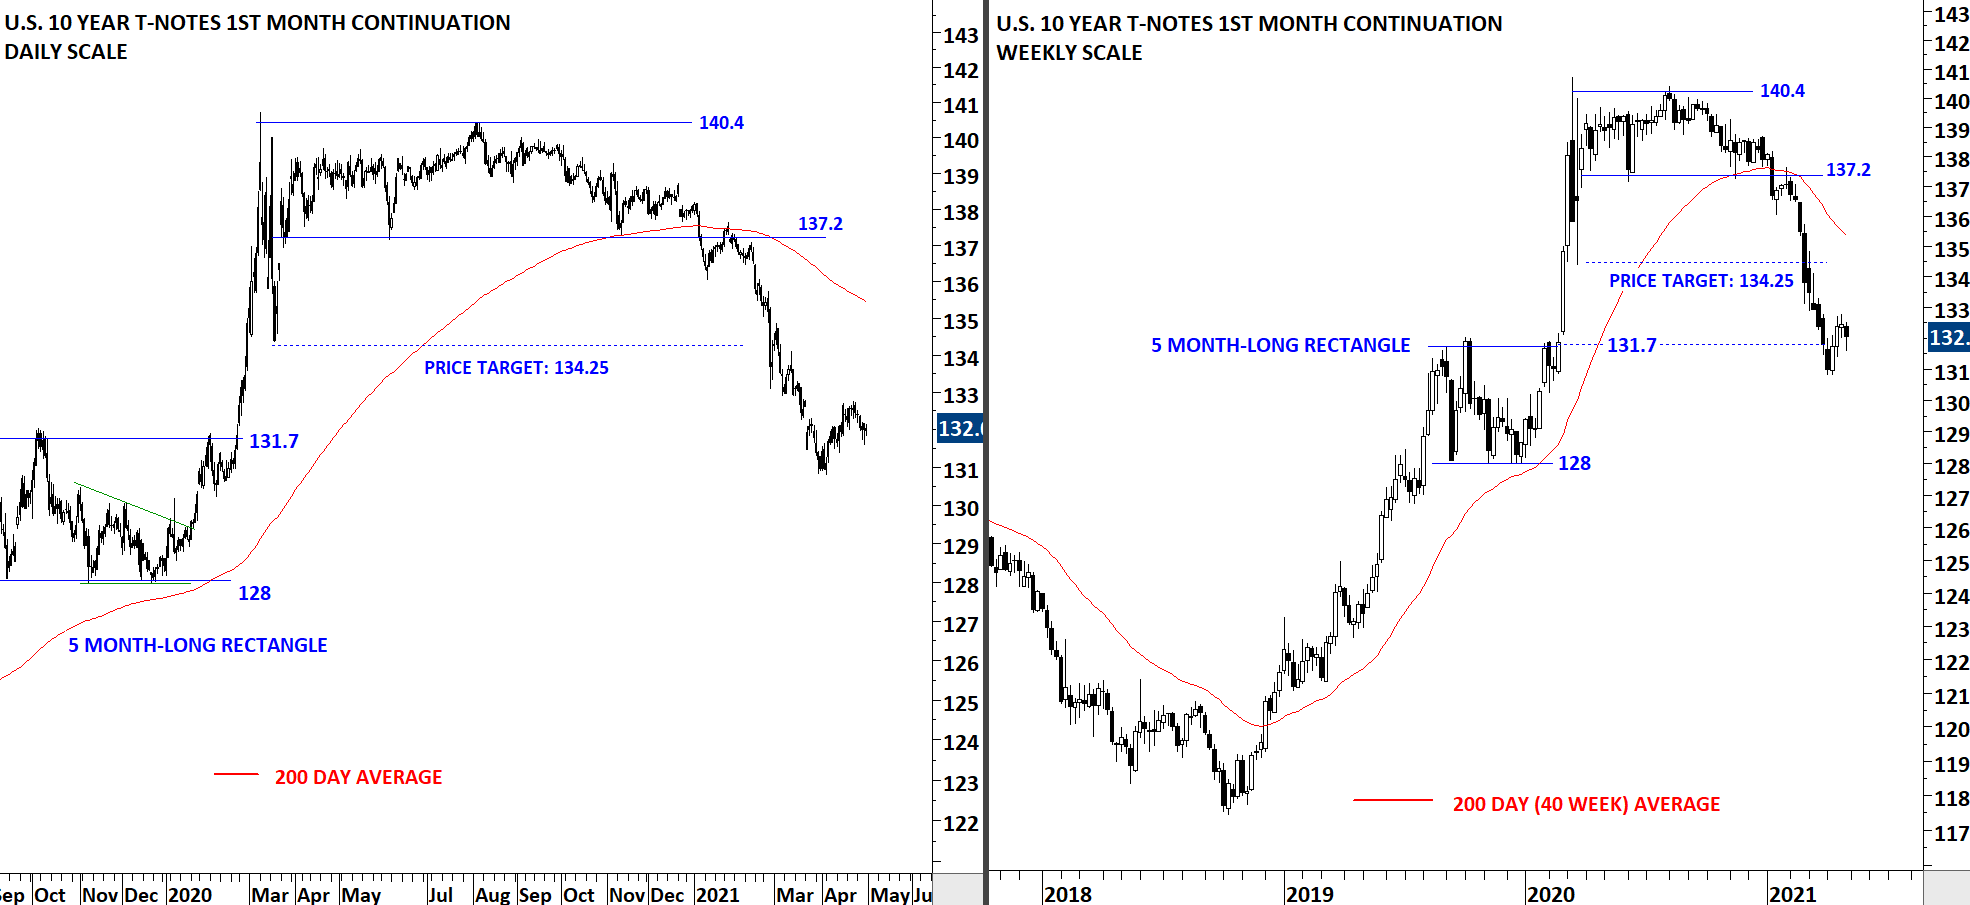
The U.S. 10 Year T-Note broke down the support at 137.2 levels. Breakdown not only breached the horizontal support but also the 200-day average. While the price target for the rectangle is met at 134.25 levels, the weekly candles showed significant weakness. Previous support at 137.2 becomes the new resistance. I would like to see some kind of short-term bottom reversal chart pattern before concluding for a possible rebound. The upper boundary of the previous consolidation (5 month-long rectangle) at 131.7 levels acted as short-term support.
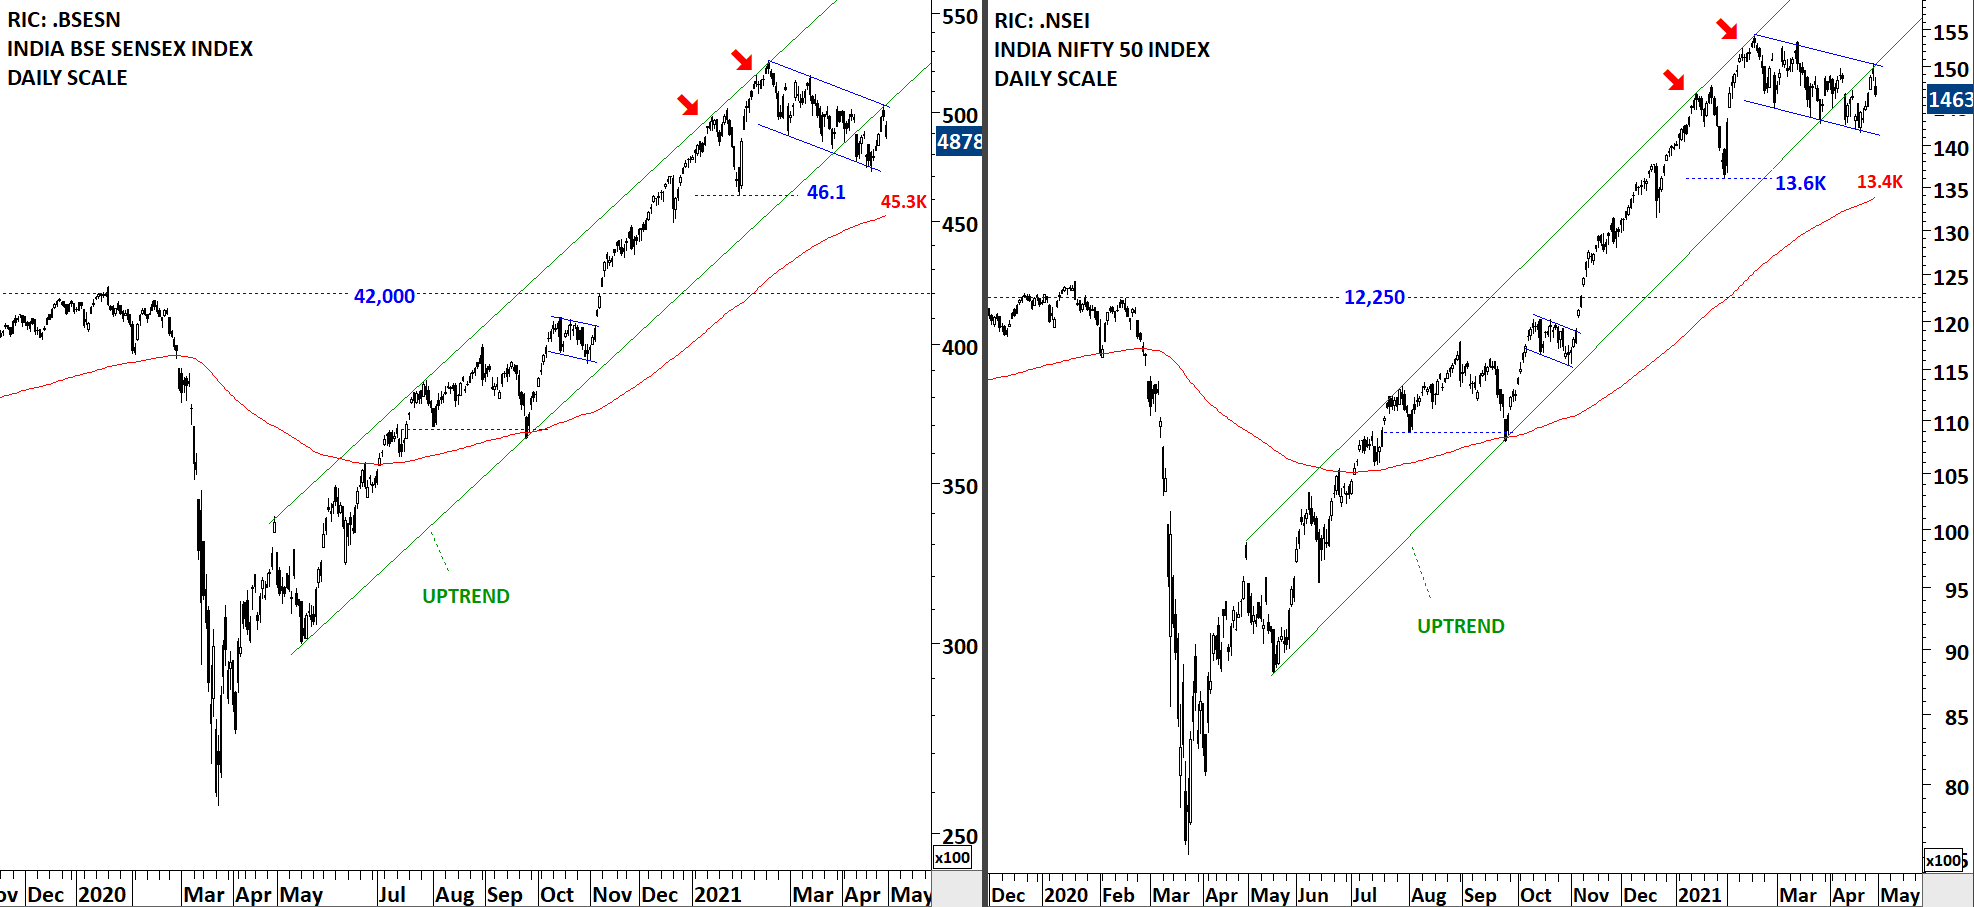
Both BSE Sensex and Nifty 50 Index respected the boundaries of the upward trend channels. Both indices reversed from the upper boundary of their trend channels and tested the lower boundaries. During this time 200-day averages kept moving higher. Uptrends are intact. I will monitor both indices for a quick recovery above the lower boundaries of their uptrend channels. Failure to do so can result in a correction towards the support areas formed by the 200-day averages. Even though we have seen a rebound towards the lower boundary and a pullback, this week’s price action was not conclusive.
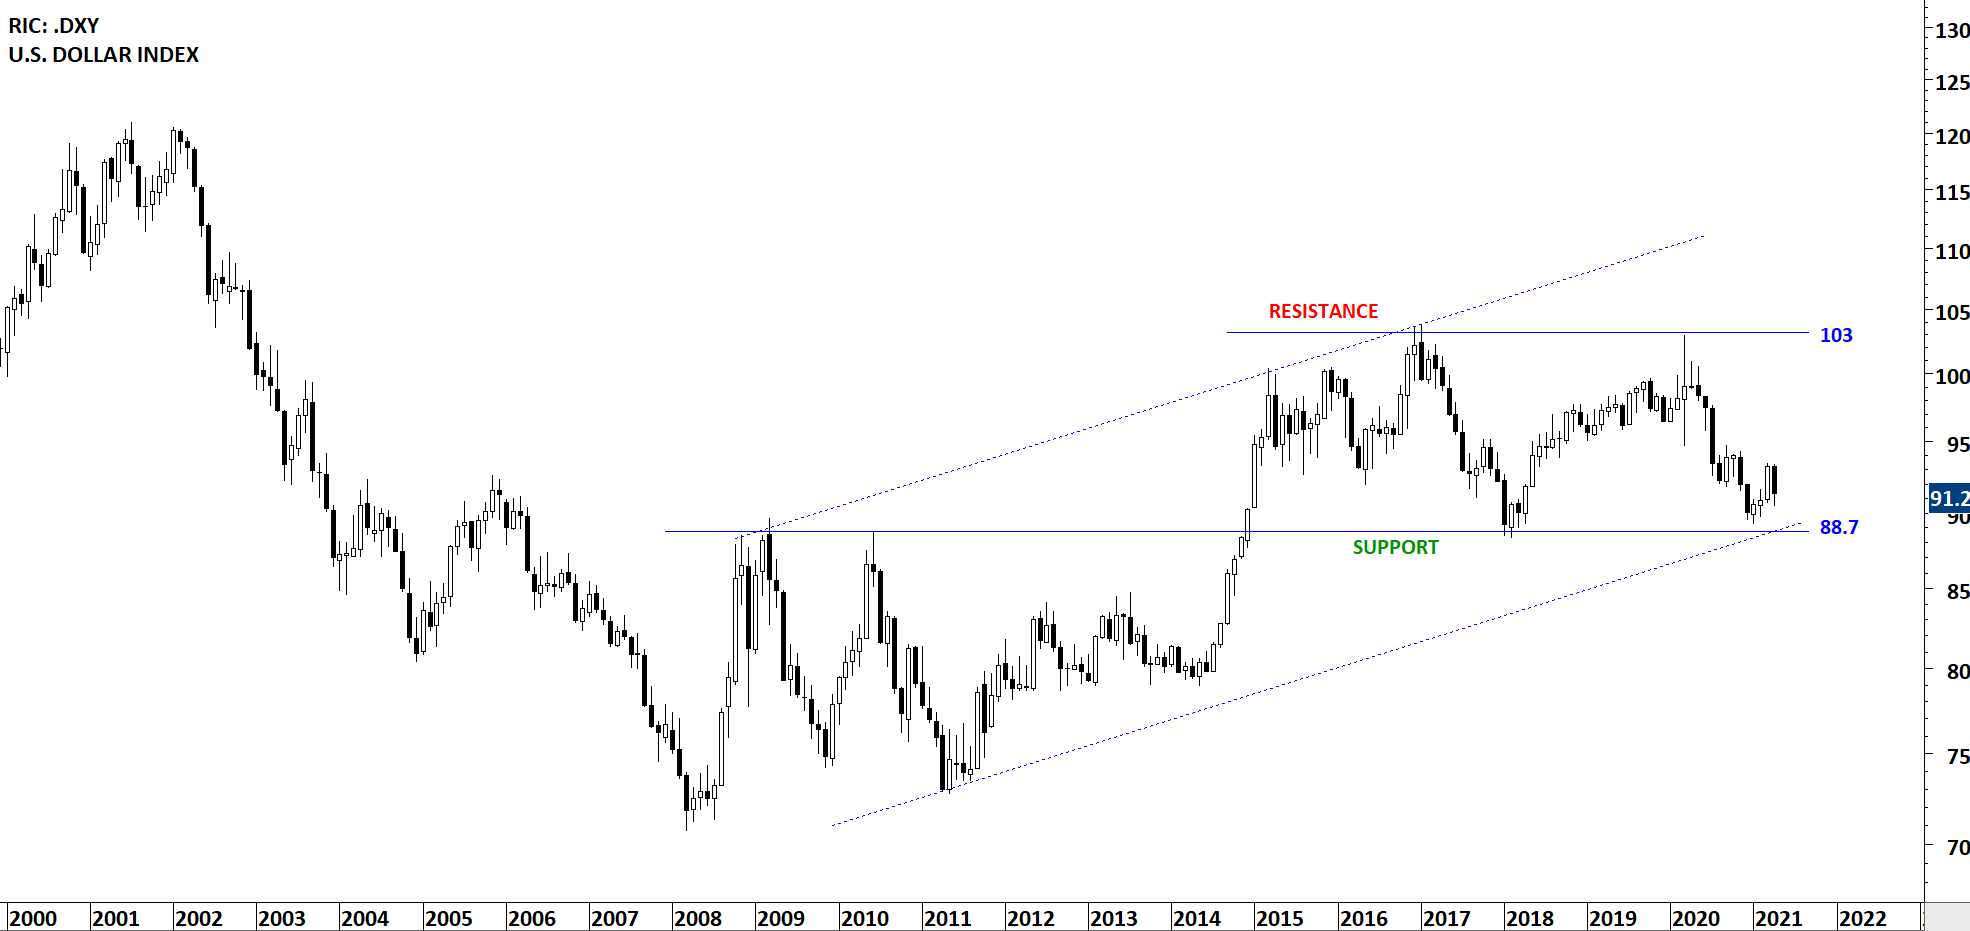
Since the beginning of the year, the U.S. Dollar Index has been in a downtrend. In March 2020, the index reversed from the resistance at 103 levels. Price is now back to 2018 levels. 88.7 acted as resistance/support in the past and I’m thinking it might have some impact in the short/medium-term. March was strong and April was weak. If the U.S. Dollar index manages to put in a higher low in the second quarter, then I will expect further strength in the coming months.
I’ve discussed USDJPY in the previous updates. I continue to think that a breakout on this chart will have important long-term implications. Strong USD against Japanese Yen can target 125 levels in a short period of time. The pair is going through historical low volatility condition and a breakout can result in a strong price action. I’m looking for a breakout above 110 levels.

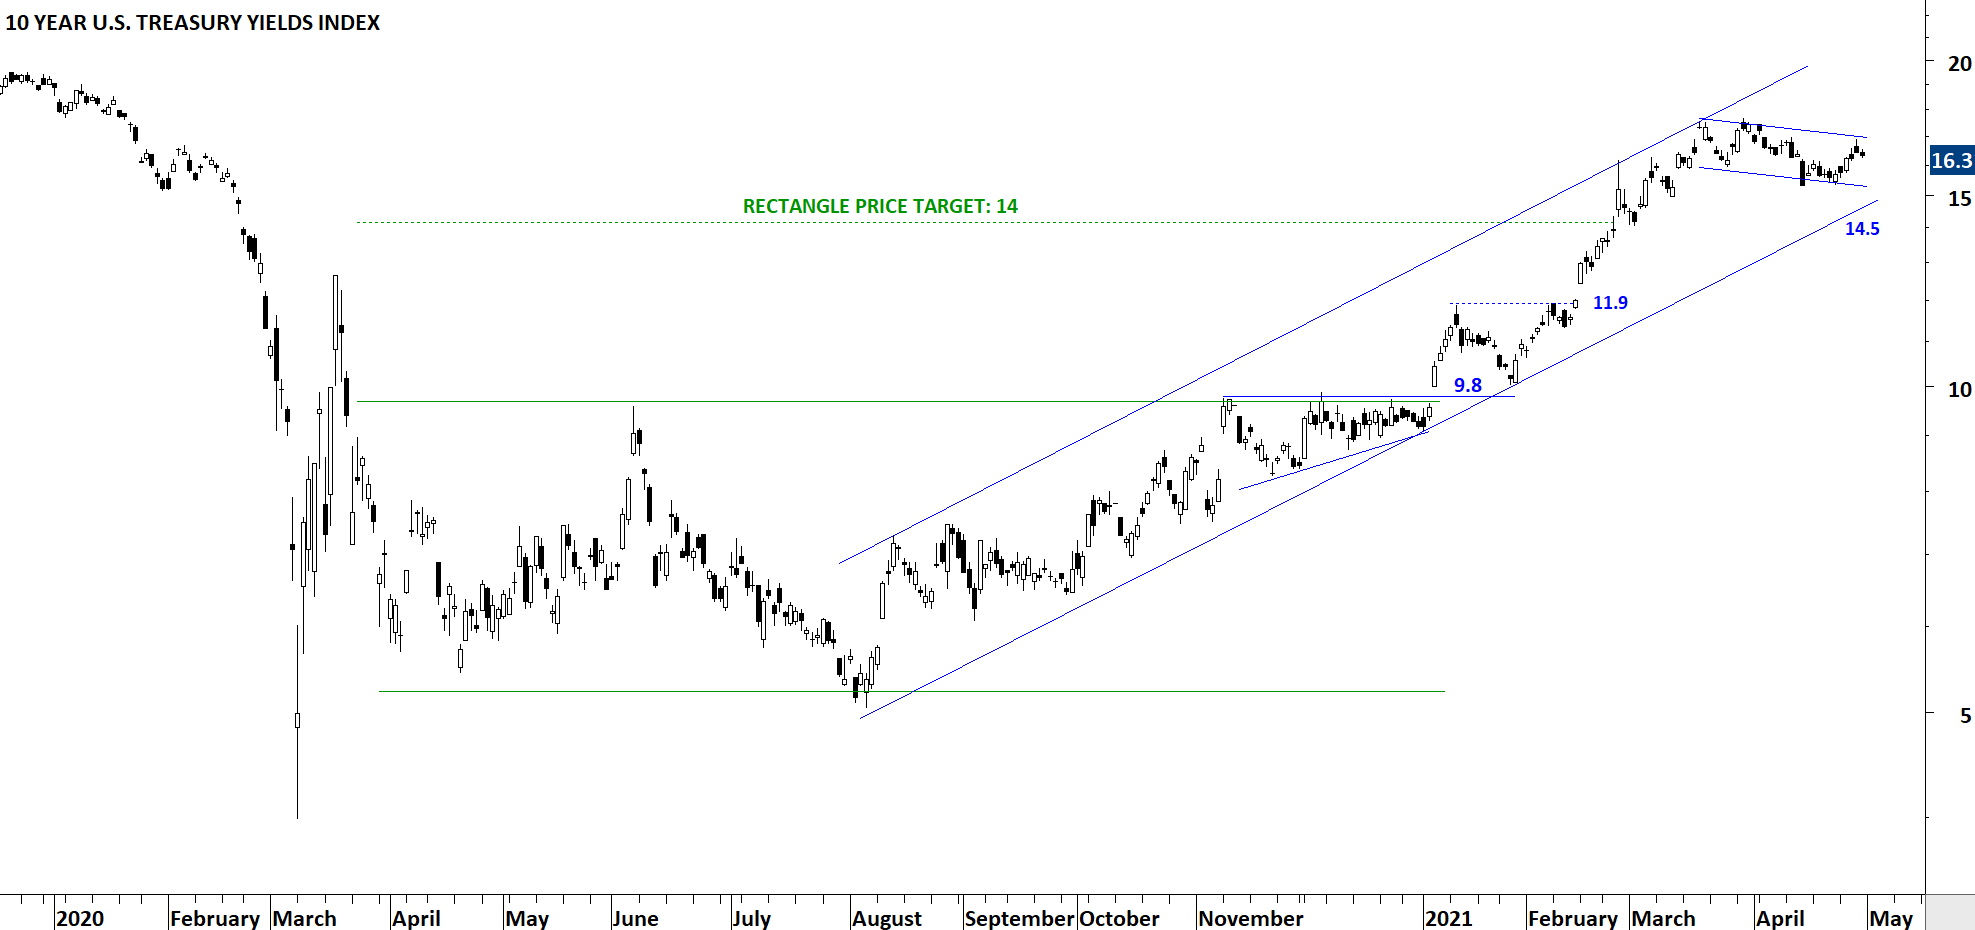
The chart below is the 10 Year U.S. Treasury Yield Index. The index after forming a short-term ascending triangle, broke out of both a long-term base and the bullish ascending triangle. Breakout took place at 9.8 levels which acted as the support level. Chart pattern price target at 14 levels is met. Uptrend is intact. I’ve updated the boundaries of a possible trend channel. The lower boundary can act as support at 14.5 levels.
CRYPTOCURRENCIES
BTC resumed its strong uptrend. Price target for the symmetrical triangle was met at 30K. Uptrend is intact, though it is taking a parabolic shape with back to back monthly gains and lack of correction. During any correction strong support will stand at 22.2K. Long-term price chart shows an orderly trend channel. The upper boundary of the long-term trend channel stands at 200K (not a price target from a classical charting perspective).

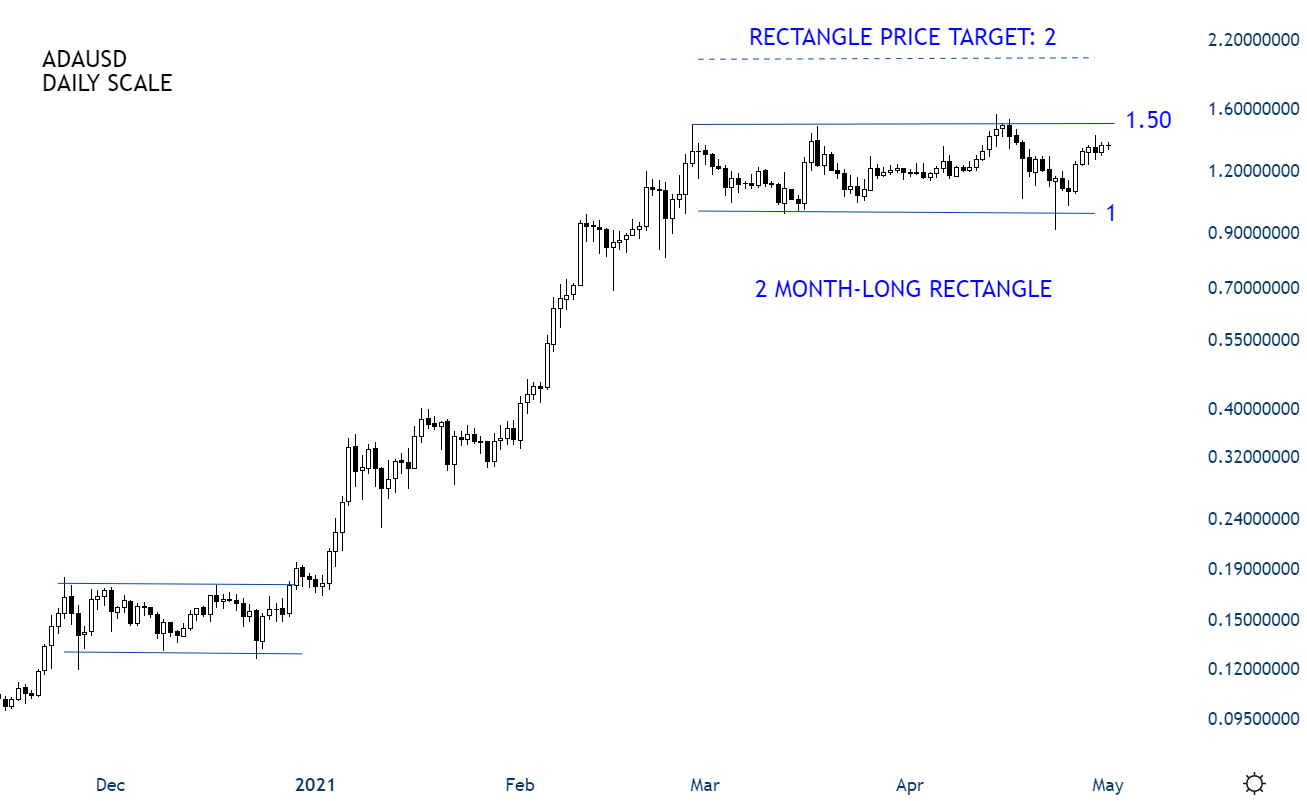
Below are some of the good looking crypto currency chart pattern setups. I like to focus mostly on chart patterns with well-defined horizontal boundaries. ADA/USD formed a 2 month-long rectangle with the resistance at 1.5 and support at 1. Breakout above 1.5 can target 2 levels. The chart shows a steady uptrend.
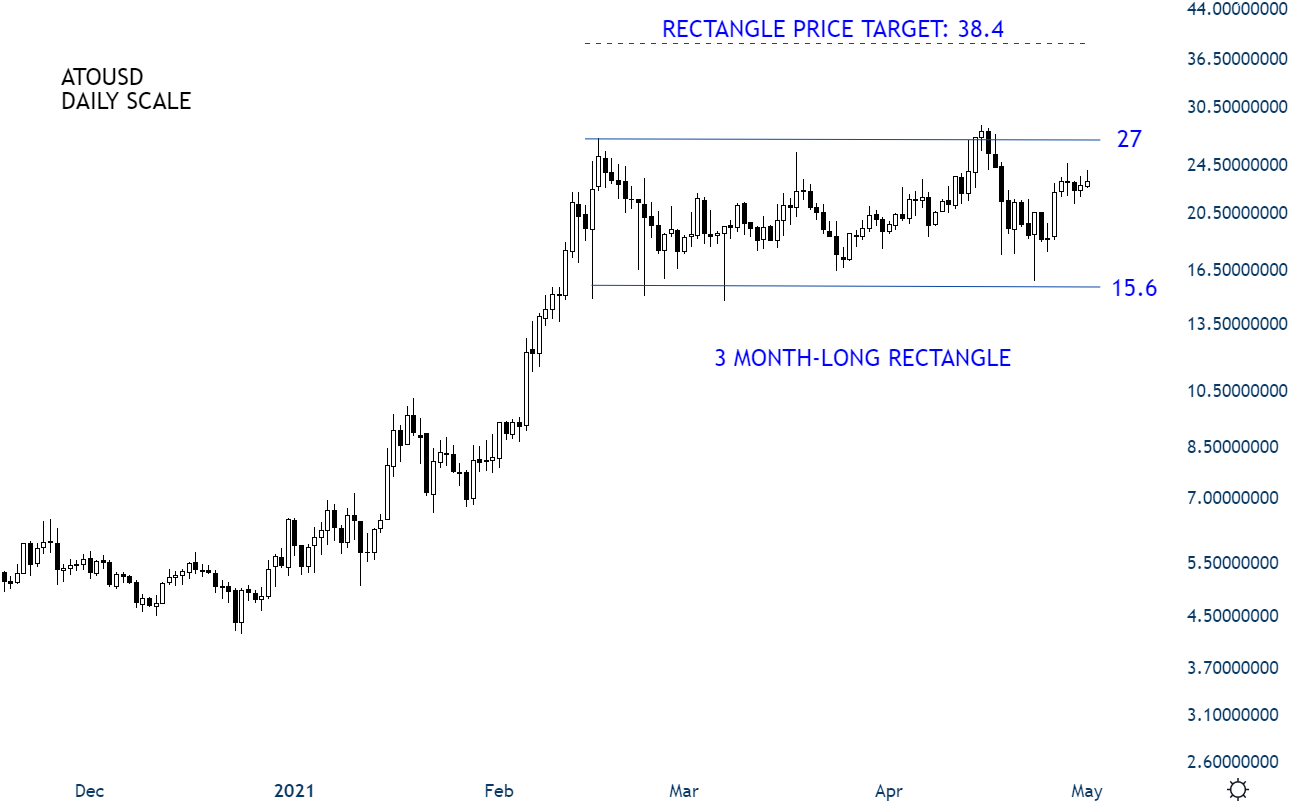
ATOUSD formed a 3 month-long rectangle chart pattern with the upper boundary acting as resistance at 27 levels. Breakout above 27 can target price objective at 38.4 levels. There has been several tests of pattern boundary and the chart shows a steady uptrend.
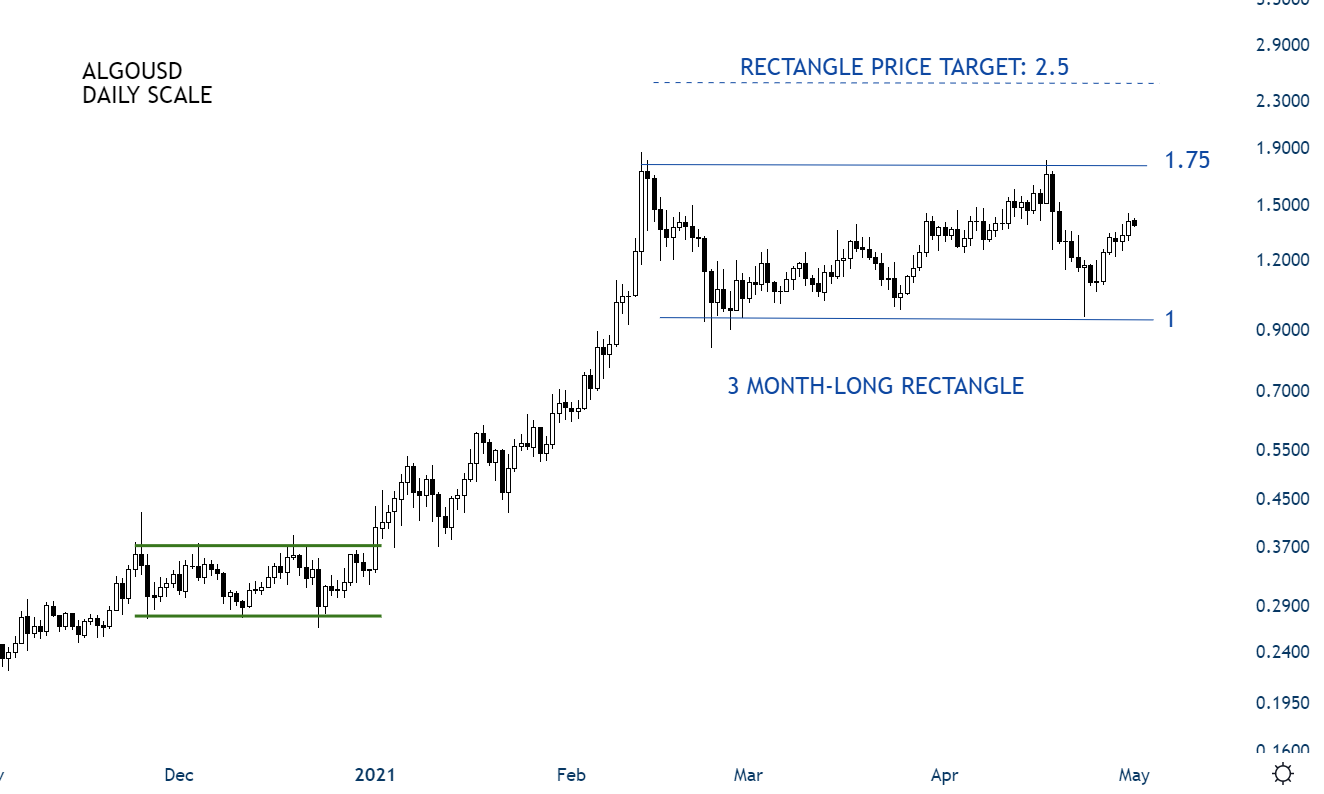
ALGOUSD formed a 3 month-long rectangle with the upper boundary acting as resistance at 1.75 levels. Breakout above 1.75 can target 2.5 levels. Price chart shows a steady uptrend.
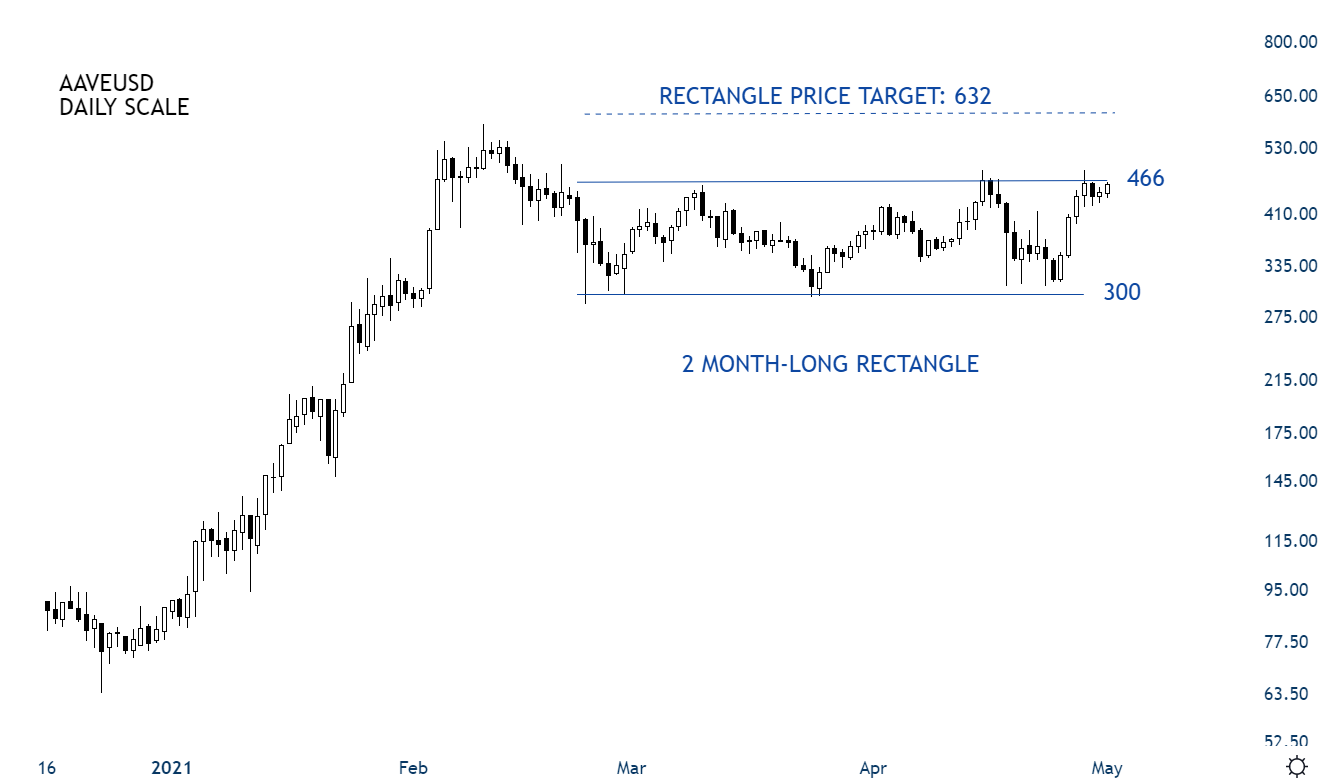
AAVEUSD formed a 2 month-long rectangle chart pattern. There has been several tests of pattern boundaries at 300 and 466 levels. Breakout above 466 can target price objective at 632 levels.
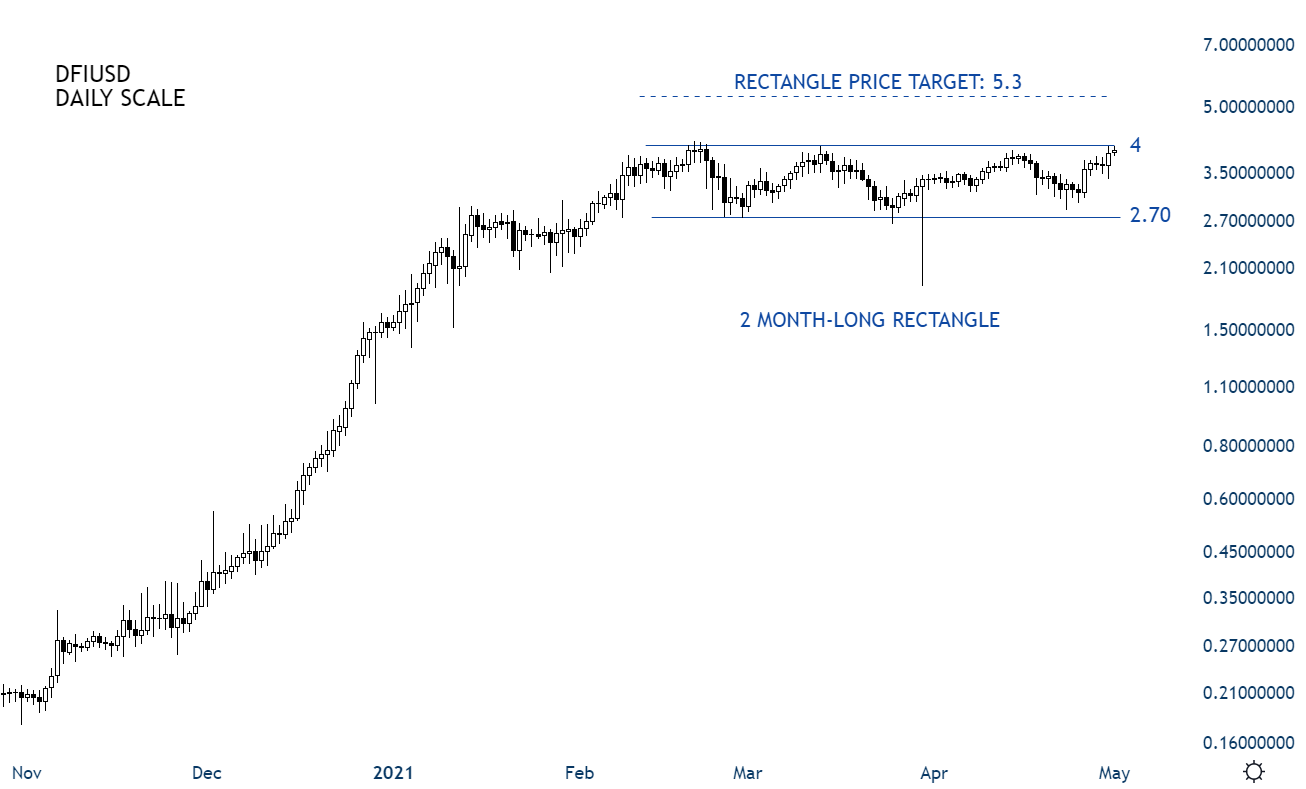
DFIUSD formed a tight, 2 month-long consolidation with the upper boundary acting as resistance at 4 levels. Breakout can target 5.3 levels. Price chart shows a steady uptrend.
There are 7 new breakout signals.
TECH CHARTS ALERT
GULF PETROLEUM INVESTMENT COMPANY KSCP (GPIK.KW)
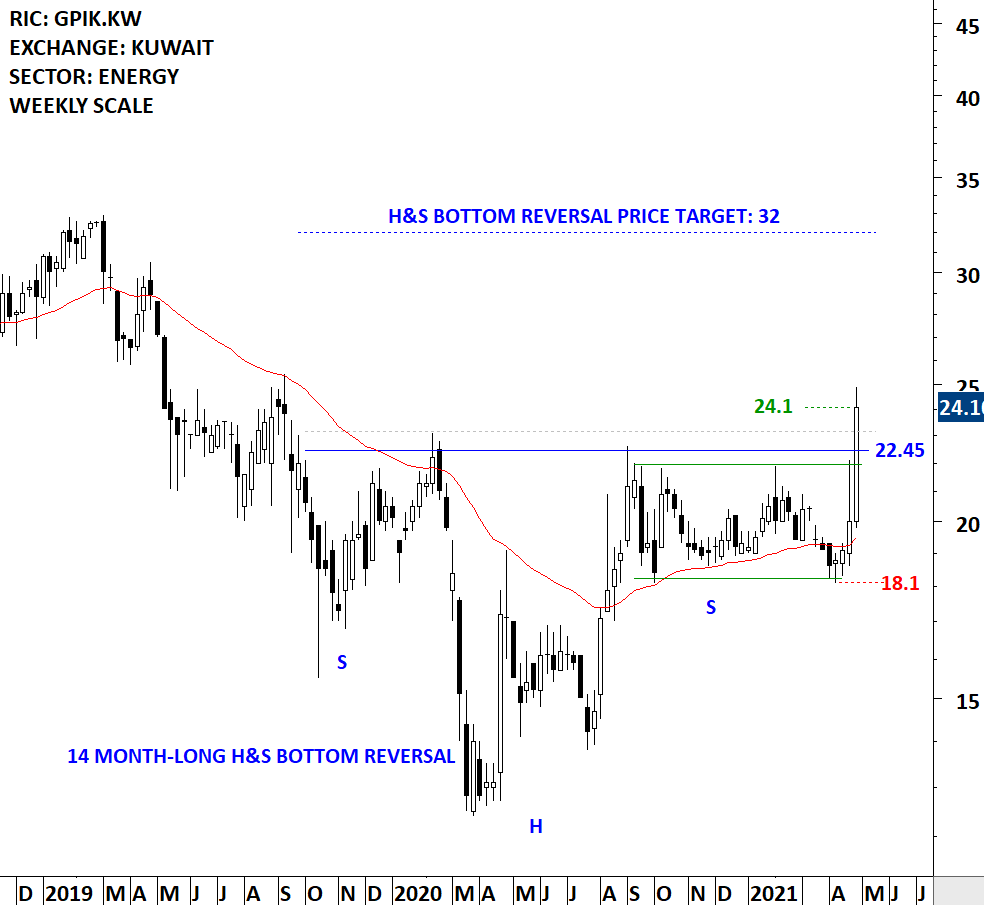
Gulf Petroleum Investment Company KSCP (GPI) is a Kuwait-based Sharia-compliant public shareholding company that operates in the oil, gas and petrochemical sectors. The Company’s main activities include the provision of consulting, financial, technical and specialized services to governments and oil and petrochemical companies in the fields of marketing, refining, production, investment, financial, planning, overseas transportation, organizing, training and other fields related to oil and petrochemicals. The stock is listed on the Kuwait Stock Exchange. Price chart formed a 14 month-long head and shoulder bottom reversal with the horizontal boundary acting as strong resistance at 22.45 levels. The horizontal boundary was tested several times over the course of the chart pattern. The daily close above 23.15 levels confirmed the breakout from the 14 month-long head and shoulder bottom reversal with the possible chart pattern price target of 32.00 levels. The right shoulder can be analyzed as a possible rectangle chart pattern.
ST MODWEN PROPERTIES PLC (SMP.L)
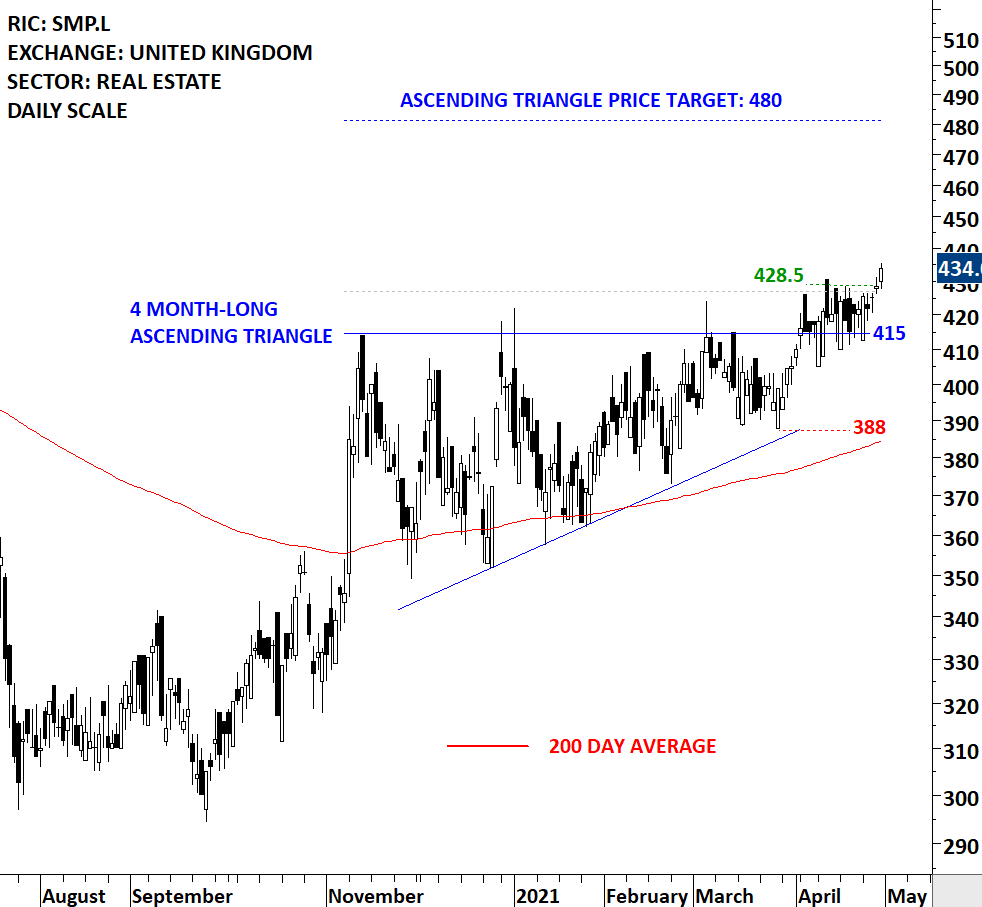
St. Modwen Properties PLC is a United Kingdom-based developer and regeneration specialist. The stock is listed on the London Stock Exchange. Price chart formed a 4 month-long ascending triangle with the horizontal boundary acting as strong resistance at 415.00 levels. The horizontal boundary was tested several times over the course of the chart pattern. The daily close above 427.00 levels confirmed the breakout from the 4 month-long ascending triangle with the possible chart pattern price target of 480.00 levels.
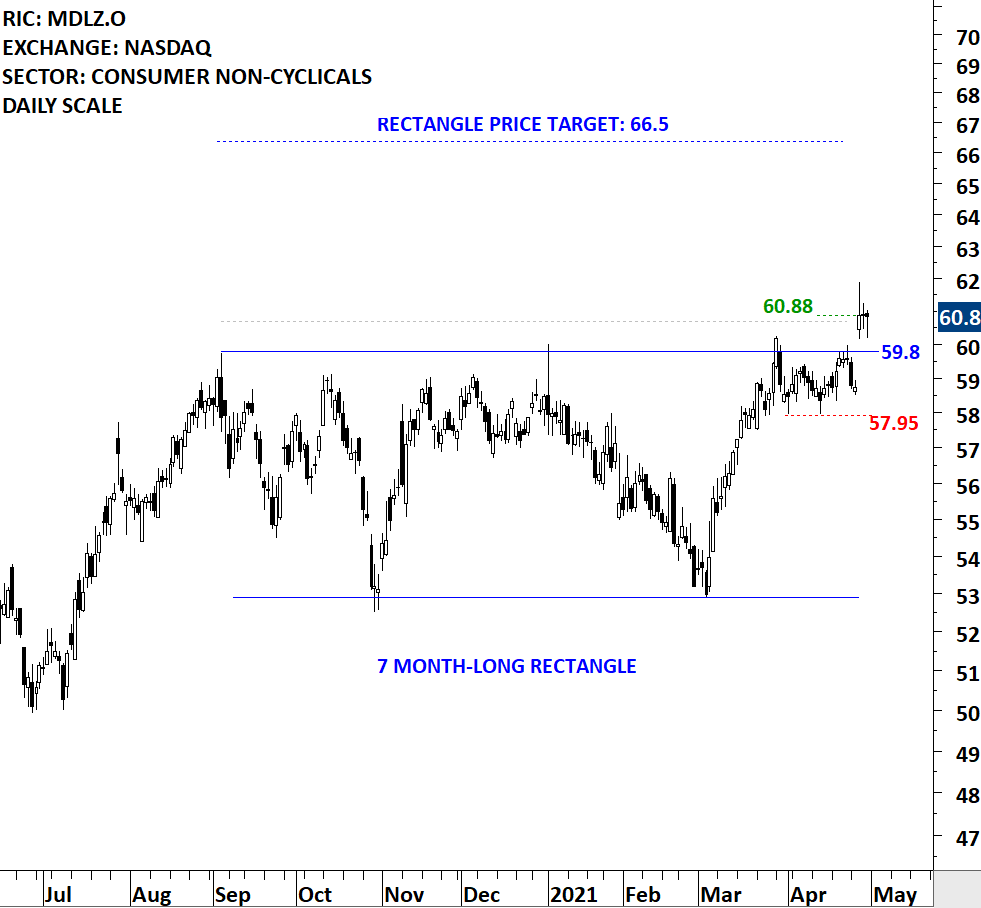
MONDELEZ INTERNATIONAL INC (MDLZ.O)
Mondelez International, Inc. is a snack company. The Company manufactures and markets snack food and beverage products for consumers. The stock is listed on the Nasdaq Stock Exchange. Price chart formed a 7 month-long rectangle with the horizontal boundary acting as strong resistance at 59.80 levels. The horizontal boundary was tested several times over the course of the chart pattern. The daily close above 60.70 levels confirmed the breakout from the 7 month-long rectangle with the possible chart pattern price target of 66.50 levels.
CLEAR CHANNEL OUTDOOR HOLDINGS INC (CCO)
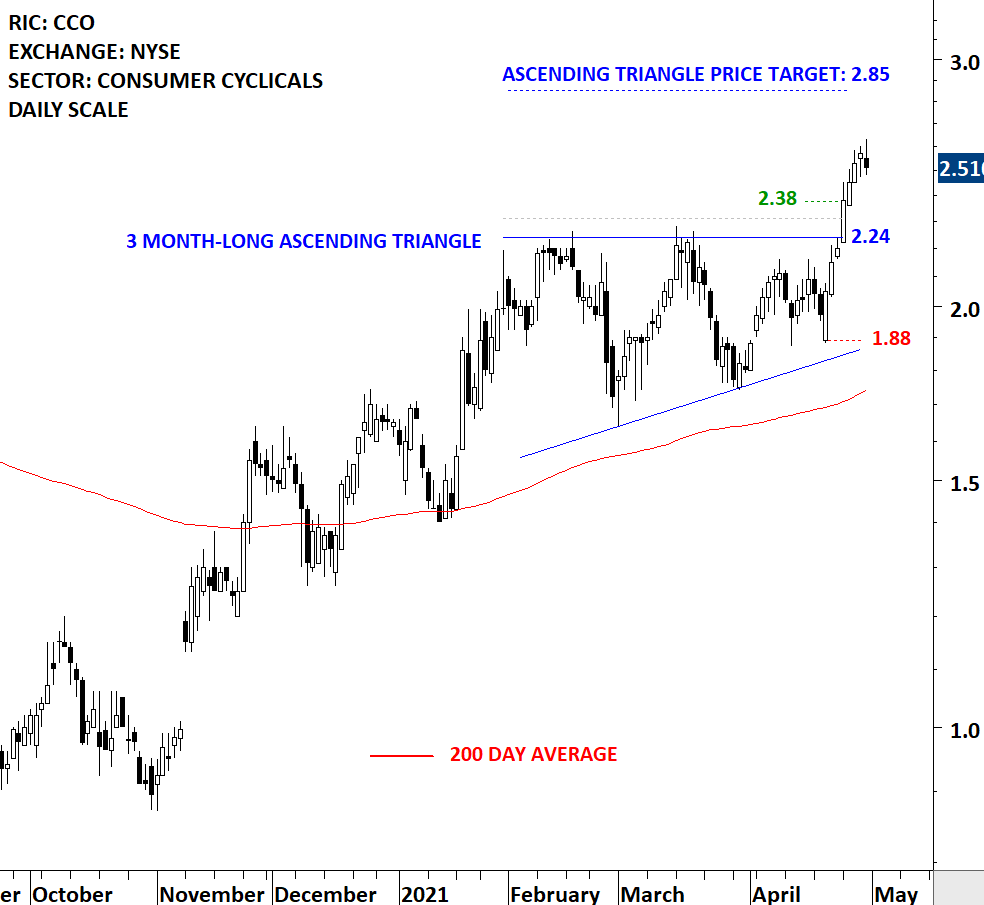
Clear Channel Outdoor Holdings, Inc., formerly Clear Channel Holdings, Inc., is an outdoor advertising company. The Company is engaged in providing clients with advertising through billboards, street furniture displays, transit displays and other out-of-home advertising displays. The stock is listed on the New York Stock Exchange. Price chart formed a 3 month-long ascending triangle with the horizontal boundary acting as strong resistance at 2.24 levels. The horizontal boundary was tested several times over the course of the chart pattern. The daily close above 2.31 levels confirmed the breakout from the 3 month-long ascending triangle with the possible chart pattern price target of 2.85 levels.
ARCOS DORADOS HOLDINGS INC (ARCO.K)
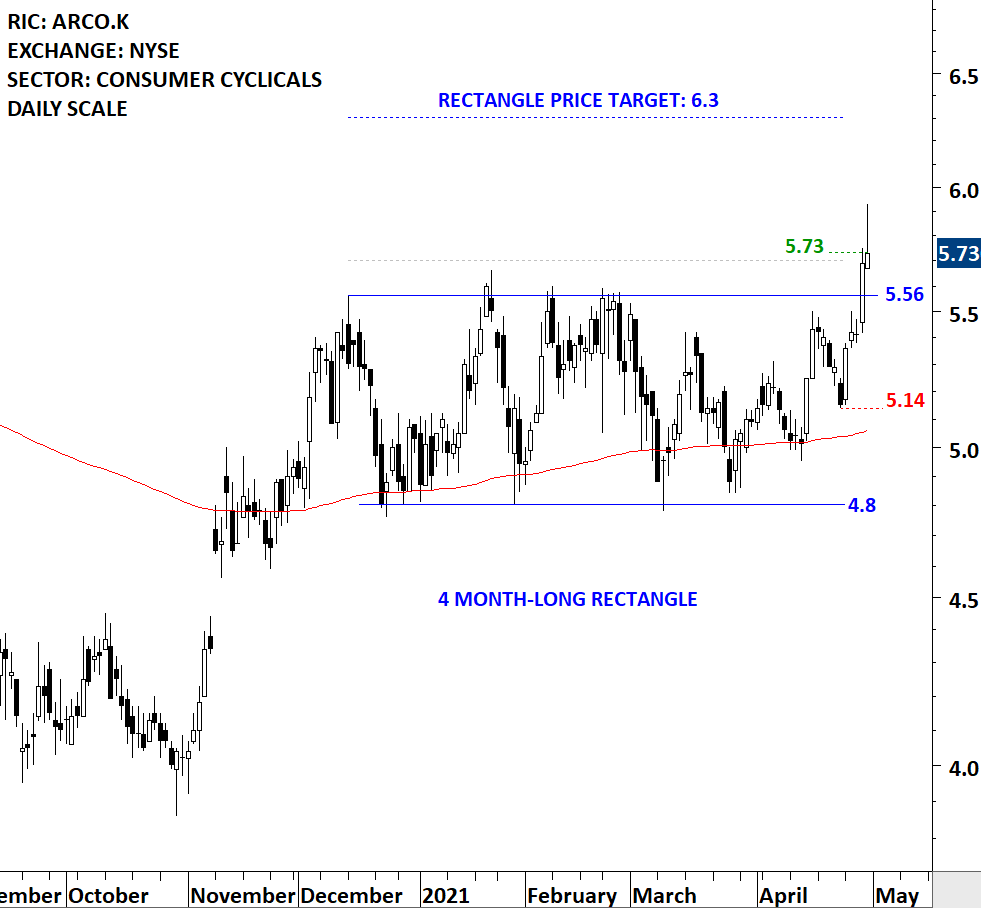
Arcos Dorados Holdings Inc. is a McDonald’s franchisee. The Company operates or franchises over 2,140 McDonald’s-branded restaurants. The stock is listed on the New York Stock Exchange. Price chart formed a 4 month-long rectangle with the horizontal boundary acting as strong resistance at 5.56 levels. The horizontal boundary was tested several times over the course of the chart pattern. The daily close above 5.70 levels confirmed the breakout from the 4 month-long rectangle with the possible chart pattern price target of 6.30 levels.
HEICO CORP (HEIa)
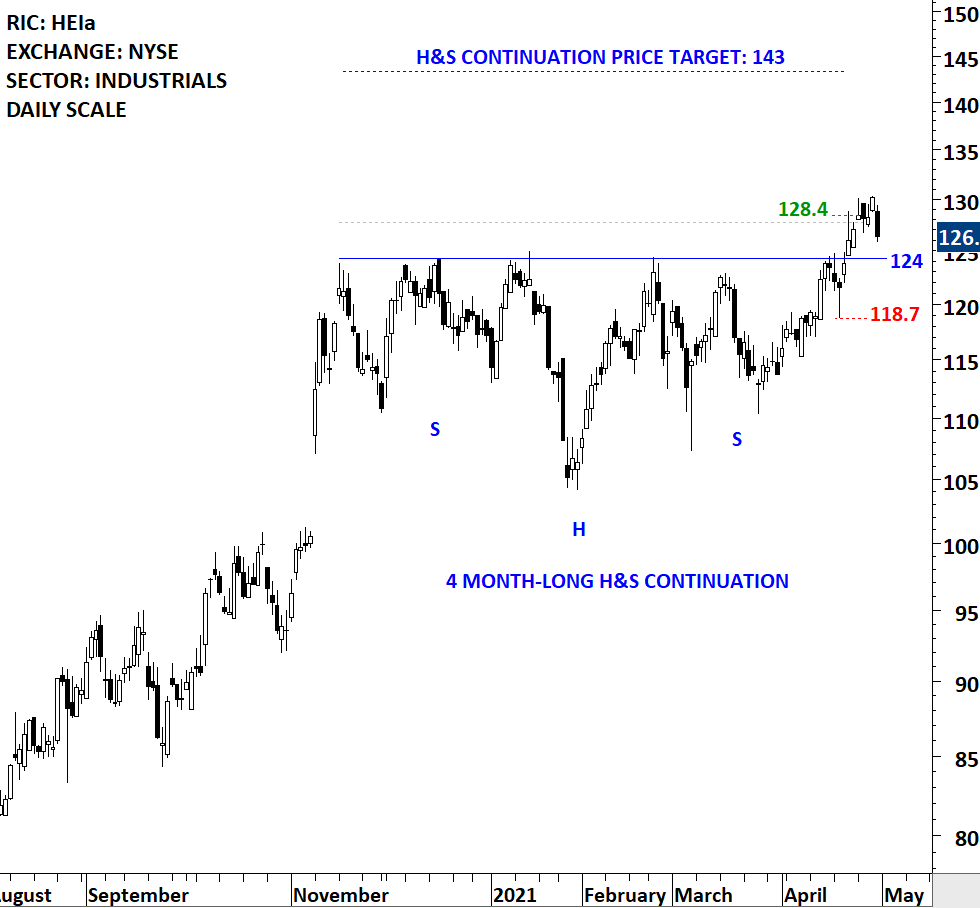
HEICO Corporation is a manufacturer of jet engine and aircraft component replacement parts. The Company also manufactures various types of electronic equipment for the aviation, defense, space, industrial, medical, telecommunications and electronics industries. The stock is listed on the New York Stock Exchange. Price chart formed a 4 month-long head and shoulder continuation with the horizontal boundary acting as strong resistance at 124.00 levels. The horizontal boundary was tested several times over the course of the chart pattern. The daily close above 127.70 levels confirmed the breakout from the 4 month-long head and shoulder continuation with the possible chart pattern price target of 143.00 levels.
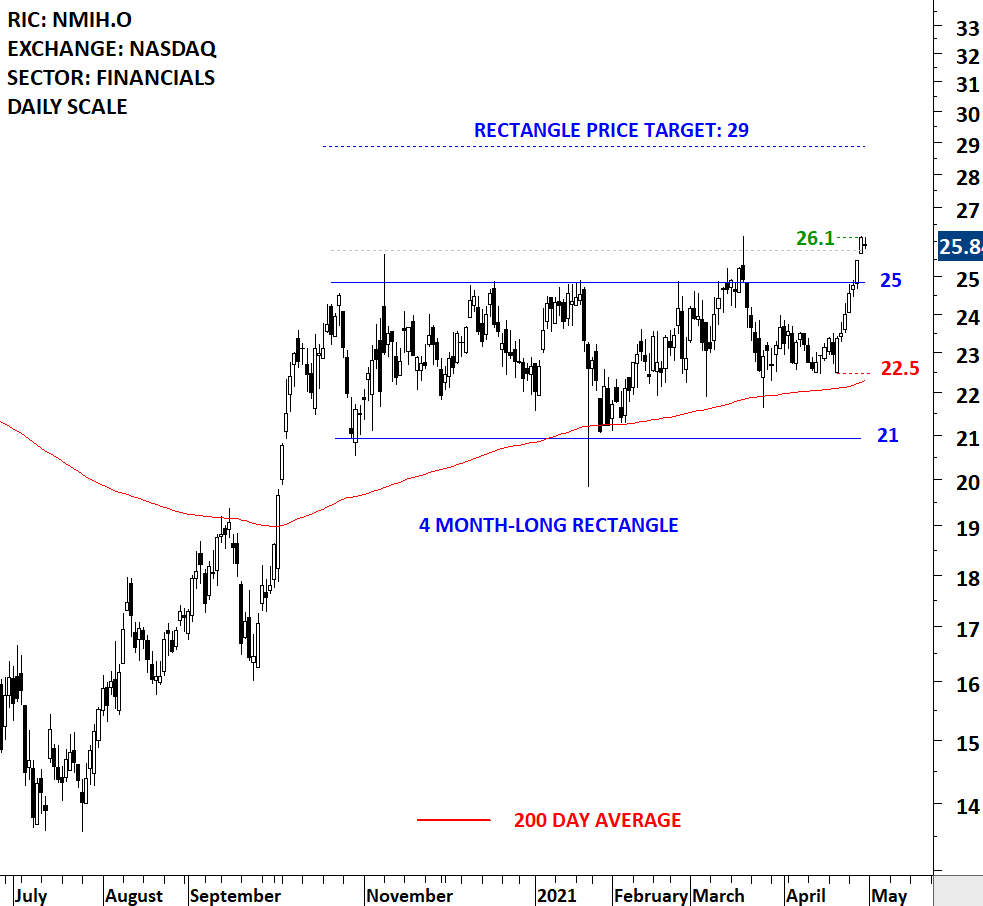
NMI HOLDINGS INC (NMIH.O)
NMI Holdings, Inc. (NMIH) provides private mortgage guaranty insurance through its insurance subsidiaries. The Company’s primary insurance subsidiary, National Mortgage Insurance Corporation (NMIC), is a mortgage insurance (MI) provider on loans purchased by the Government-sponsored enterprises (GSEs). Its reinsurance subsidiary, National Mortgage Reinsurance Inc One (Re One), provides reinsurance to NMIC on certain loans insured by NMIC. NMIH’s subsidiary, NMI Services, Inc. (NMIS), provides outsourced loan review services to mortgage loan originators. The stock is listed on the Nasdaq Stock Exchange. Price chart formed a 4 month-long rectangle with the horizontal boundary acting as strong resistance at 25.00 levels. The horizontal boundary was tested several times over the course of the chart pattern. The daily close above 25.75 levels confirmed the breakout from the 4 month-long rectangle with the possible chart pattern price target of 29.00 levels.
There are 14 additions to Tech Charts watchlist.
TECH CHARTS WATCHLIST
AMERICAS
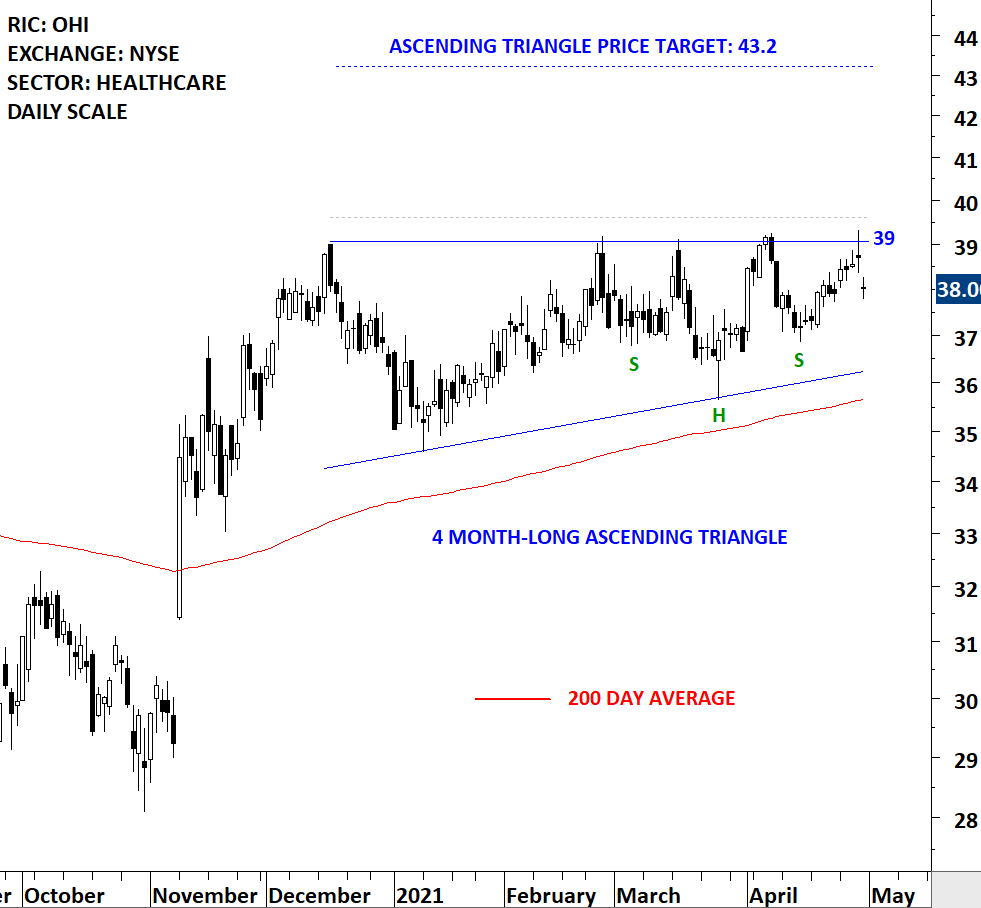
OMEGA HEALTHCARE INVESTORS INC (OHI) – new addition to watchlist
Omega Healthcare Investors, Inc. is a self-administered real estate investment trust (REIT). The Company maintains a portfolio of long-term healthcare facilities and mortgages on healthcare facilities located in the United States and the United Kingdom (U.K.). The stock is listed on the New York Stock Exchange. Price chart formed a 4 month-long ascending triangle with the horizontal boundary acting as strong resistance at 39.00 levels. The horizontal boundary was tested several times over the course of the chart pattern. A daily close above 39.60 levels will confirm the breakout from the 4 month-long ascending triangle with the possible chart pattern price target of 43.20 levels. Inside the ascending triangle another H&S continuation chart pattern can be identified. Breakout can take place at the same price level.
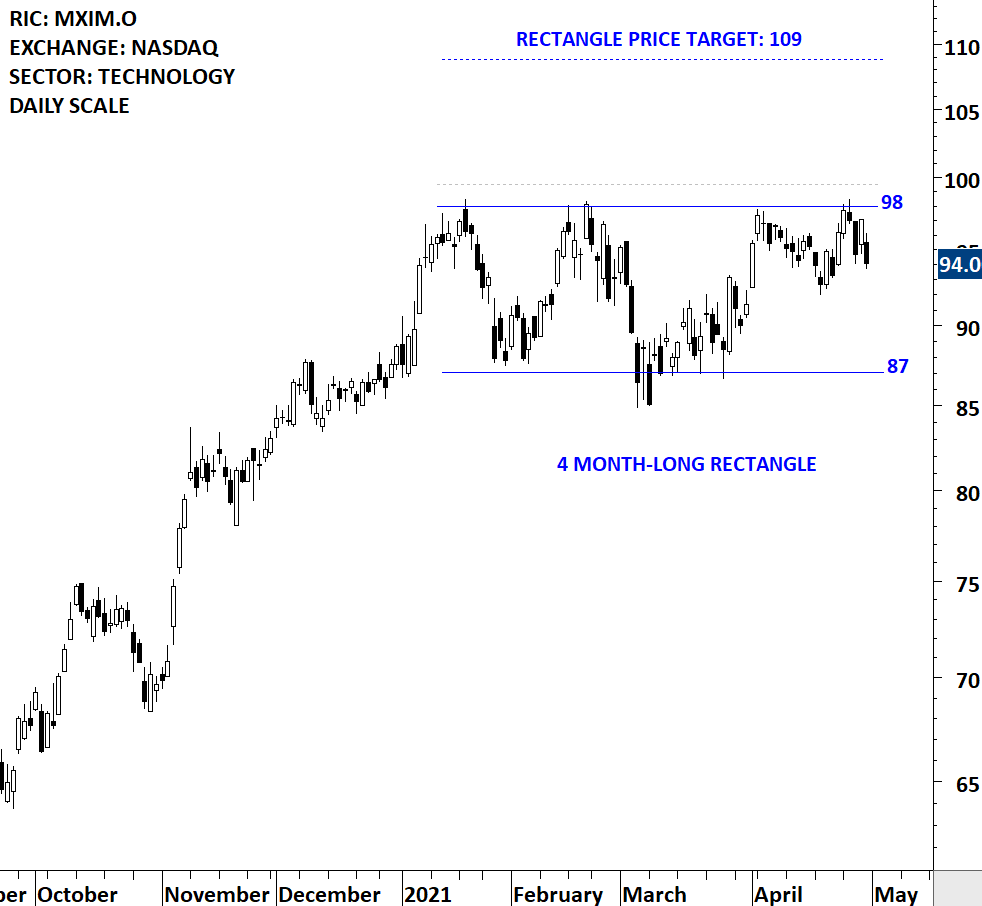
MAXIM INTEGRATED PRODUCTS INC (MXIM.O) – new addition to watchlist
Maxim Integrated Products, Inc. is engaged in designing, developing, manufacturing and marketing a range of linear and mixed-signal integrated circuits, referred to as analog circuits. The Company also provides a range of high-frequency process technologies and capabilities for use in custom designs. The stock is listed on the Nasdaq Stock Exchange. Price chart formed a 4 month-long rectangle with the horizontal boundary acting as strong resistance at 98.00 levels. The horizontal boundary was tested several times over the course of the chart pattern. A daily close above 99.50 levels will confirm the breakout from the 4 month-long rectangle with the possible chart pattern price target of 109.00 levels.
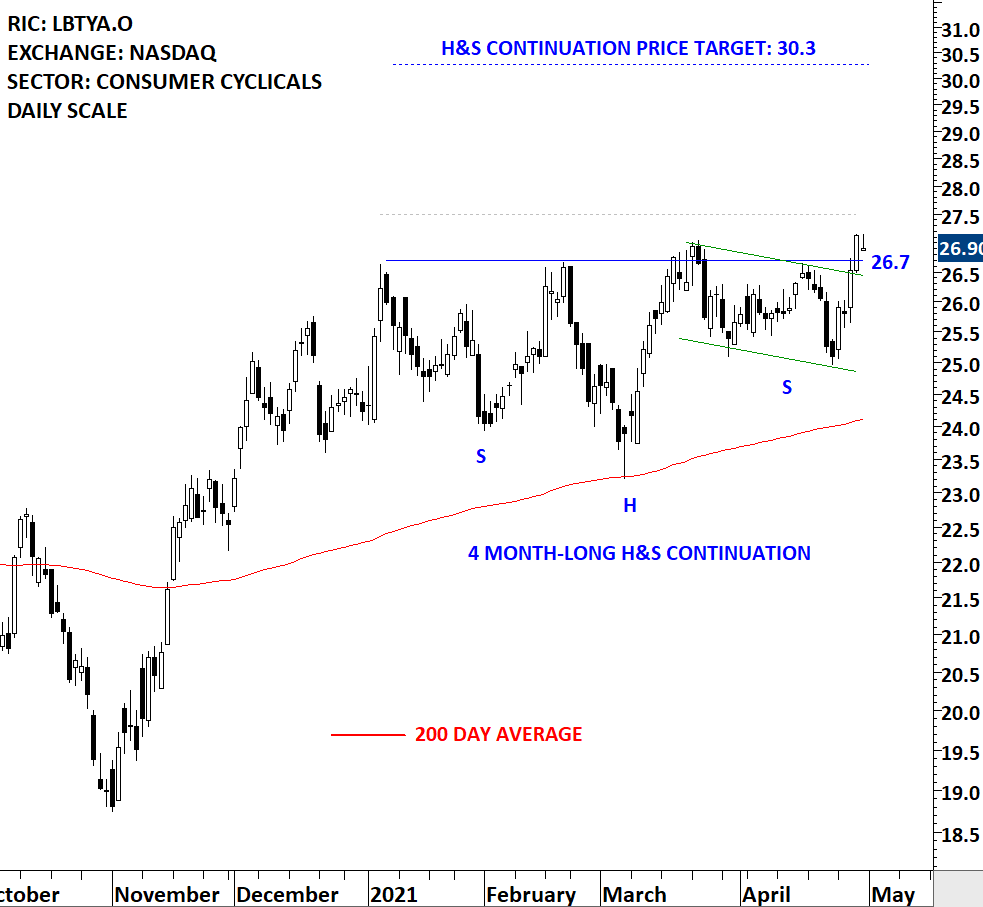
LIBERTY GLOBAL PLC (LBTYA.O) – new addition to watchlist
Liberty Global plc (Liberty Global) is a provider of broadband Internet, video, fixed-line telephony and mobile communications services to residential customers and businesses in Europe. The Company operates through the United Kingdom/Ireland, Belgium, Switzerland, and Central and Eastern Europe segments. The stock is listed on the Nasdaq Stock Exchange. Price chart formed a 4 month-long head and shoulder continuation with the horizontal boundary acting as strong resistance at 26.70 levels. The horizontal boundary was tested several times over the course of the chart pattern. A daily close above 27.50 levels will confirm the breakout from the 4 month-long head and shoulder continuation with the possible chart pattern price target of 30.30 levels.
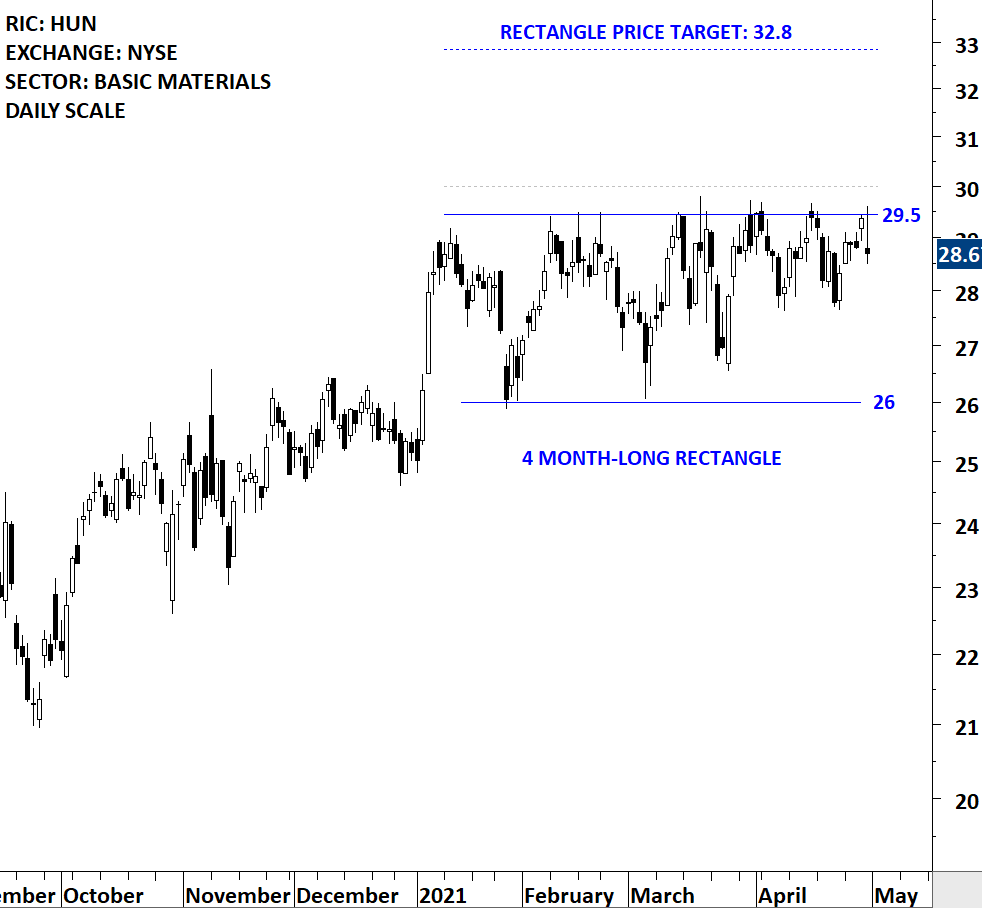
HUNTSMAN CORP (HUN) – new addition to watchlist
Huntsman Corporation is a manufacturer of differentiated organic chemical products and of inorganic chemical products. The Company operates all of its businesses through its subsidiary, Huntsman International LLC (Huntsman International). The Company operates through four segments: Polyurethanes, Performance Products, Advanced Materials and Textile Effects. The stock is listed on the New York Stock Exchange. Price chart formed a 4 month-long rectangle with the horizontal boundary acting as strong resistance at 29.50 levels. The horizontal boundary was tested several times over the course of the chart pattern. A daily close above 30.00 levels will confirm the breakout from the 4 month-long rectangle with the possible chart pattern price target of 32.80 levels.
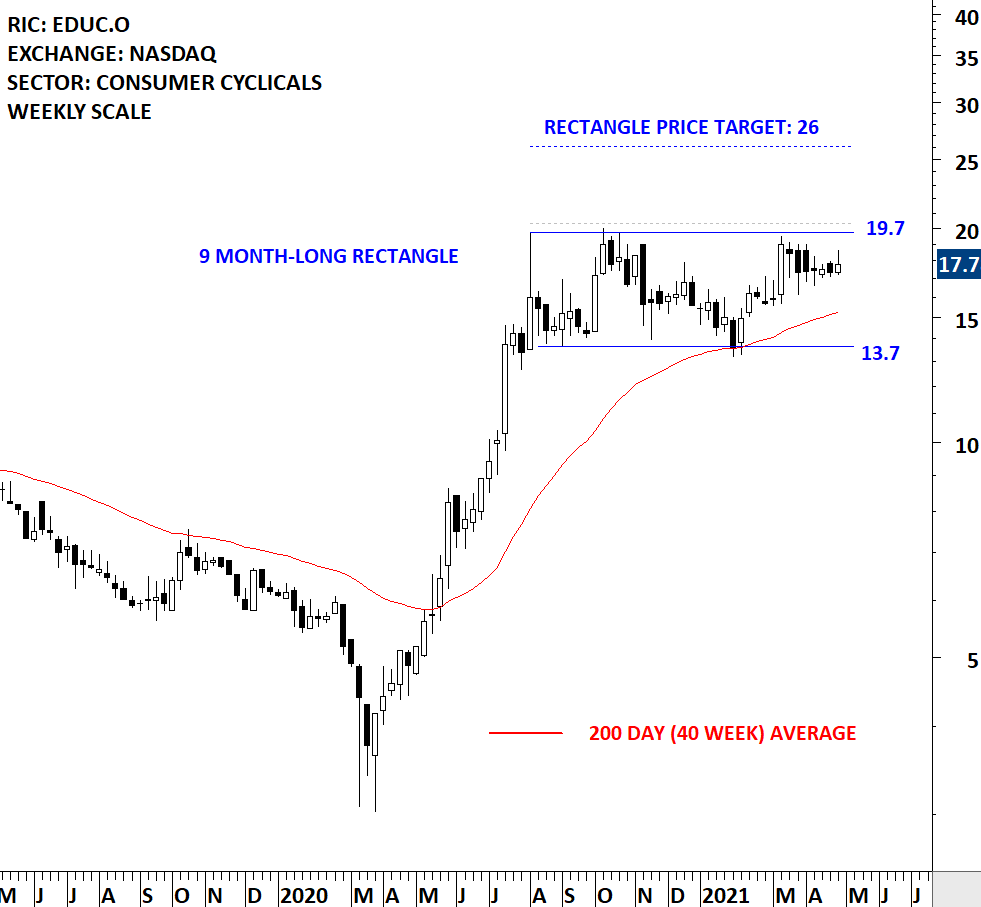
EDUCATIONAL DEVELOPMENT CORP (EDUC.O) – new addition to watchlist
Educational Development Corporation (EDC) is a publisher of the line of educational children’s books produced in the United Kingdom by Usborne Publishing Limited (Usborne). The Company also owns Kane Miller Book Publishers. The Company sells books through two segments: Home Business Division (Usborne Books & More or UBAM) and Publishing Division (EDC Publishing). The stock is listed on the Nasdaq Stock Exchange. Price chart formed a 9 month-long rectangle with the horizontal boundary acting as strong resistance at 19.70 levels. The horizontal boundary was tested several times over the course of the chart pattern. A daily close above 20.30 levels will confirm the breakout from the 9 month-long rectangle with the possible chart pattern price target of 26.00 levels.
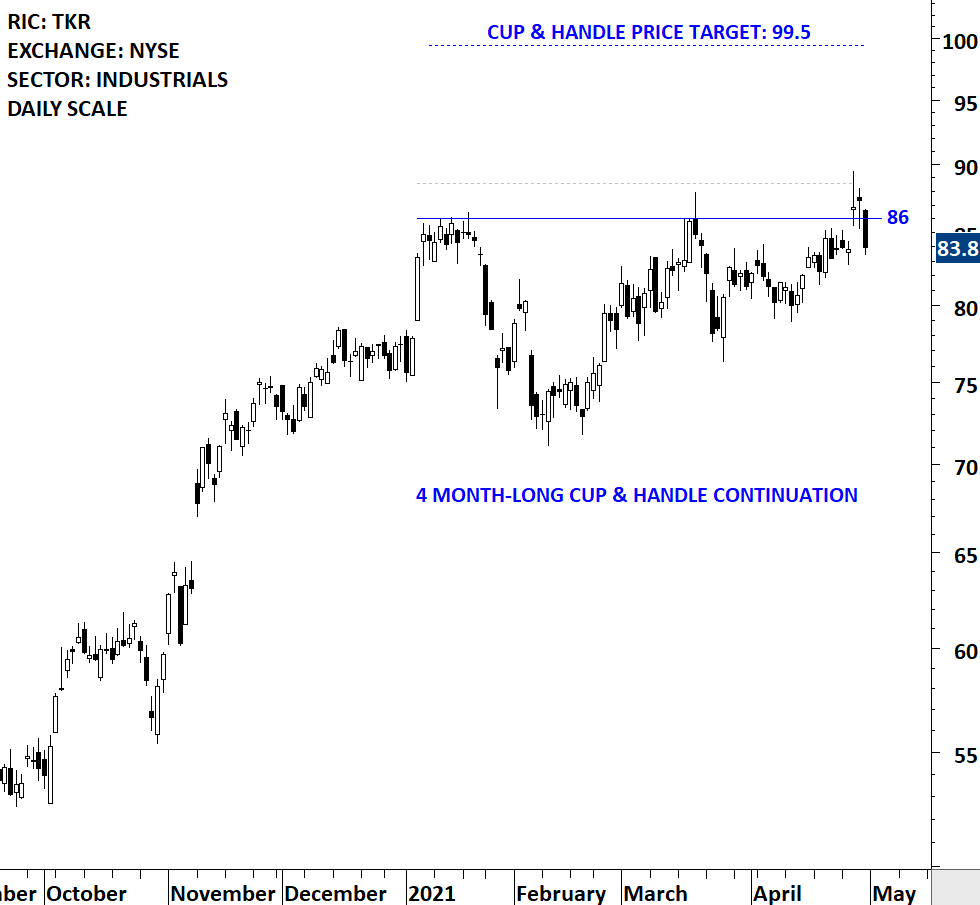
TIMKEN CO (TKR)
The Timken Company offers a portfolio of engineered bearings and power transmission products. The Timken bearing portfolio features a broad range of engineered bearing products, including tapered, spherical and cylindrical roller bearings; thrust and ball bearings; and housed units. The stock is listed on the New York Stock Exchange. Price chart formed a 4 month-long cup & handle continuation with the horizontal boundary acting as strong resistance at 86.00 levels. The horizontal boundary was tested several times over the course of the chart pattern. A daily close above 88.60 levels will confirm the breakout from the 4 month-long cup & handle continuation with the possible chart pattern price target of 99.50 levels. Breakout can push the stock to all-time highs.
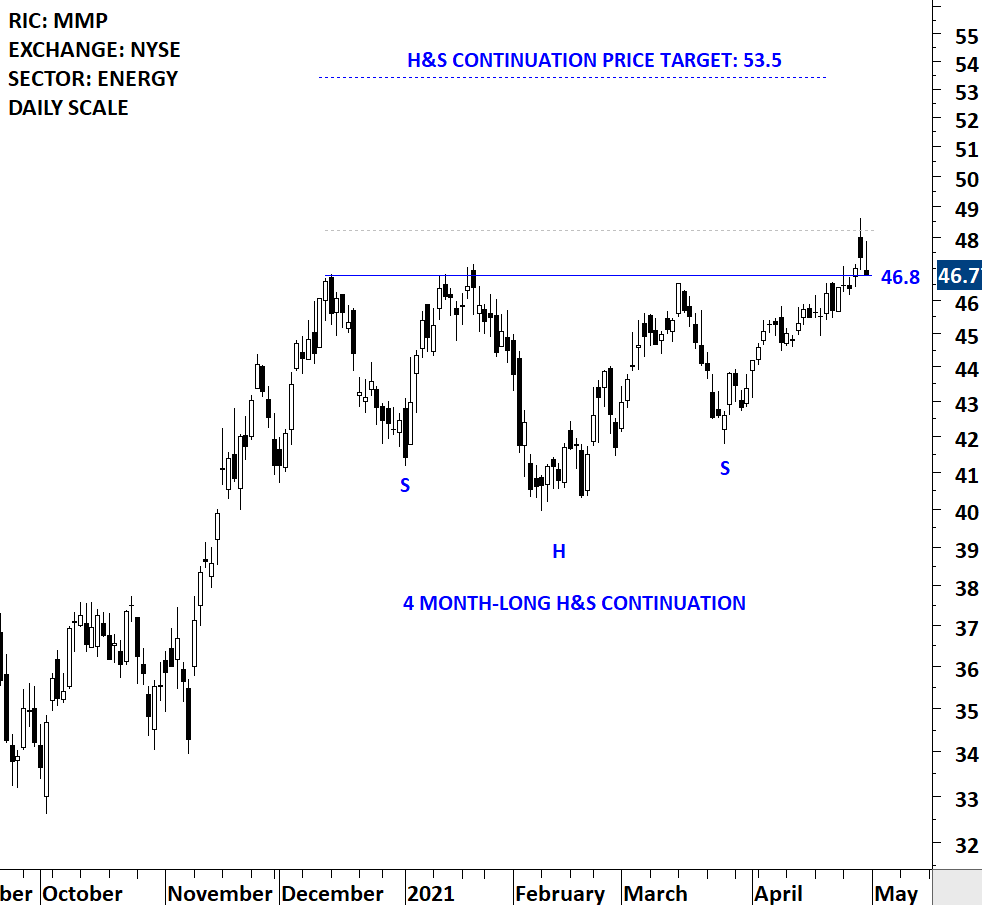
MAGELLAN MIDSTREAM PARTNERS LP (MMP)
Magellan Midstream Partners, L.P. is principally engaged in the transportation, storage and distribution of refined petroleum products and crude oil. The stock is listed on the New York Stock Exchange. Price chart formed a 4 month-long head and shoulder continuation with the horizontal boundary acting as strong resistance at 46.80 levels. The horizontal boundary was tested several times over the course of the chart pattern. A daily close above 48.20 levels will confirm the breakout from the 4 month-long head and shoulder continuation with the possible chart pattern price target of 53.50 levels.
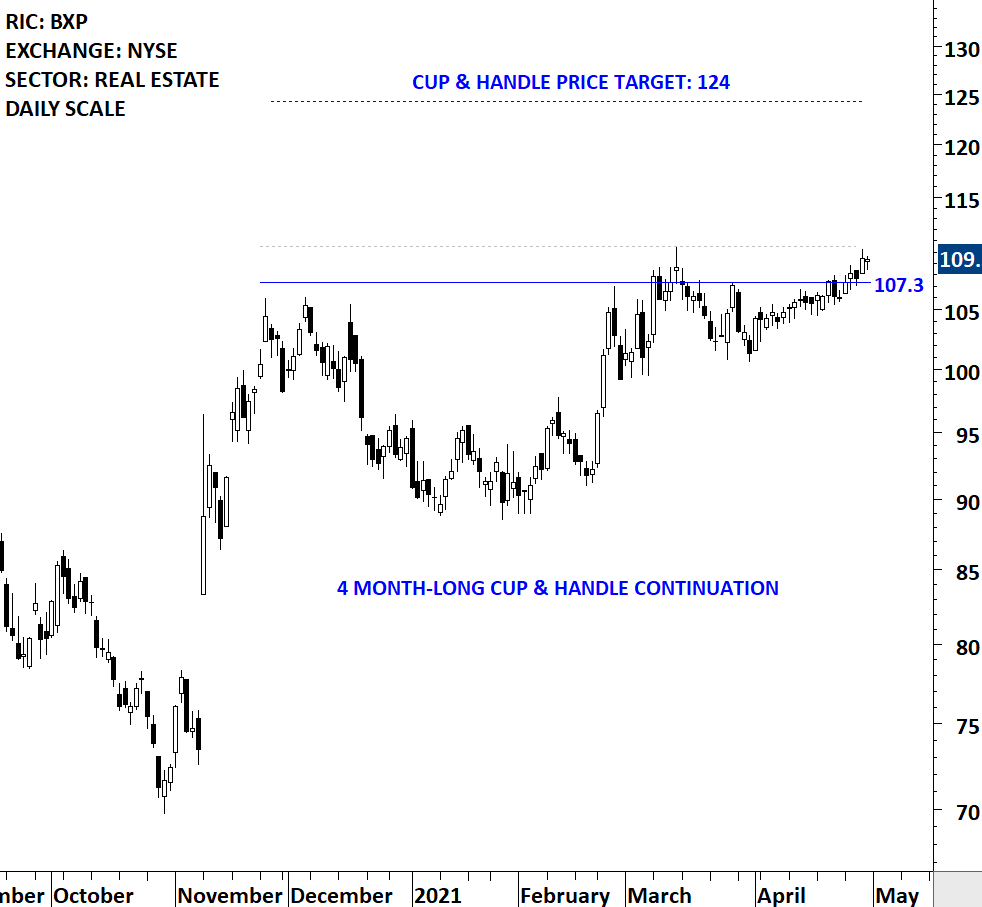
BOSTON PROPERTIES INC (BXP)
Boston Properties, Inc. is a real estate investment trust. The Company is an owner and developer of office properties in the United States. Its segments by geographic area are Boston, New York, San Francisco and Washington, DC. The stock is listed on the New York Stock Exchange. Price chart formed a 4 month-long cup & handle continuation with the horizontal boundary acting as strong resistance at 107.30 levels. The horizontal boundary was tested several times over the course of the chart pattern. A daily close above 110.50 levels will confirm the breakout from the 4 month-long cup & handle continuation with the possible chart pattern price target of 124.00 levels.
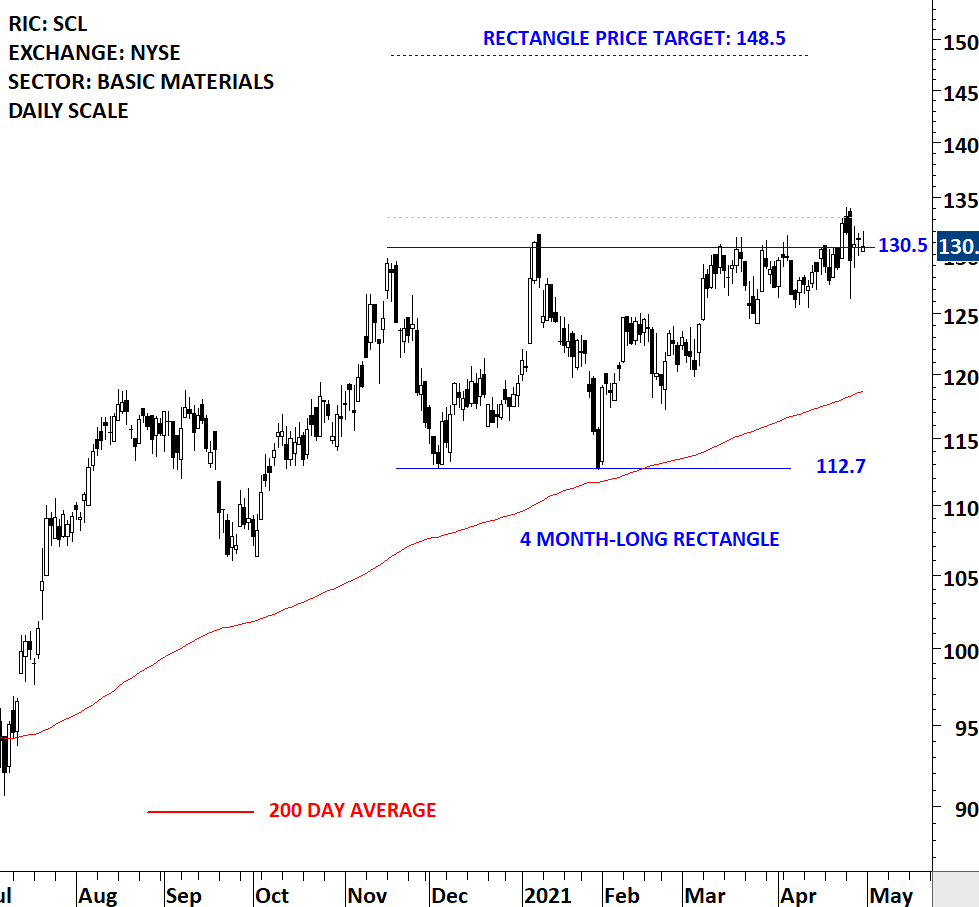
STEPAN CO (SCL)
Stepan Company produces specialty and intermediate chemicals. It operates through three segments: Surfactants, Polymers and Specialty Products. The stock is listed on the New York Stock Exchange. Price chart formed a 4 month-long rectangle with the horizontal boundary acting as strong resistance at 130.50 levels. The horizontal boundary was tested several times over the course of the chart pattern. A daily close above 133.20 levels will confirm the breakout from the 4 month-long rectangle with the possible chart pattern price target of 148.50 levels. Breakout can push the stock to all-time highs. This week’s price action was a borderline breakout. I will monitor this name for another day of strength to confirm the breakout.
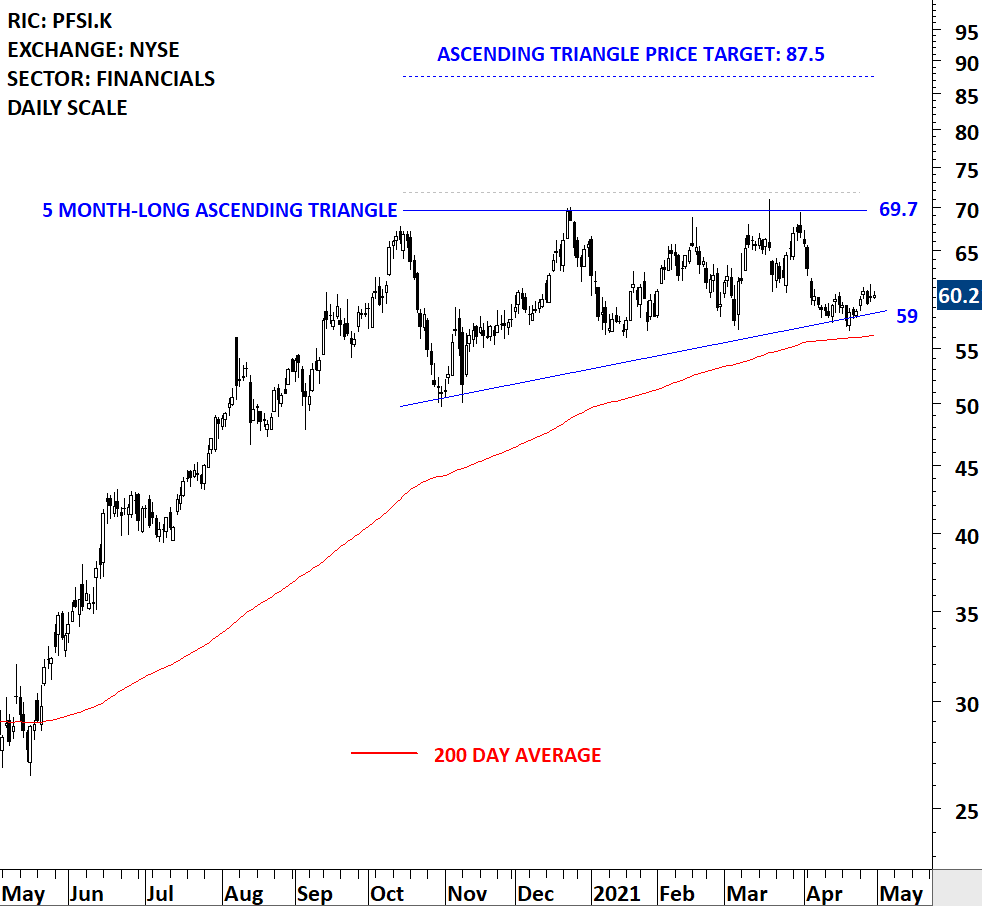
PENNYMAC FINANCIAL SERVICES INC (PFSI.K)
PennyMac Financial Services, Inc. is a specialty financial services firm. The Company conducts business in three segments: production, servicing (together, production and servicing comprise its mortgage banking activities) and investment management. The stock is listed on the New York Stock Exchange. Price chart formed a 5 month-long ascending triangle with the horizontal boundary acting as strong resistance at 69.70 levels. The horizontal boundary was tested several times over the course of the chart pattern. A daily close above 71.80 levels will confirm the breakout from the 5 month-long ascending triangle with the possible chart pattern price target of 87.50 levels. If the chart pattern in focus is an ascending triangle, this week’s low can mark a medium-term bottom.
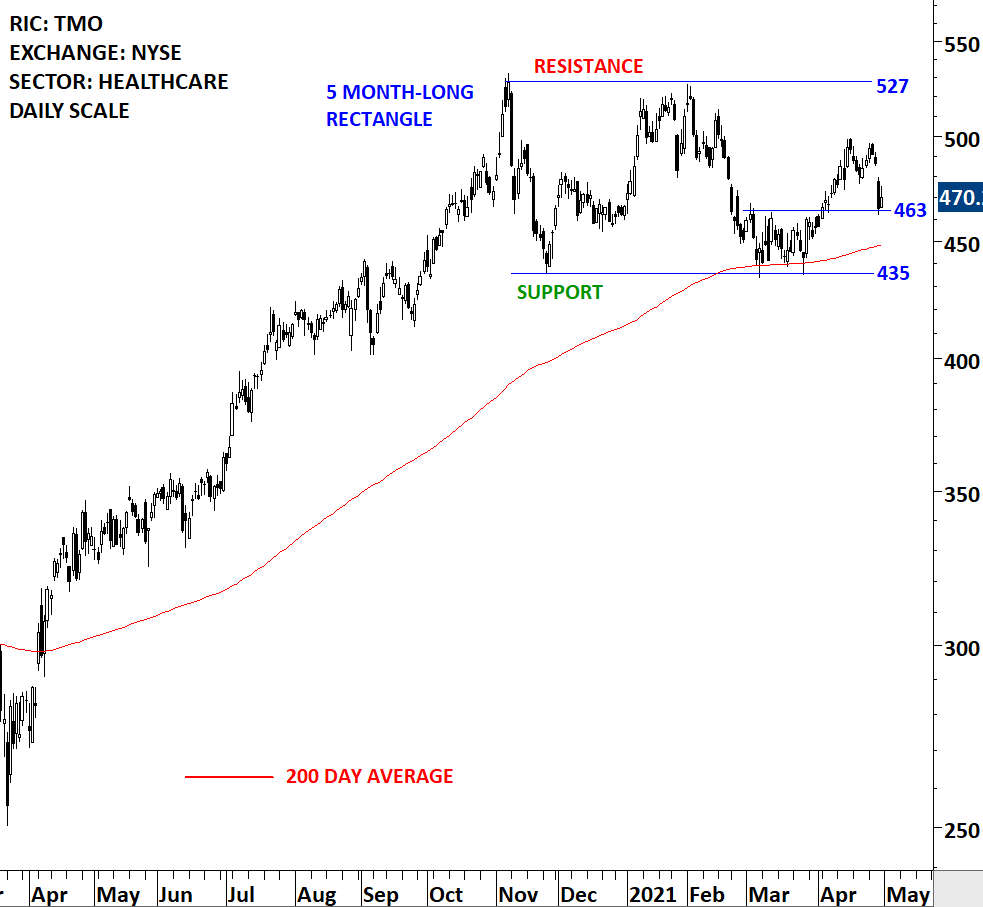
THERMO FISHER SCIENTIFIC INC (TMO)
Thermo Fisher Scientific Inc. develops, manufactures and sells a range of products. The Company operates through four segments: Life Sciences Solutions, Analytical Instruments, Specialty Diagnostics, and Laboratory Products and Services. It offers its products and services through various brands, including Thermo Scientific, Applied Biosystems, Invitrogen, Fisher Scientific and Unity Lab Services. The stock is listed on the New York Stock Exchange. Price chart formed a 5 month-long rectangle with the horizontal boundary acting as support at 435 and resistance at 527 levels. Both boundaries were tested several times over the course of the chart pattern. Until there is a breakout in one direction the stock offers trading opportunity between boundaries. The stock completed a short-term bottom reversal at the lower boundary and the 200-day average. Breakout above 463 levels confirmed the short-term bottom reversal. 463 is now acting as a short-term support. Price can test the upper boundary at 527 levels.
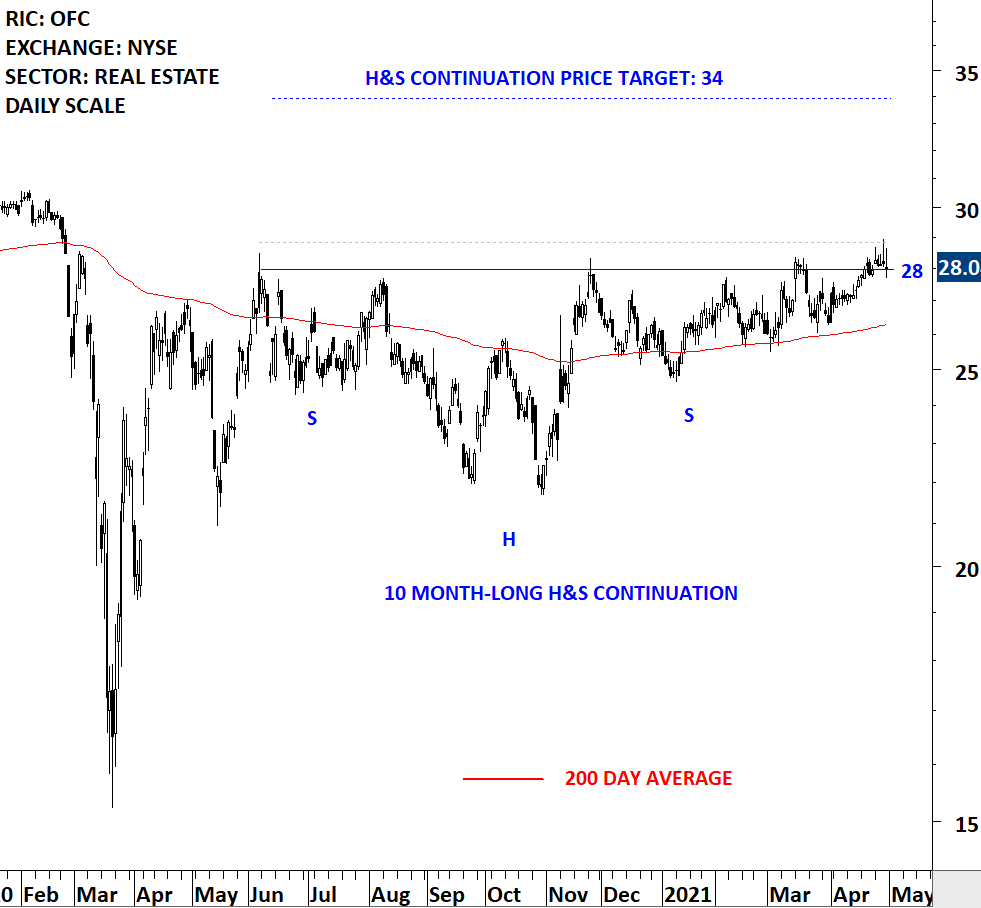
CORPORATE OFFICE PROPERTIES TRUST (OFC)
Corporate Office Properties Trust is a fully-integrated and self-managed real estate investment trust (REIT). The Company owns, manages, leases, develops and acquires office and data center properties. The stock is listed on the New York Stock Exchange. Price chart formed a 10 month-long head and shoulder continuation with the horizontal boundary acting as strong resistance at 28.00 levels. The horizontal boundary was tested several times over the course of the chart pattern. A daily close above 28.85 levels will confirm the breakout from the 10 month-long head and shoulder continuation with the possible chart pattern price target of 34.00 levels.
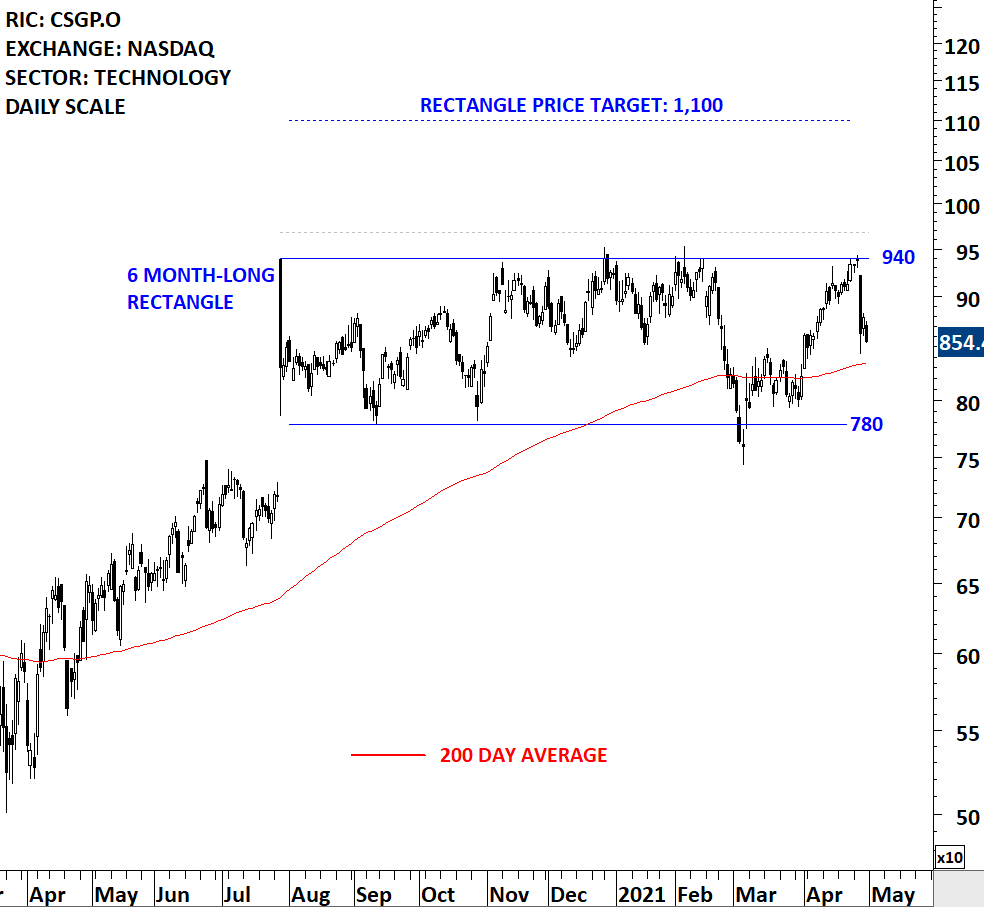
COSTAR GROUP INC (CSGP.O)
CoStar Group, Inc. (CoStar) is a provider of information, analytics and online marketplaces to the commercial real estate and related business community through its database of commercial real estate information covering the United States, the United Kingdom, and parts of Canada, Spain, Germany and France. The stock is listed on the Nasdaq Stock Exchange. Price chart formed a 6 month-long rectangle with the horizontal boundary acting as strong resistance at 940.00 levels. The horizontal boundary was tested several times over the course of the chart pattern. A daily close above 968.00 levels will confirm the breakout from the 6 month-long rectangle with the possible chart pattern price target of 1,100.00 levels. The stock is offering a trading opportunity between the boundaries at 780 (support) and 940 (resistance).
EUROPE
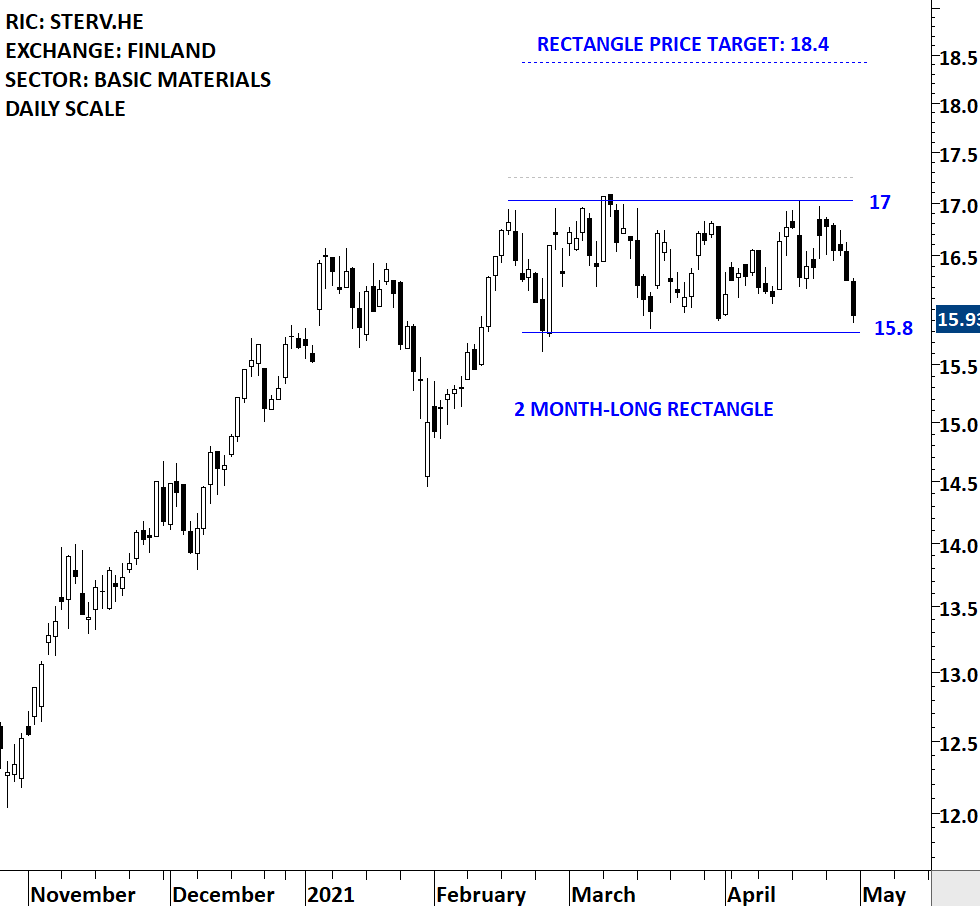
STORA ENSO OYJ (STERV.HE) – new addition to watchlist
Stora Enso Oyj is a provider of renewable solutions in packaging, biomaterials, wooden constructions and paper on global markets. The Company’s segments include Consumer Board, Packaging Solutions, Biomaterials, Wood Products, Paper and Other. The stock is listed on the Helsinki Stock Exchange. Price chart formed a 2 month-long rectangle with the upper boundary acting as strong resistance at 17.00 levels and the lower boundary as support at 15.8 levels. A daily close above 17.25 levels will confirm the breakout from the 2 month-long ascending triangle with the possible chart pattern price target of 18.40 levels. If the chart pattern in focus is a rectangle continuation, this week’s low could mark a medium-term bottom.
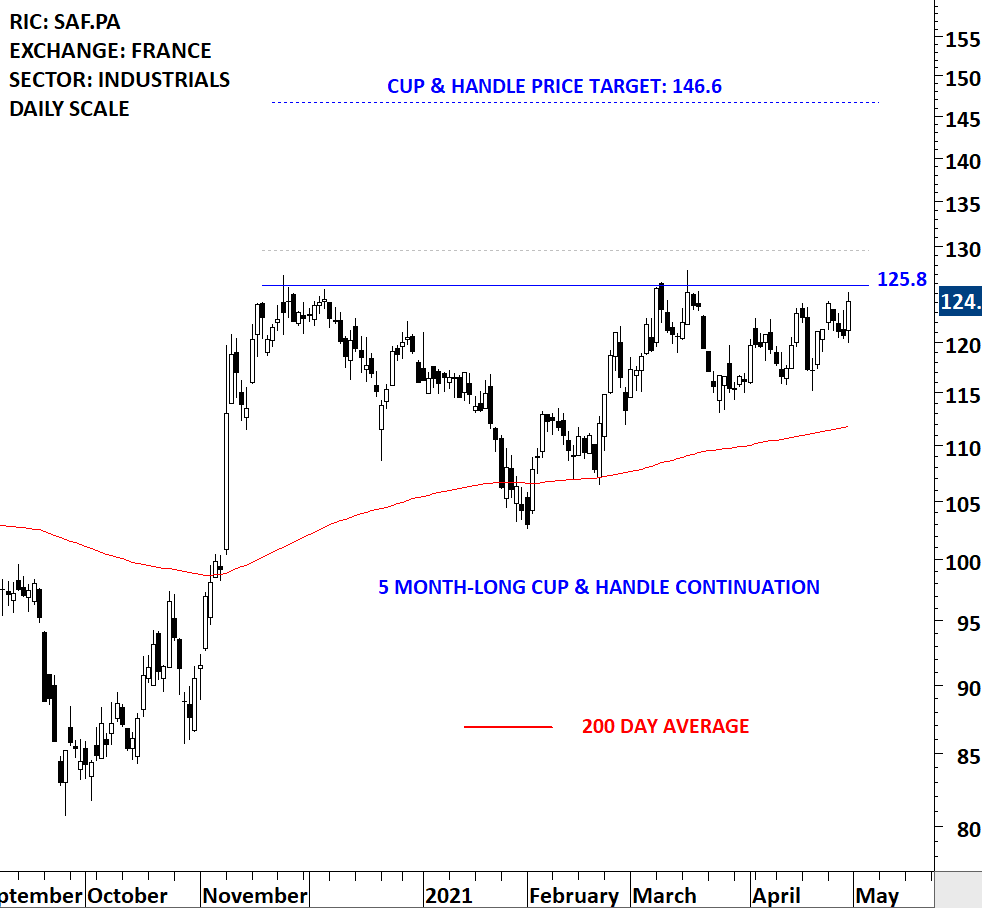
SAFRAN SA (SAF.PA) – new addition to watchlist
Safran SA is a France-based high-technology company that carries out research, design, development, testing, manufacturing, sales, maintenance, and support operations for its high-technology activities. The Company’s segments are: Aerospace Propulsion, Aircraft Equipment and Aircraft Interiors. The stock is listed on the Paris Stock Exchange. Price chart formed a 5 month-long cup & handle continuation with the horizontal boundary acting as strong resistance at 125.80 levels. The horizontal boundary was tested several times over the course of the chart pattern. A daily close above 129.60 levels will confirm the breakout from the 5 month-long cup & handle continuation with the possible chart pattern price target of 146.60 levels.
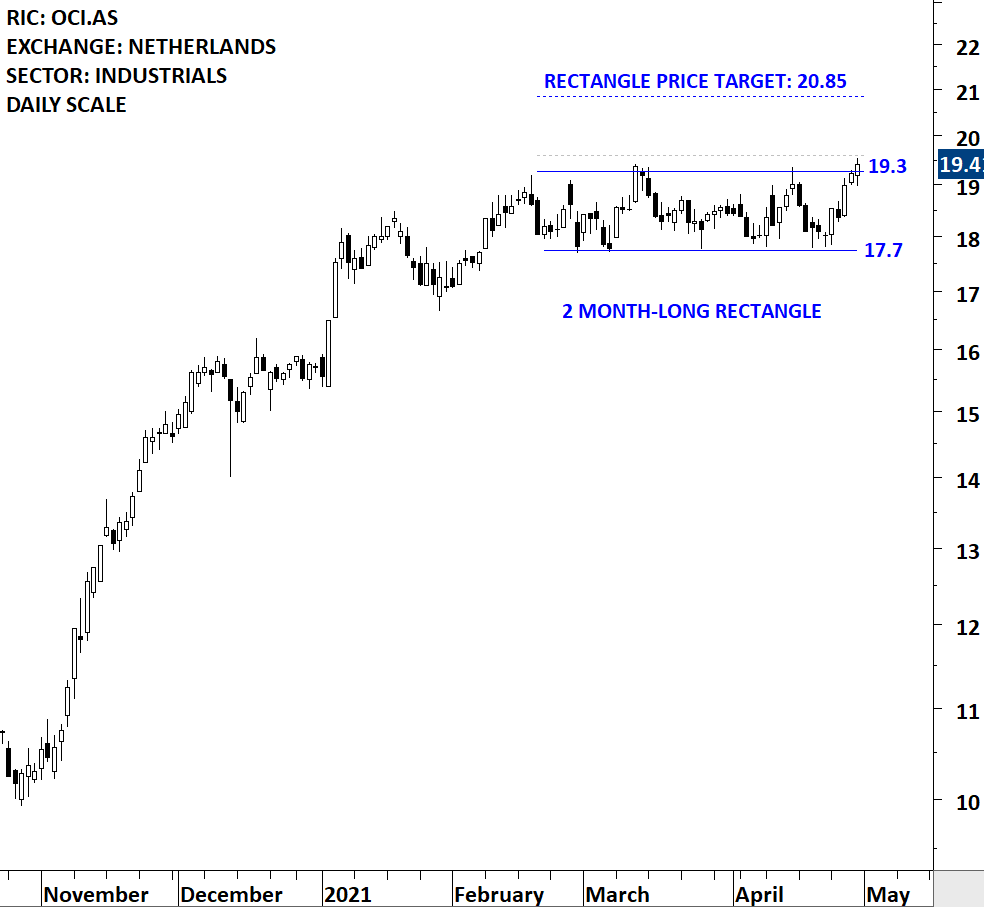
OCI NV (OCI.AS) – new addition to watchlist
OCI NV is a producer and distributor of natural gas-based fertilizers and industrial chemicals based in the Netherlands. The stock is listed on the Amsterdam Stock Exchange. Price chart formed a 2 month-long rectangle with the horizontal boundary acting as strong resistance at 19.30 levels. The horizontal boundary was tested several times over the course of the chart pattern. A daily close above 19.60 levels will confirm the breakout from the 2 month-long rectangle with the possible chart pattern price target of 20.85 levels.
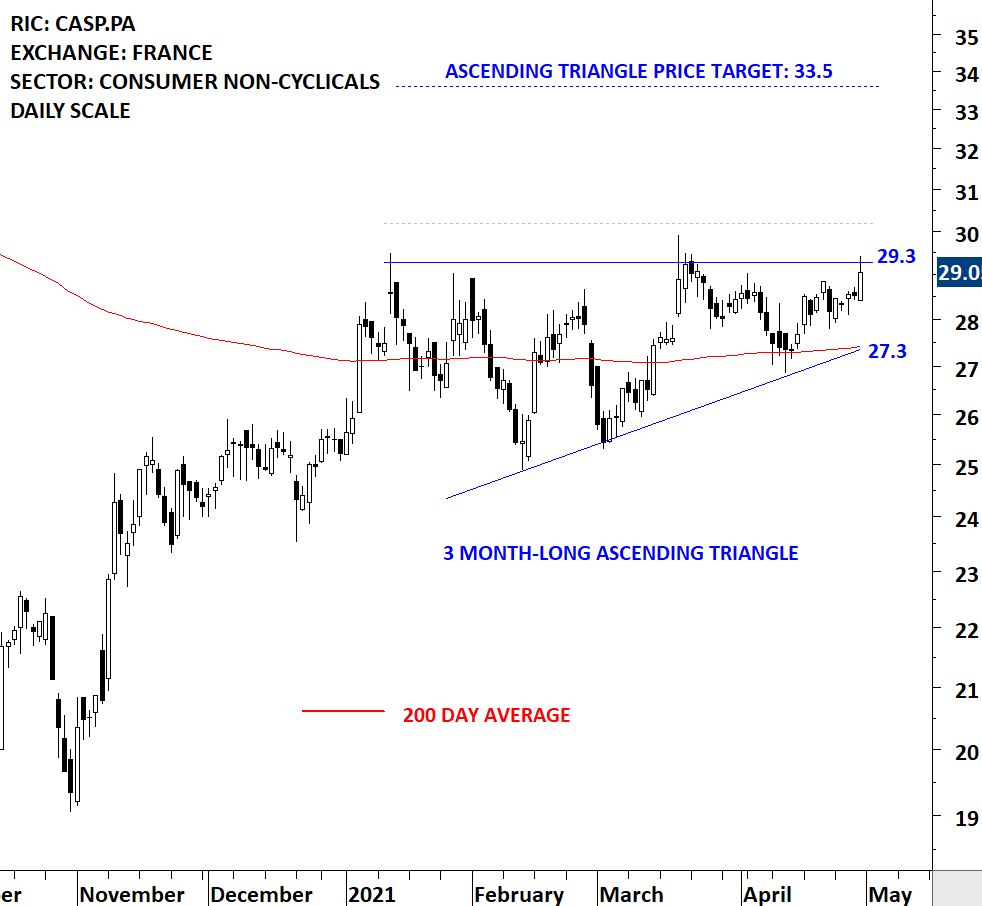
CASINO GUICHARD PERRACHON SA (CASP.PA) – new addition to watchlist
Casino Guichard Perrachon SA is a France-based food retailer company that manages stores in France and abroad. The Company operates across all food and non-food formats: hypermarkets, supermarkets, convenience stores, discount stores and wholesale stores. In France, the Company operates under diversified brands such as: hypermarkets, Casino Supermarkets, Monoprix, Franprix, Leader Price, Spar, Vival, Le Petit Casino, Casino Restauration. Abroad, the Company operates in South America particularly in Brazil and Columbia. The stock is listed on the Paris Stock Exchange. Price chart formed a 3 month-long ascending triangle with the horizontal boundary acting as strong resistance at 29.30 levels. The horizontal boundary was tested several times over the course of the chart pattern. A daily close above 30.18 levels will confirm the breakout from the 3 month-long ascending triangle with the possible chart pattern price target of 33.50 levels.
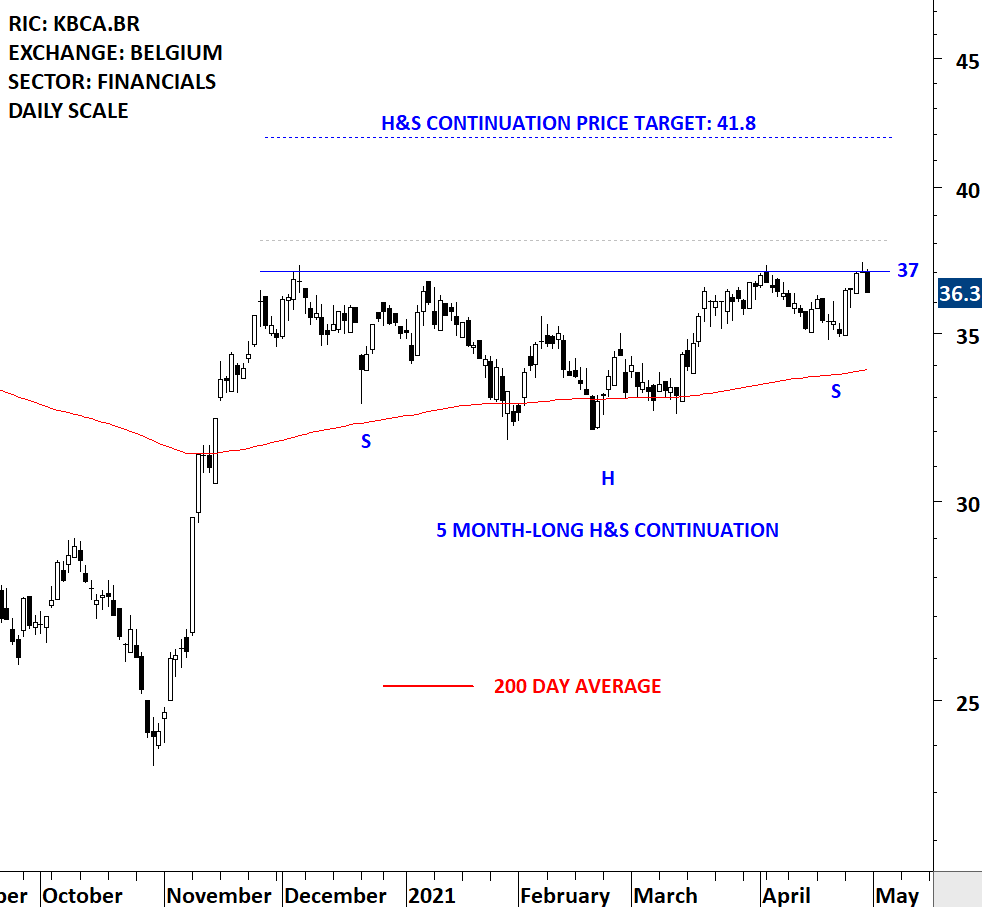
KBC ANCORA BV (KBCA.BR) – new addition to watchlist
KBC Ancora BV is a Belgium-based company, whose principal activity is the maintenance and management of its shareholding in KBC Group (the Group), as well as the shareholder stability, continuity and development of the KBC Group. The Company holds minority stake in KBC Group SA. The other shareholders of the Group include Cera and MRBB, among others. The Group is a Belgian company that specializes in retail banking, insurance and asset management activities, as well as the provision of services to businesses, principally in Belgium, Central and Eastern Europe. KBC Group is also active in private banking and services to businesses in other countries in Europe. KBC Ancora BV is managed by Almancora Societe de gestion. The stock is listed on the Brussels Stock Exchange. Price chart formed a 5 month-long head and shoulder continuation with the horizontal boundary acting as strong resistance at 37.00 levels. The horizontal boundary was tested several times over the course of the chart pattern. A daily close above 38.10 levels will confirm the breakout from the 5 month-long head and shoulder continuation with the possible chart pattern price target of 41.80 levels.
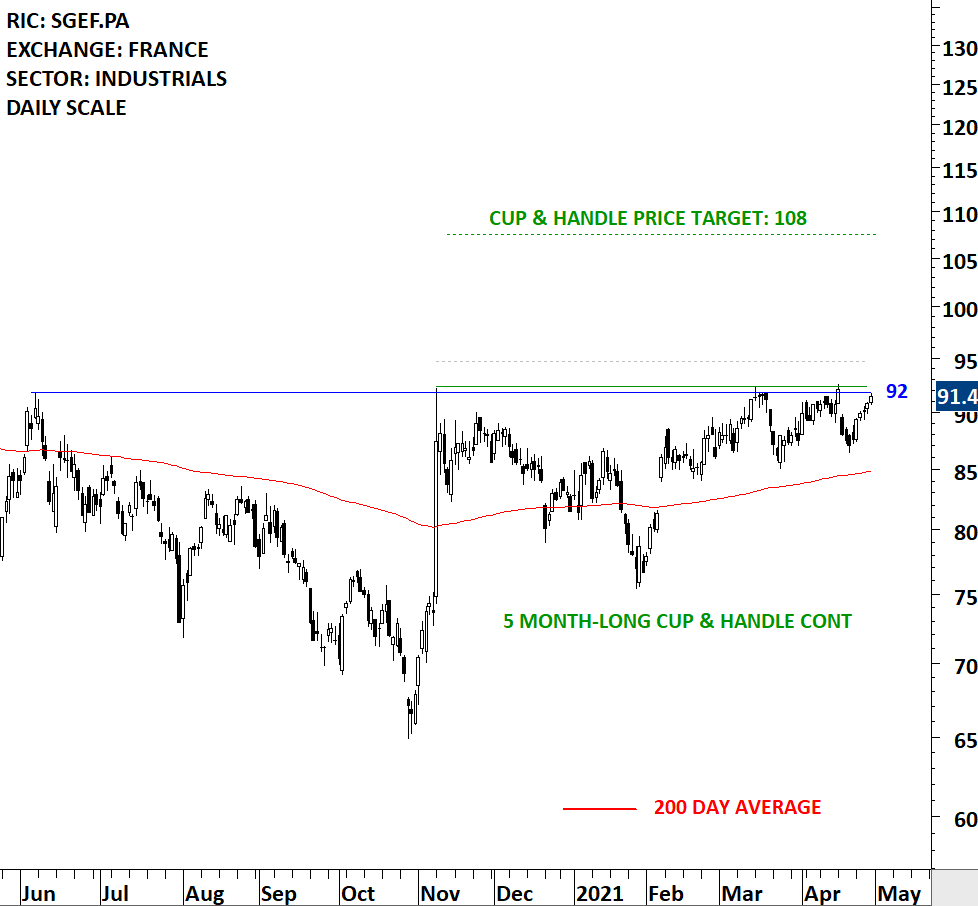
VINCI SA (SGEF.PA)
Vinci SA is a France-based company active in the concessions and construction industry worldwide. It manages three segments: Concessions, Contracting and VINCI Immobilier. The stock is listed on the Paris Stock Exchange. Price chart formed a 5 month-long cup & handle continuation with the horizontal boundary acting as strong resistance at 92.00 levels. The horizontal boundary was tested several times over the course of the chart pattern. A daily close above 94.70 levels will confirm the breakout from the 5 month-long cup & handle continuation with the possible chart pattern price target of 108.00 levels.
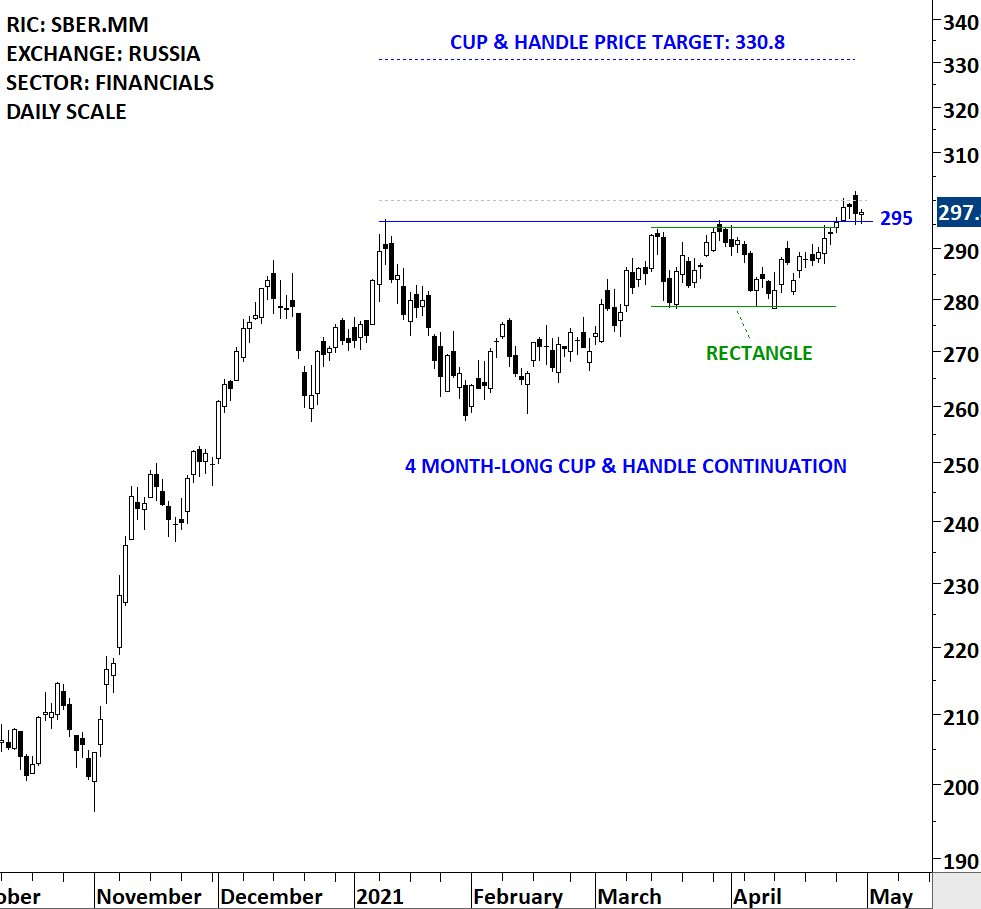
SBERBANK ROSSII PAO (SBER.MM)
Sberbank Rossii PAO is a Russia-based company, which is primarily focused on the financial services industry. The Company operates as a commercial bank and provides services to individual and corporate clients. The stock is listed on the MICEX Stock Exchange. Price chart formed a 4 month-long cup & handle continuation with the horizontal boundary acting as strong resistance at 295.00 levels. The horizontal boundary was tested several times over the course of the chart pattern. A daily close above 300.00 levels will confirm the breakout from the 4 month-long cup & handle continuation with the possible chart pattern price target of 330.80 levels. The handle part of the chart pattern can be identified as a possible rectangle. Breakout can push the stock to all-time highs. This week’s price action was a borderline breakout.
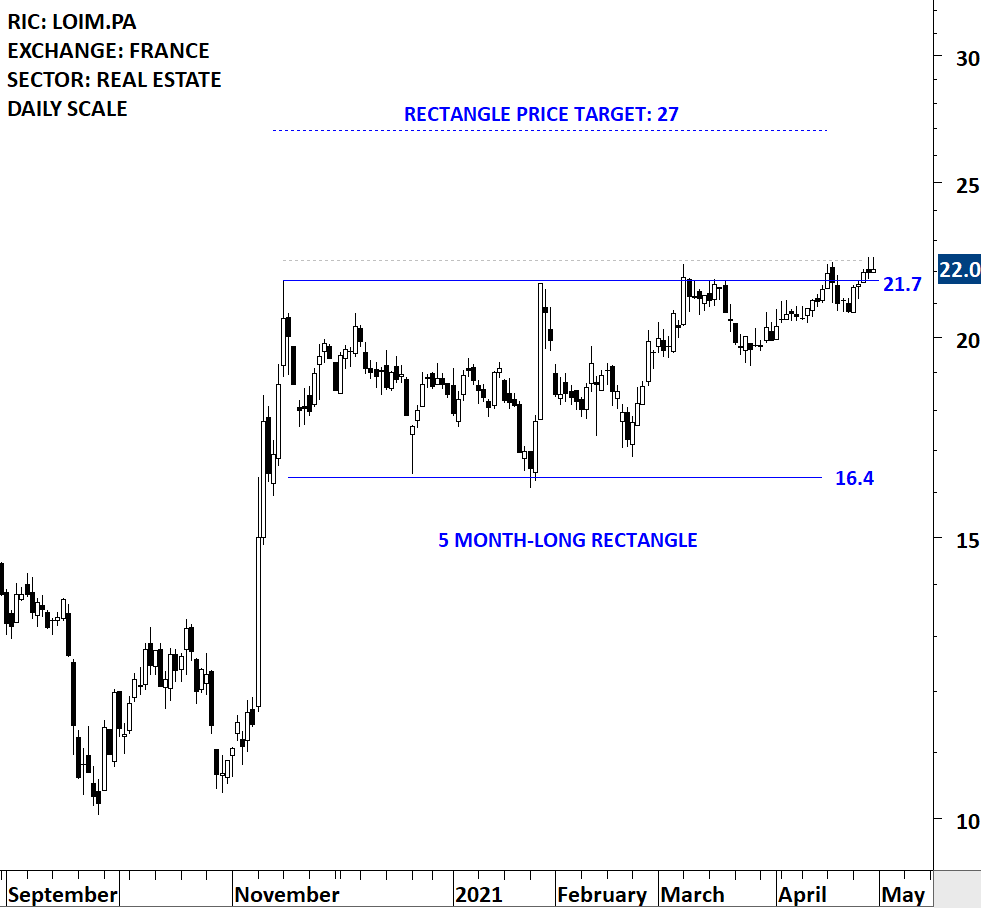
KLEPIERRE SA (LOIM.PA)
Klepierre SA is a France-based company engaged in the financial industry. The Company is a pan-European shopping center operator, combining development, rental, property and asset management skills. The stock is listed on the Paris Stock Exchange. Price chart formed a 5 month-long rectangle with the horizontal boundary acting as strong resistance at 21.70 levels. The horizontal boundary was tested several times over the course of the chart pattern. A daily close above 22.35 levels will confirm the breakout from the 5 month-long rectangle with the possible chart pattern price target of 27.00 levels.
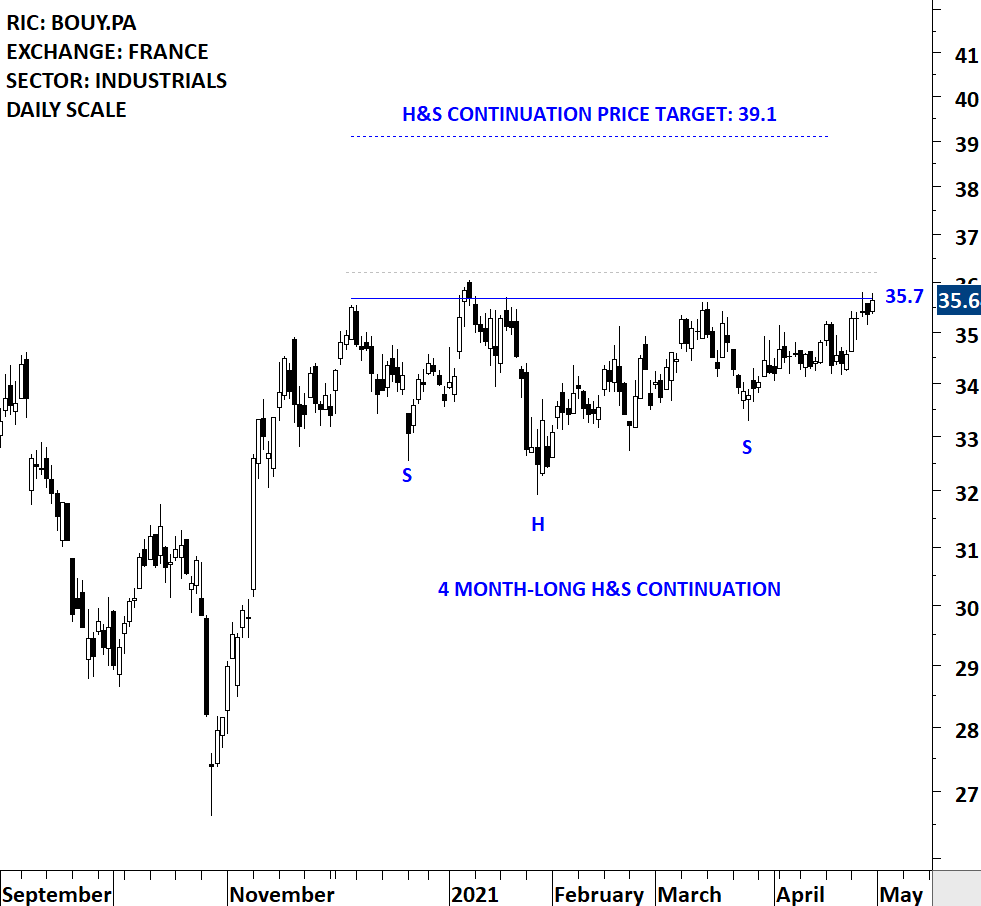
BOUYGUES SA (BOUY.PA)
Bouygues SA is a France-based diversified services group. It operates through its subsidiaries focusing on three sectors: Construction, Media and Telecom. The stock is listed on the Paris Stock Exchange. Price chart formed a 4 month-long head and shoulder continuation with the horizontal boundary acting as strong resistance at 35.70 levels. The horizontal boundary was tested several times over the course of the chart pattern. A daily close above 36.20 levels will confirm the breakout from the 4 month-long head and shoulder continuation with the possible chart pattern price target of 39.10 levels.
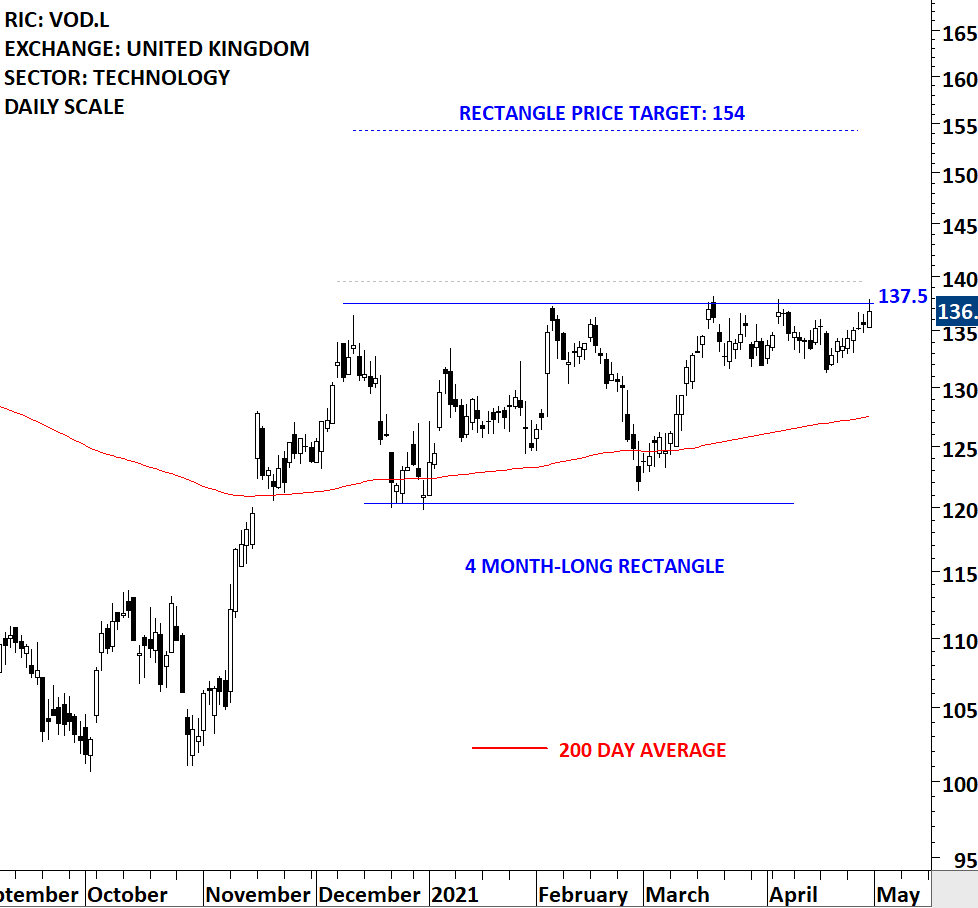
VODAFONE GROUP PLC (VOD.L)
Vodafone Group Plc is a telecommunications company. The Company’s business is organized into two geographic regions: Europe, and Africa, Middle East and Asia Pacific (AMAP). The stock is listed on the London Stock Exchange. Price chart formed a 4 month-long rectangle with the horizontal boundary acting as strong resistance at 137.50 levels. The horizontal boundary was tested several times over the course of the chart pattern. A daily close above 139.50 levels will confirm the breakout from the 4 month-long rectangle with the possible chart pattern price target of 154.00 levels.
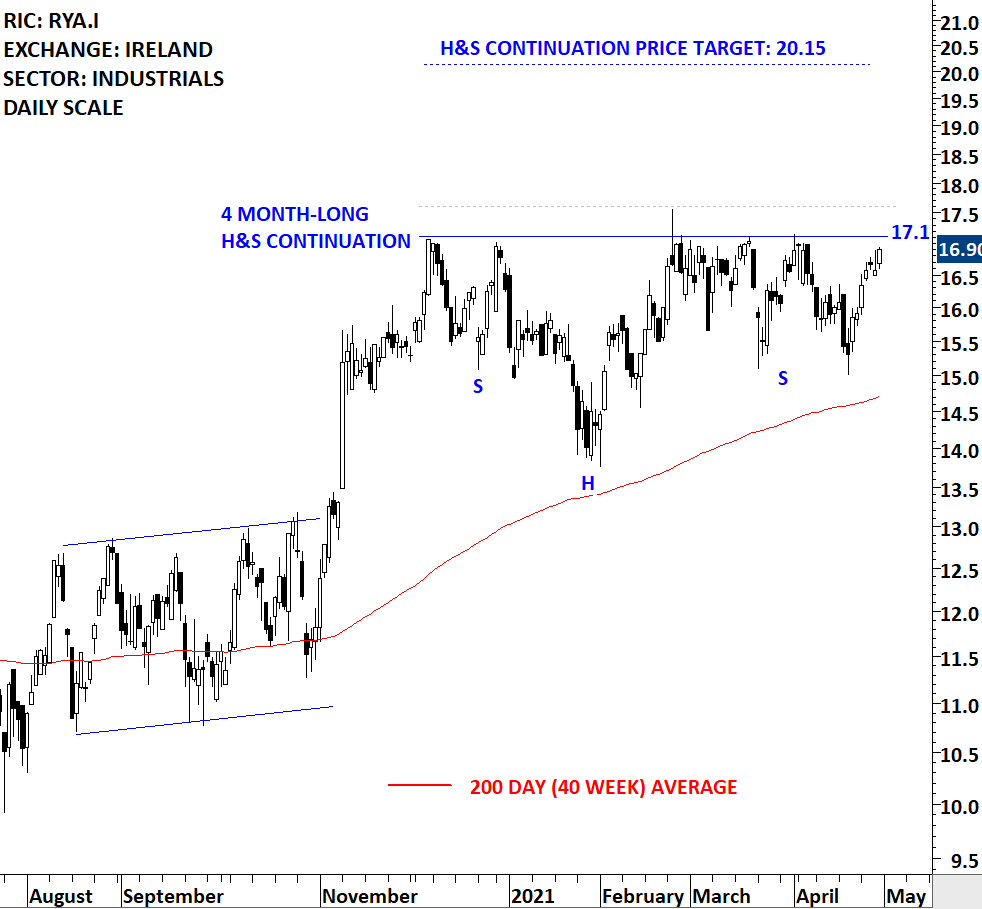
RYANAIR HOLDINGS PLC (RYA.I)
Ryanair Holdings plc (Ryanair Holdings) is a holding company for Ryanair Limited (Ryanair). Ryanair operates an ultra-low fare, scheduled-passenger airline serving short-haul, point-to-point routes between Ireland, the United Kingdom, Continental Europe, Morocco and Israel. The stock is listed on the Ireland Stock Exchange. Price chart formed a 4 month-long head and shoulder continuation with the horizontal boundary acting as strong resistance at 17.10 levels. The horizontal boundary was tested several times over the course of the chart pattern. A daily close above 17.60 levels will confirm the breakout from the 4 month-long head and shoulder continuation with the possible chart pattern price target of 20.15 levels.
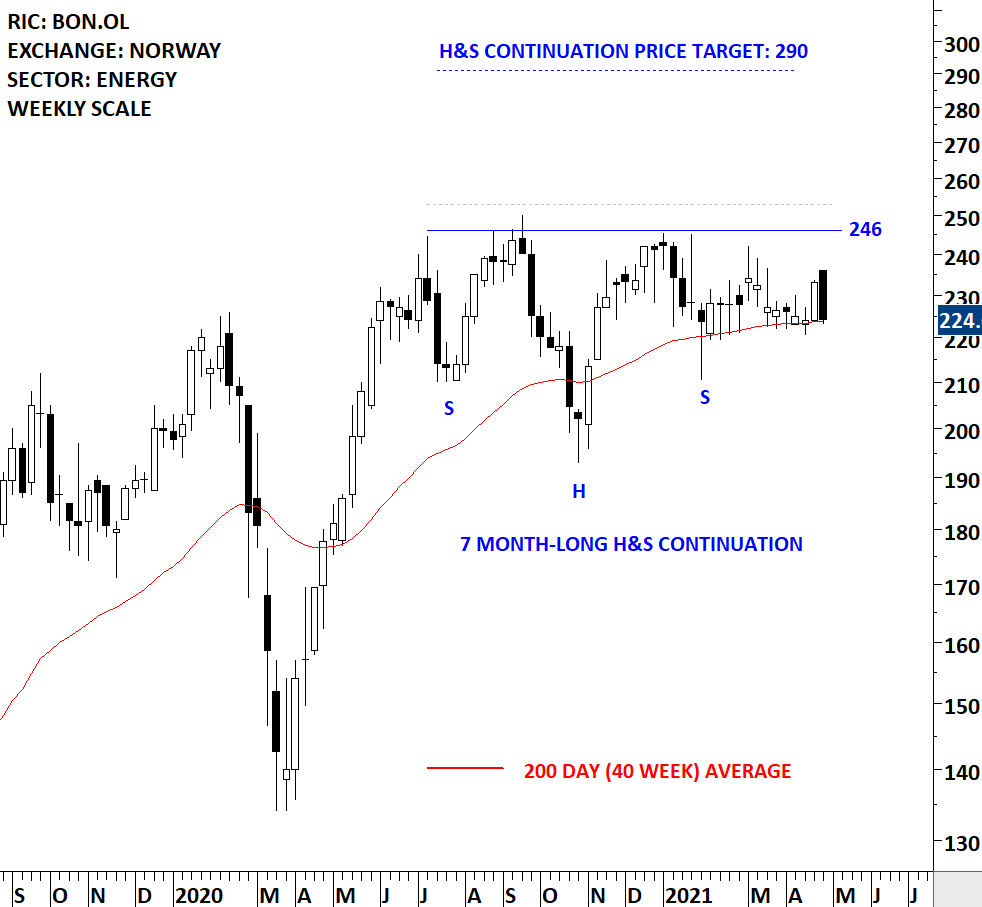
BONHEUR ASA (BON.OL)
Bonheur ASA is a Norway-based company engaged in long-term investment in firms, which specialize in the marine and renewable energy sector. The stock is listed on the Oslo Stock Exchange. Price chart formed a 7 month-long head and shoulder continuation with the horizontal boundary acting as strong resistance at 246.00 levels. The horizontal boundary was tested several times over the course of the chart pattern. A daily close above 253.00 levels will confirm the breakout from the 7 month-long head and shoulder continuation with the possible chart pattern price target of 290.00 levels.
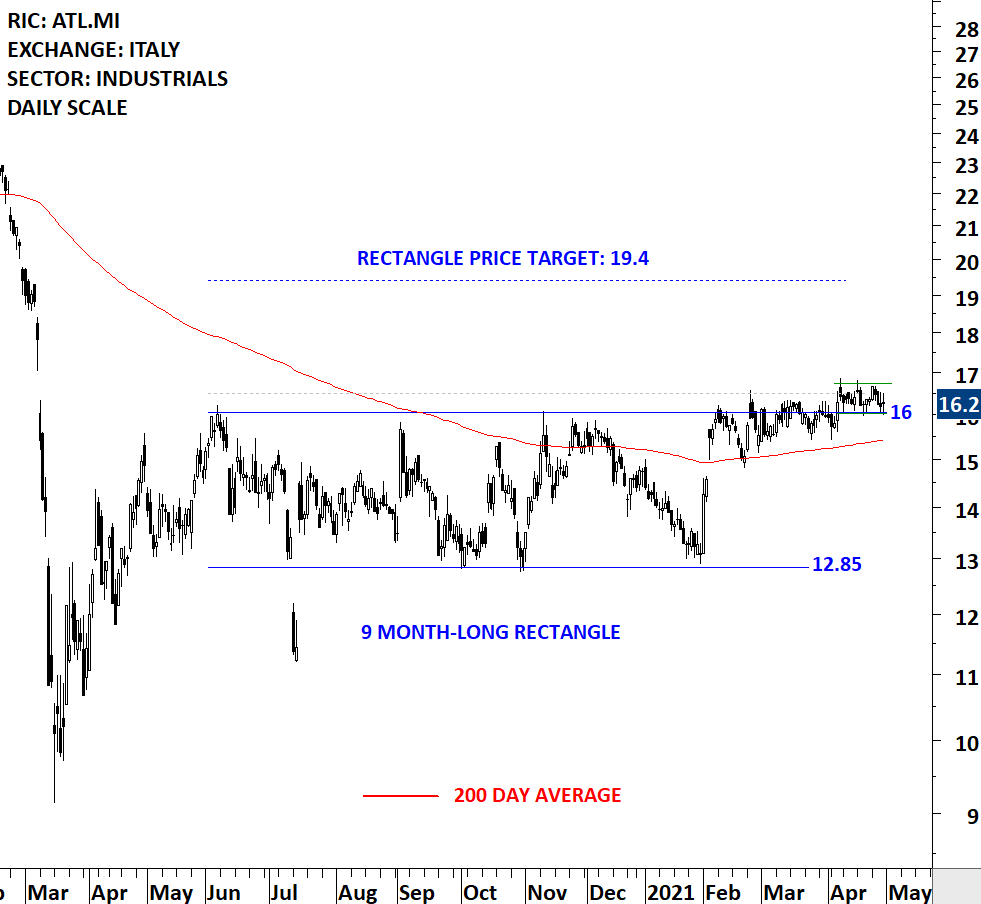
ATLANTIA SPA (ATL.MI)
Atlantia SpA is an Italy-based company engaged in toll road and airport management. The Company operates through five segments: Italian motorways, Overseas motorways, Italian airports, Overseas airports, and Atlantia and other activities. The stock is listed on the Milan Stock Exchange. Price chart formed a 9 month-long rectangle with the horizontal boundary acting as strong resistance at 16.00 levels. The horizontal boundary was tested several times over the course of the chart pattern. A daily close above 16.50 levels will confirm the breakout from the 9 month-long rectangle with the possible chart pattern price target of 19.40 levels. This week’s price action was a borderline breakout.
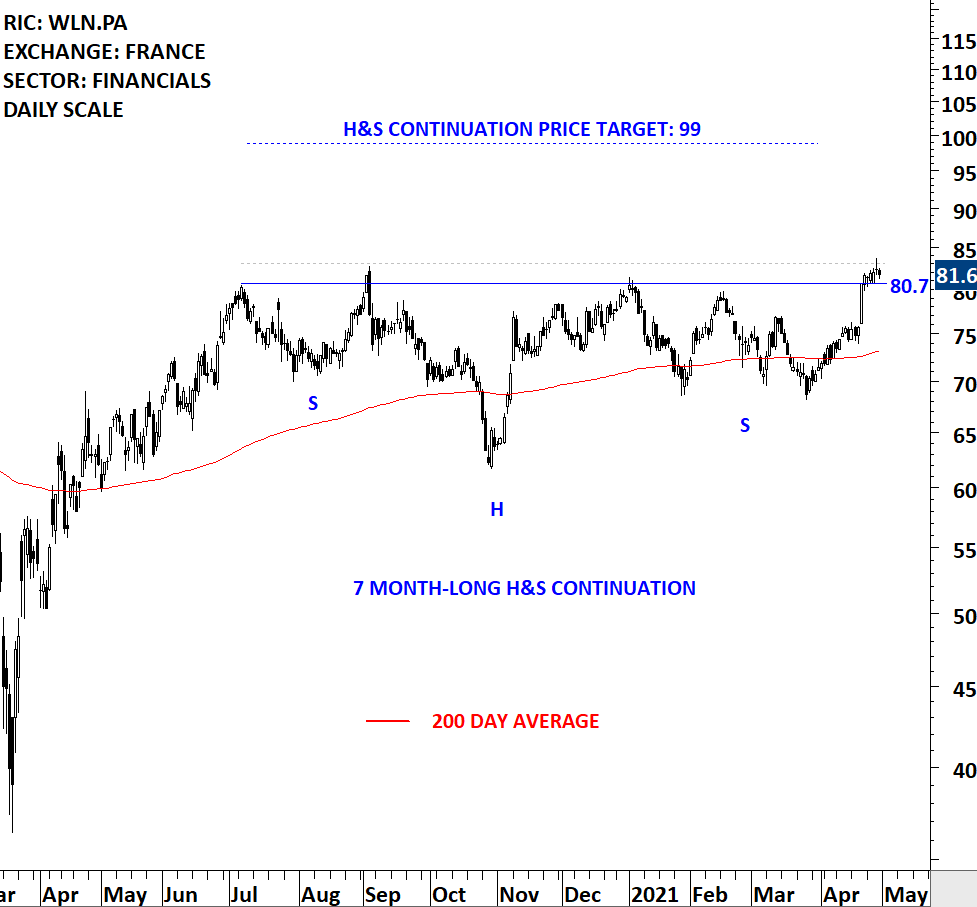
WORLDLINE SA (WLN.PA)
Worldline SA, formerly Atos Worldline SAS, is a France-based company providing payment and transaction services. The Company creates and operates digital platforms which handle all transactions between companies, their partners and customers. The stock is listed on the Paris Stock Exchange. Price chart formed a 7 month-long head and shoulder continuation with the horizontal boundary acting as strong resistance at 80.70 levels. The horizontal boundary was tested several times over the course of the chart pattern. A daily close above 83.10 levels will confirm the breakout from the 7 month-long head and shoulder continuation with the possible chart pattern price target of 99.00 levels. Breakout can push the stock to all-time highs.
MIDDLE EAST & AFRICA
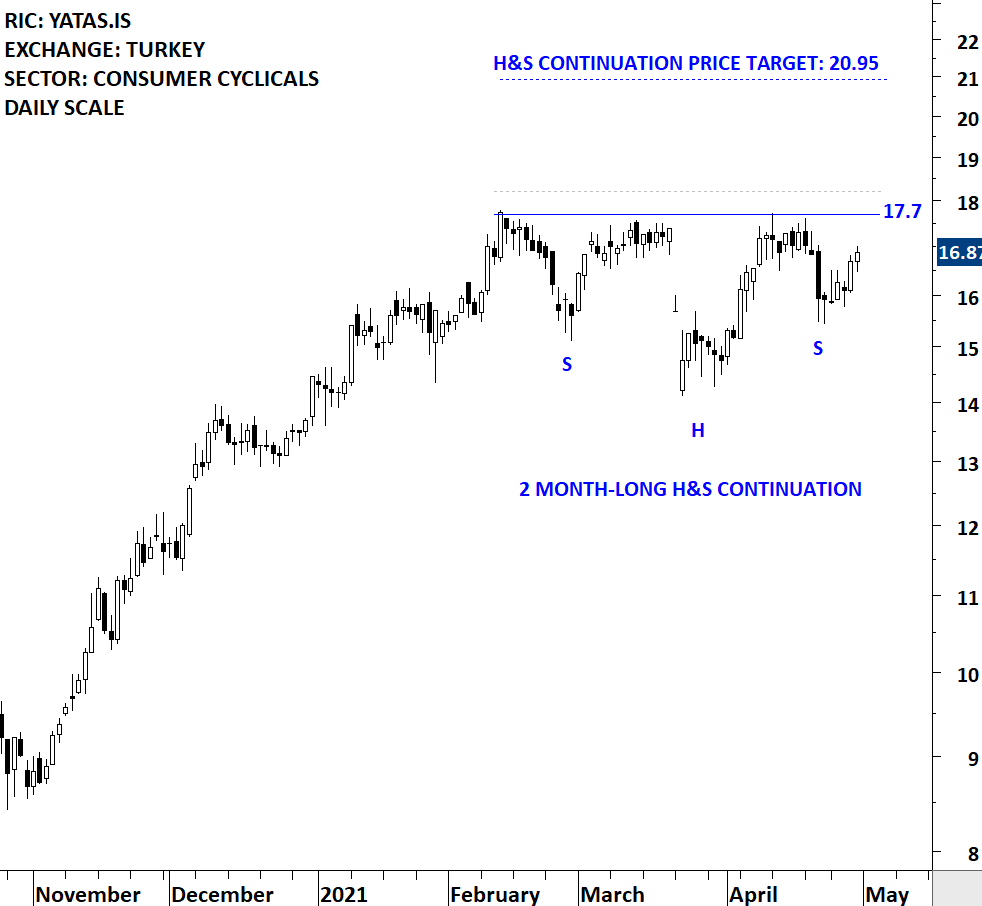
YATAS YATAK VE YORGAN SANAYI TICARET AS (YATAS.IS) – new addition to watchlist
Yatas Yatak ve Yorgan Sanayi Ticaret AS is a Turkey-based company engaged in the manufacture and marketing furniture and other related home furnishing products. The Company’s products include bedroom, living room, children’s room and dining room furniture, bedspreads, bedding sets, pillows, pillow covers, sleeping bags, towels and bathrobes, mattresses, quilts and blankets. The stock is listed on the Istanbul Stock Exchange. Price chart formed a 2 month-long head and continuation with the horizontal boundary acting as resistance at 17.70 levels. The horizontal boundary was tested several times over the course of the chart pattern. A daily close above 18.20 levels will confirm the breakout from the 2 month-long head and continuation with the possible chart pattern price target of 20.95 levels.
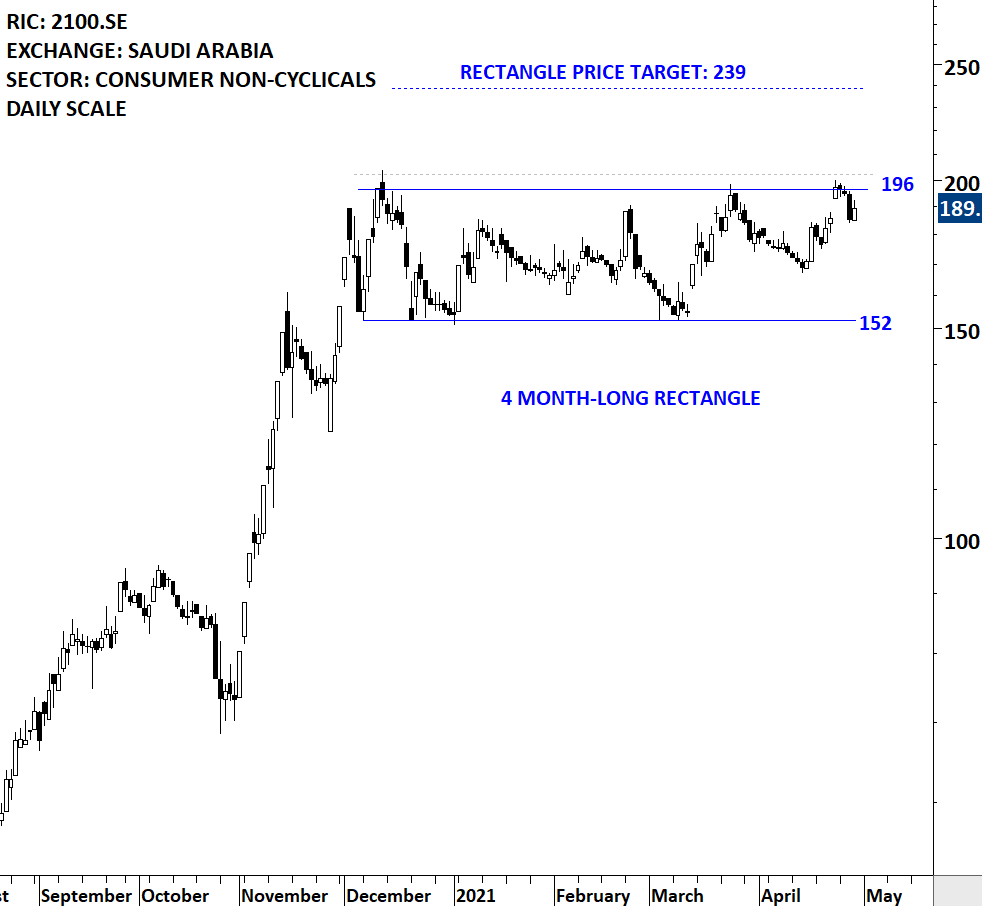
WAFRAH FOR INDUSTRY AND DEVELOPMENT COMPANY SJSC (2100.SE)
Wafrah for Industry and Development Company SJSC is a Saudi Arabia-based food manufacturing company that specializes in the canning, preserving, processing, marketing, development and distribution of food products. The stock is listed on the Tadawul Stock Exchange. Price chart formed a 4 month-long rectangle with the horizontal boundary acting as strong resistance at 196.00 levels. The horizontal boundary was tested several times over the course of the chart pattern. A daily close above 202.00 levels will confirm the breakout from the 4 month-long rectangle with the possible chart pattern price target of 239.00 levels.
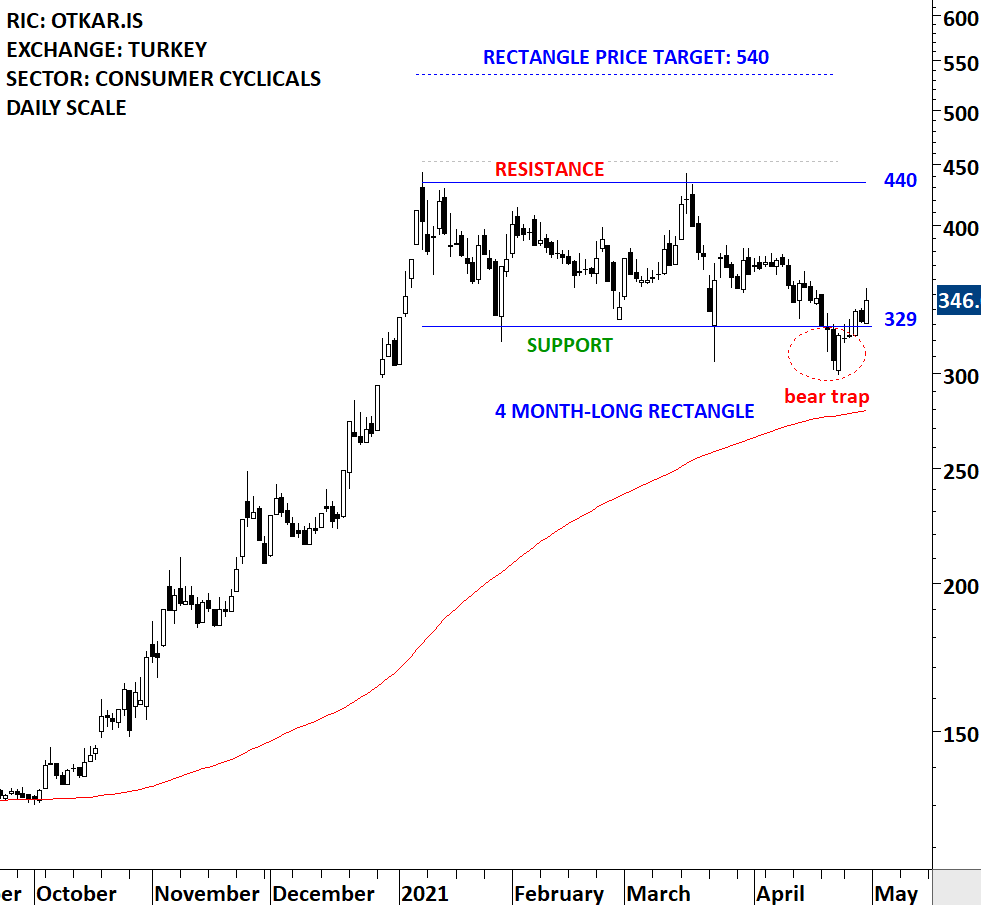
OTOKAR OTOMOTIV VE SAVUNMA SANAYI AS (OTKAR.IS)
Otokar Otomotiv ve Savunma Sanayi AS, formerly Otokar Otobus Karoseri Sanayi AS, is a Turkey-based company engaged in the design, manufacture and sale of commercial, public transportation and military vehicles. The stock is listed on the Istanbul Stock Exchange. Price chart formed a 4 month-long rectangle with the horizontal boundaries acting as strong resistance at 440.00 levels and support at 329 levels. Both boundaries were tested several times over the course of the chart pattern. A daily close above 453.00 levels will confirm the breakout from the 4 month-long rectangle with the possible chart pattern price target of 540.00 levels. I will play this setup from the long side given that the price is trending above its 200-day average. Until there is a breakout the stock offers trading opportunity between the boundaries. Support around 329 levels can offer good entry opportunity. Quick recovery above 329 resulted in a bear trap.
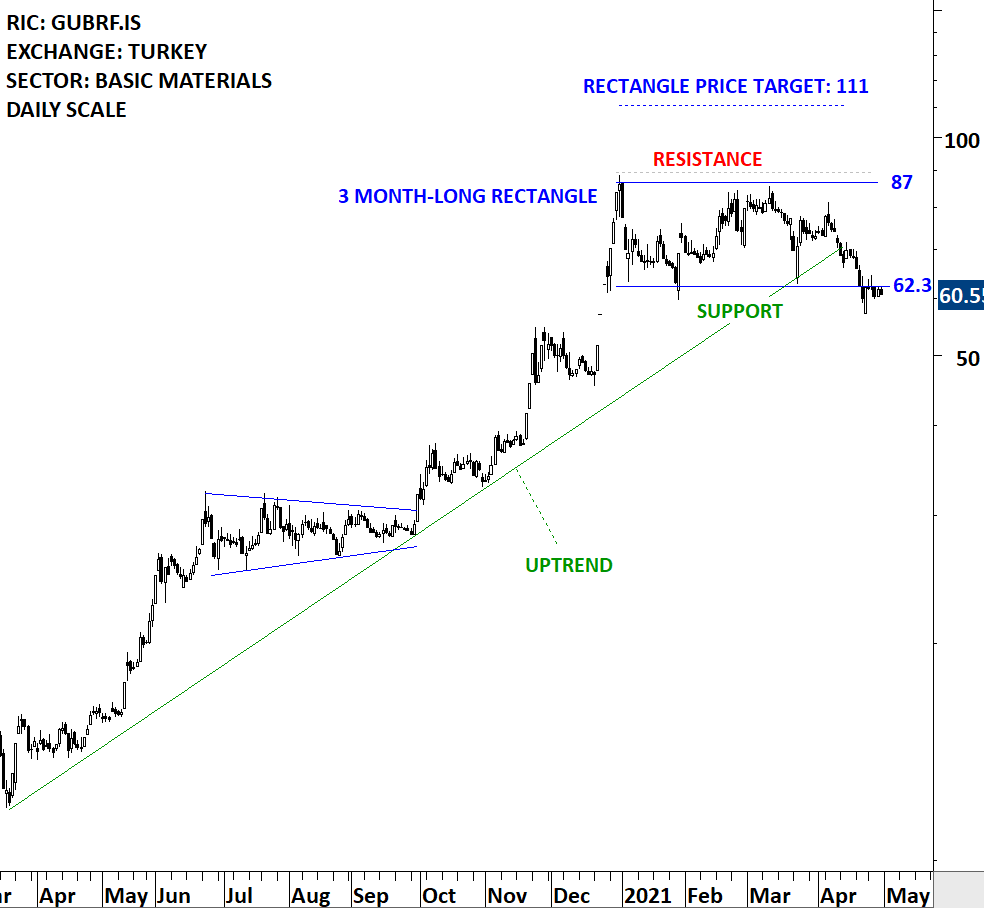
GUBRE FABRIKALARI TAS (GUBRF.IS)
Gubre Fabrikalari TAS (Gubretas) is a Turkey-based company engaged in the production and marketing of chemical fertilizers, including solid fertilizers, liquid fertilizers, powder-based fertilizers and organic fertilizers. The stock is listed on the Istanbul Stock Exchange. Price chart formed a 3 month-long rectangle with the horizontal boundary acting as strong resistance at 87.00 levels. The horizontal boundary was tested several times over the course of the chart pattern. A daily close above 89.60 levels will confirm the breakout from the 3 month-long rectangle with the possible chart pattern price target of 111.00 levels. I will give this name few more days to prove itself at the lower boundary. Quick recovery above 62.3 can result in a bear trap.
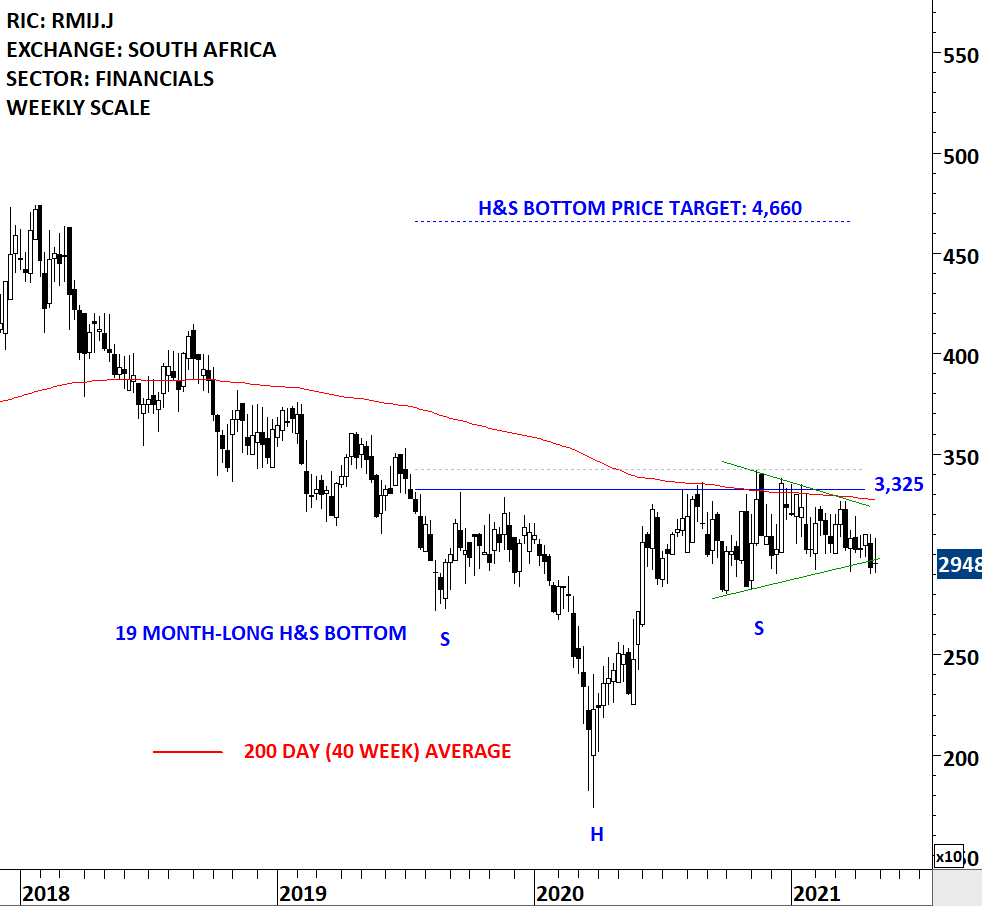
RAND MERCHANT INVESTMENT HOLDINGS LTD (RMIJ.J)
Rand Merchant Investment Holdings Limited, formerly Rand Merchant Insurance Holdings Limited, is an investment holding company. The stock is listed on the Johannesburg Stock Exchange. Price chart formed a 19 month-long head and shoulder bottom with the horizontal boundary (neckline) acting as strong resistance at 3,325.00 levels. The horizontal boundary was tested several times over the course of the chart pattern. A daily close above 3,425.00 levels will confirm the breakout from the 19 month-long head and shoulder bottom with the possible chart pattern price target of 4,660.00 levels. The right shoulder of the H&S bottom reversal can be identified as a possible symmetrical triangle. Breakout can complete the chart pattern and also clear the 200-day average.
ASIA
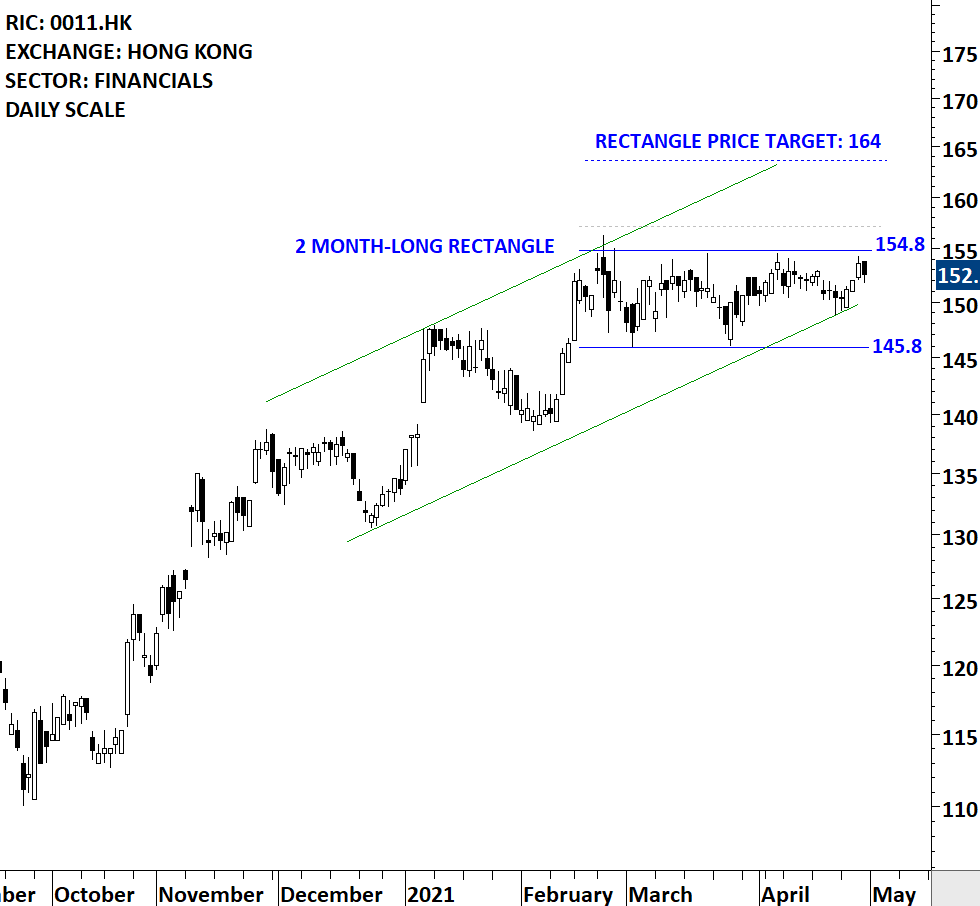
HANG SENG BANK LTD (0011.HK) – new addition to watchlist
Hang Seng Bank Ltd is a company principally engaged in the commercial banking business. The stock is listed on the Hong Kong Stock Exchange. Price chart formed a 2 month-long rectangle with the horizontal boundary acting as resistance at 154.80 levels. The horizontal boundary was tested several times over the course of the chart pattern. A daily close above 157.10 levels will confirm the breakout from the 2 month-long rectangle with the possible chart pattern price target of 164.00 levels.
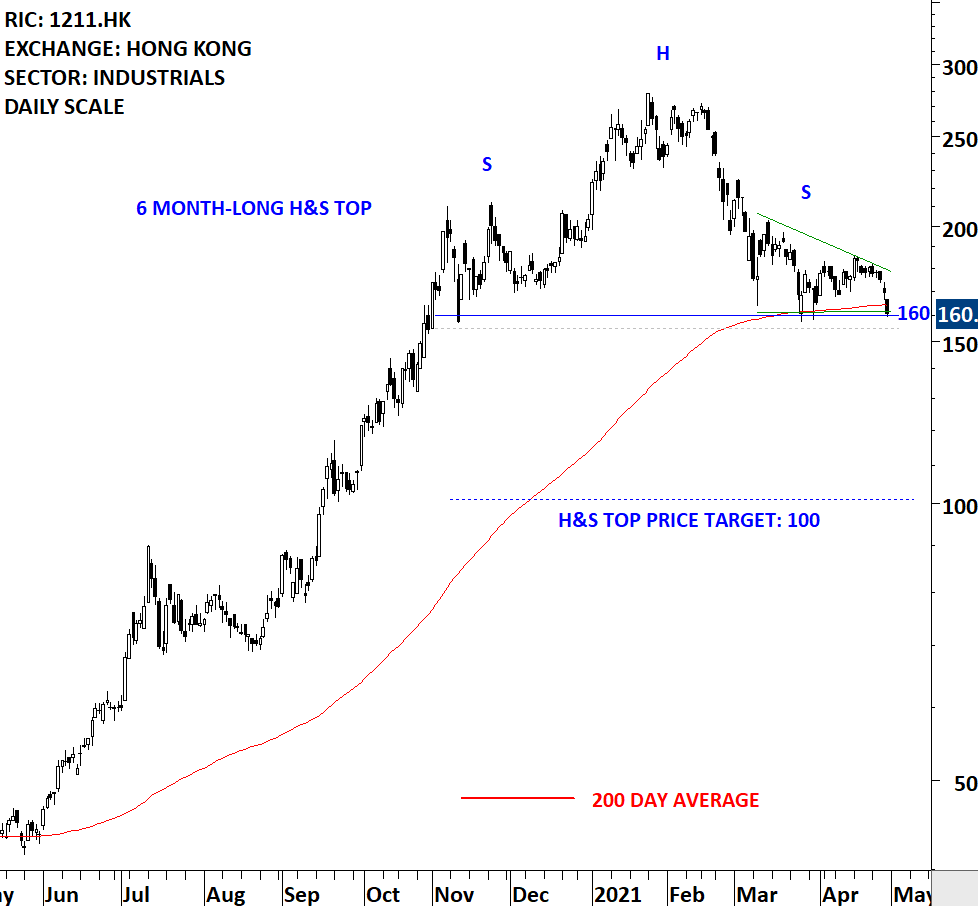
BYD CO LTD (1211.HK) – new addition to watchlist
BYD COMPANY LIMITED is a China-based company principally engaged in the manufacture and sales of transportation equipment. The Company is also engaged in the manufacture and sales of electronic parts and components and electronic devices for daily use. The stock is listed on the Hong Kong Stock Exchange. Price chart formed a 6 month-long head and shoulder top with the horizontal boundary (neckline) acting as support at 160.00 levels. The horizontal boundary was tested several times over the course of the chart pattern. A daily close below 155.00 levels will confirm the breakdown from the 6 month-long head and shoulder top with the possible chart pattern price target of 100.00 levels. Breakdown can also breach the 200-day average confirming a downtrend.
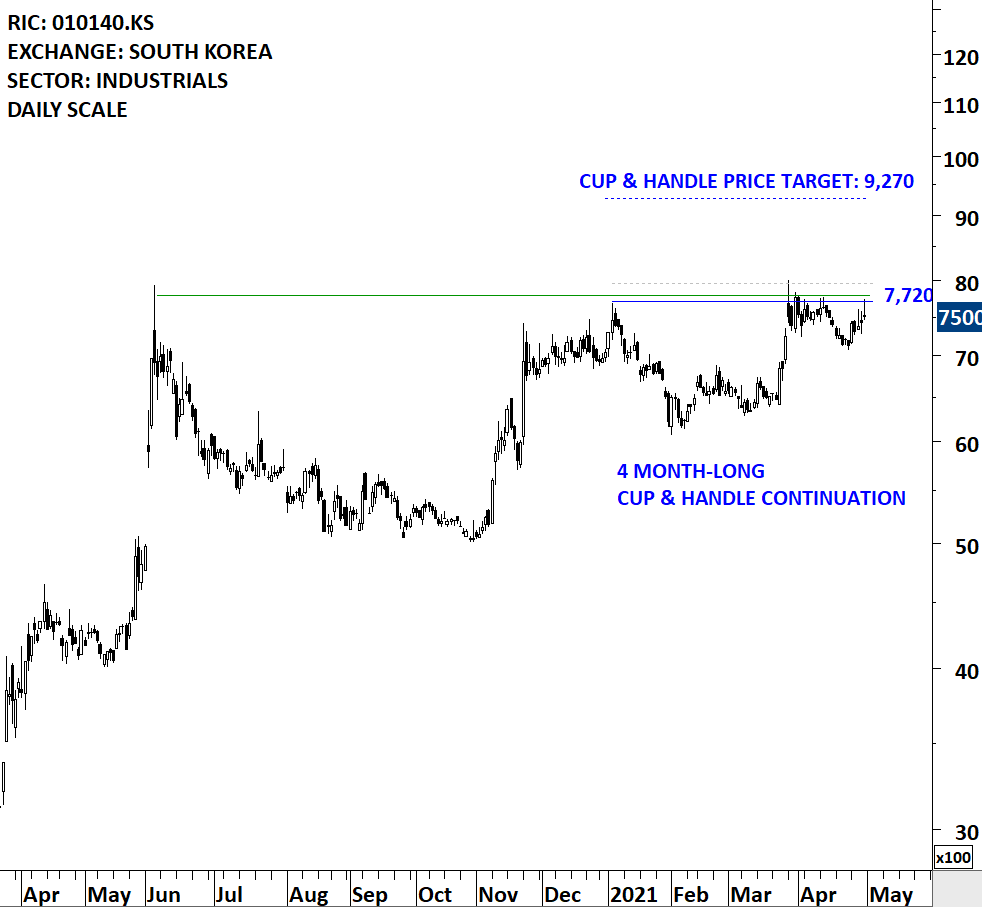
SAMSUNG HEAVY INDUSTRIES CO LTD (010140.KS) – new addition to watchlist
Samsung Heavy Industries Co Ltd is a Korea-based company mainly engaged in the manufacture and distribution of ships and platforms. The Company operates its business through two segments. The Shipbuilding segment is mainly engaged in the design and development of liquefied natural gas (LNG) carriers, tankers, container ships, drill ships and icebreaking tankers, floating, production, storage and offloading (FPSO) vessels and others. The Civil Engineering segment is mainly engaged in civil engineering and construction business. The Company distributes its products within domestic market and to overseas markets. The stock is listed on the Korea Stock Exchange. Price chart formed a 4 month-long cup & handle continuation with the horizontal boundary acting as strong resistance at 7,720.00 levels. The horizontal boundary was tested several times over the course of the chart pattern. A daily close above 7,960.00 levels will confirm the breakout from the 4 month-long cup & handle continuation with the possible chart pattern price target of 9,270.00 levels.
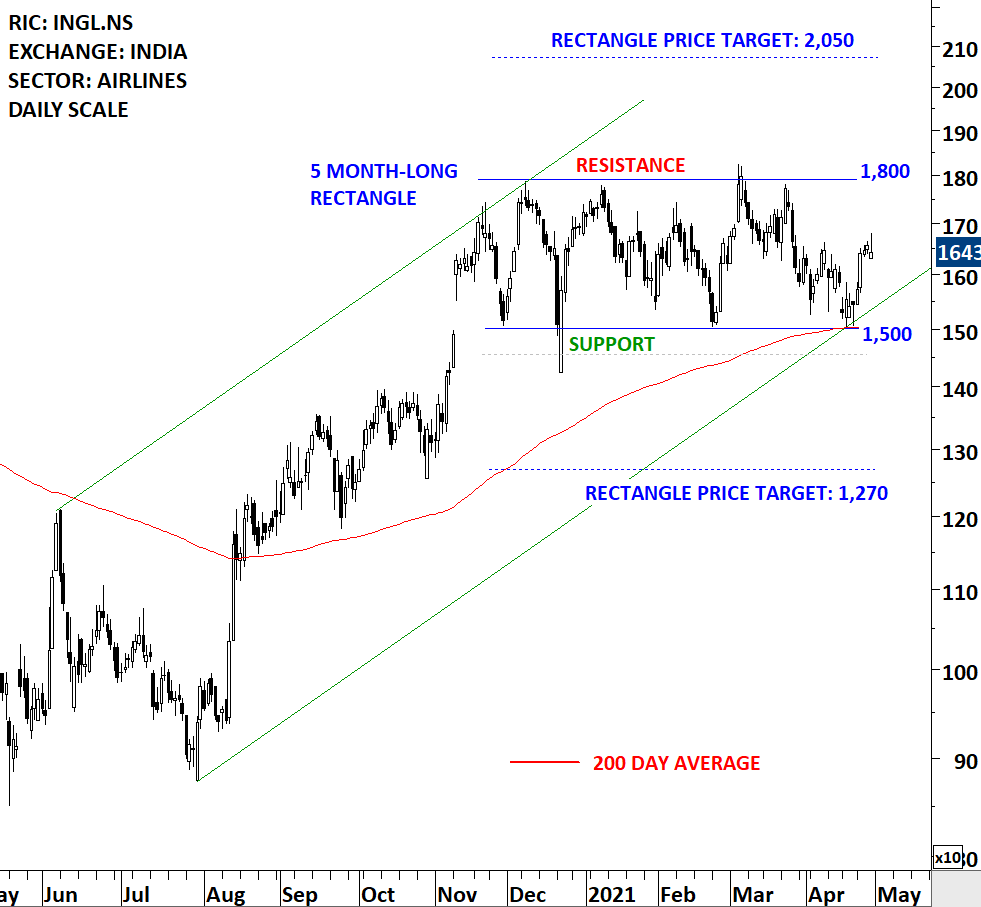
INTERGLOBE AVIATION LTD (INGL.NS)
Interglobe Aviation Limited is an India-based company engaged in the provision of passenger services. The Company is engaged in the business of providing domestic and international scheduled air transport services under the name of IndiGo. It also provides cargo services and related allied services, including in-flight sales. The stock is listed on the National Stock Exchange of India. Price chart formed a 5 month-long rectangle with the lower boundary acting as support at 1,500 and the upper boundary as resistance at 1,800 levels. Both boundaries were tested several times over the course of the chart pattern. Until there is a breakout in any direction, stock offers trading opportunity between boundaries. A daily close below 1,455 levels will confirm the breakdown from the 5 month-long rectangle with the possible chart pattern price target of 1270 levels.
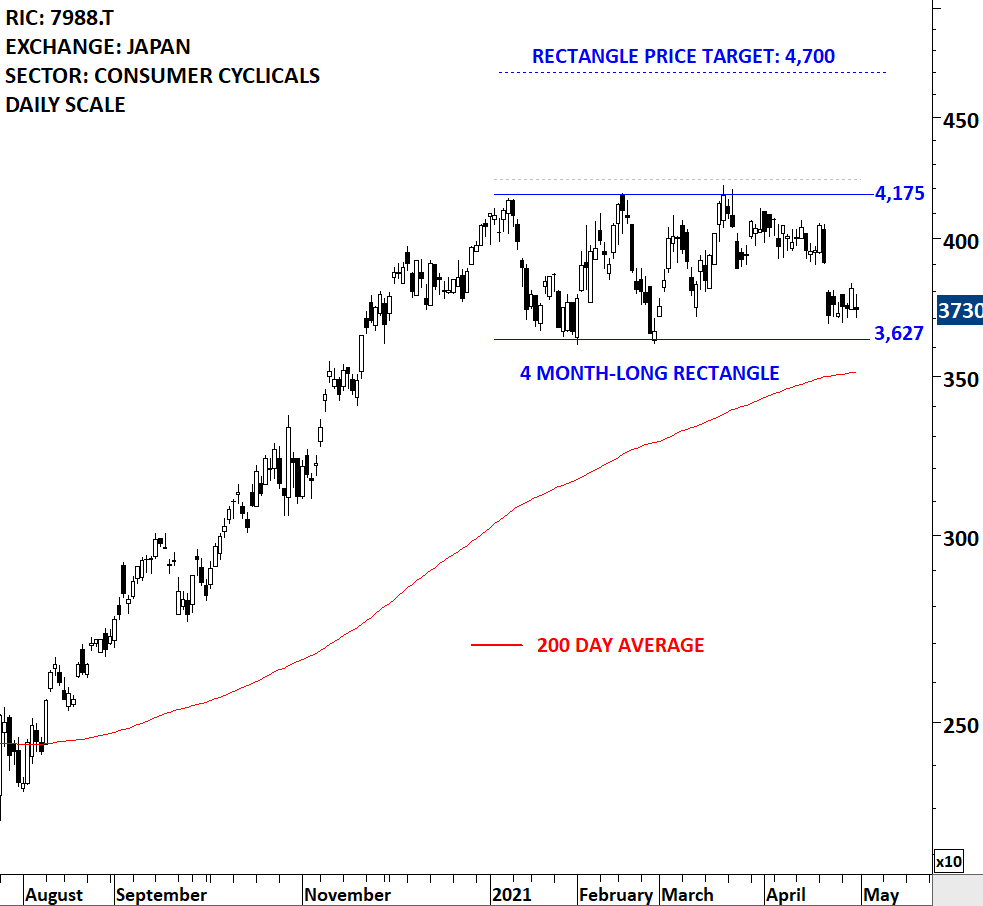
NIFCO INC (7988.T)
NIFCO INC. is a Japan-based manufacturing company primarily engaged in synthetic resin business. The stock is listed on the Tokyo Stock Exchange. Price chart formed a 4 month-long rectangle with the horizontal boundary acting as strong resistance at 4,175.00 levels. The horizontal boundary was tested several times over the course of the chart pattern. A daily close above 4,238.00 levels will confirm the breakout from the 4 month-long rectangle with the possible chart pattern price target of 4,700.00 levels.
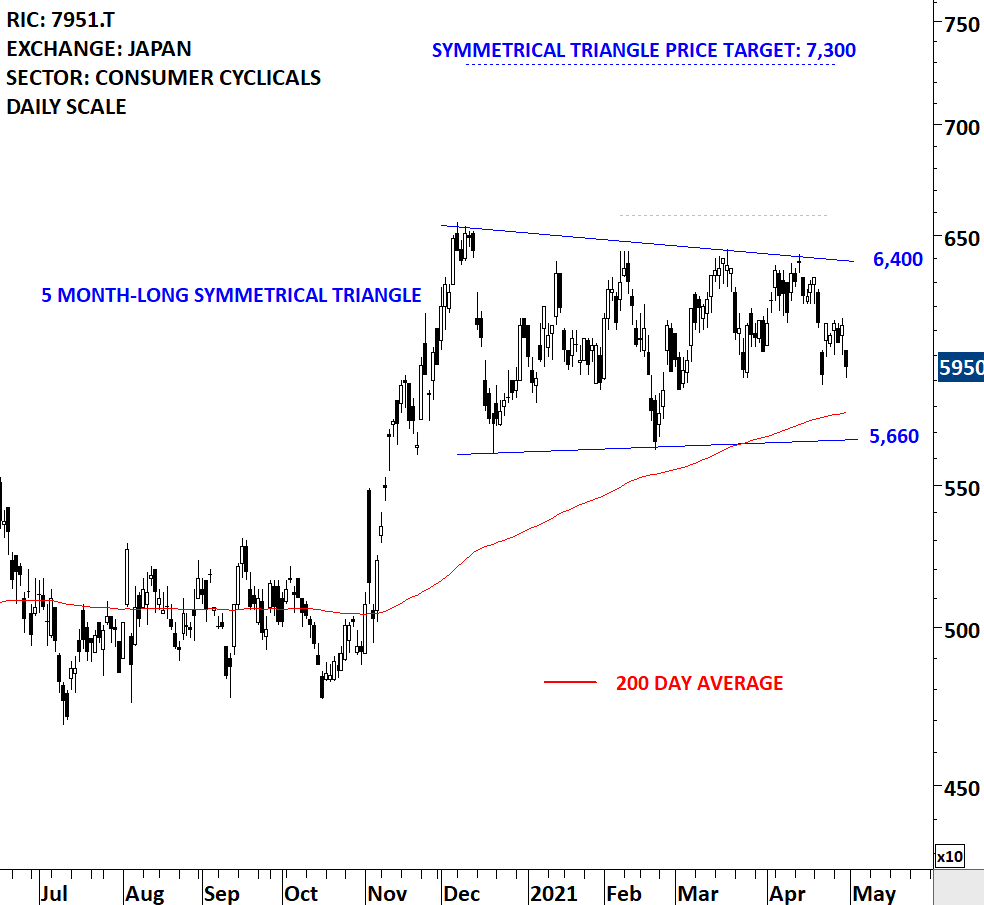
YAMAHA CORP (7951.T)
Yamaha Corporation is a manufacturer of a line of musical instruments. The Company operates in two business segments. The Musical Instrument segment is engaged in the manufacture and sale of pianos and electronic musical instruments, music school management and music dissemination activities, music dissemination activities, music score publishing business, music distribution business, music publishing business, as well as production business. The Audio Equipment segment is engaged in the manufacture and sale of audio equipment, professional audio equipment and information communication equipment. The stock is listed on the Tokyo Stock Exchange. Price chart formed a 5 month-long symmetrical triangle with the upper boundary acting as strong resistance at 6,400.00 levels. The upper boundary was tested several times over the course of the chart pattern. A daily close above 6,590.00 levels will confirm the breakout from the 5 month-long symmetrical triangle with the possible chart pattern price target of 7,300.00 levels.
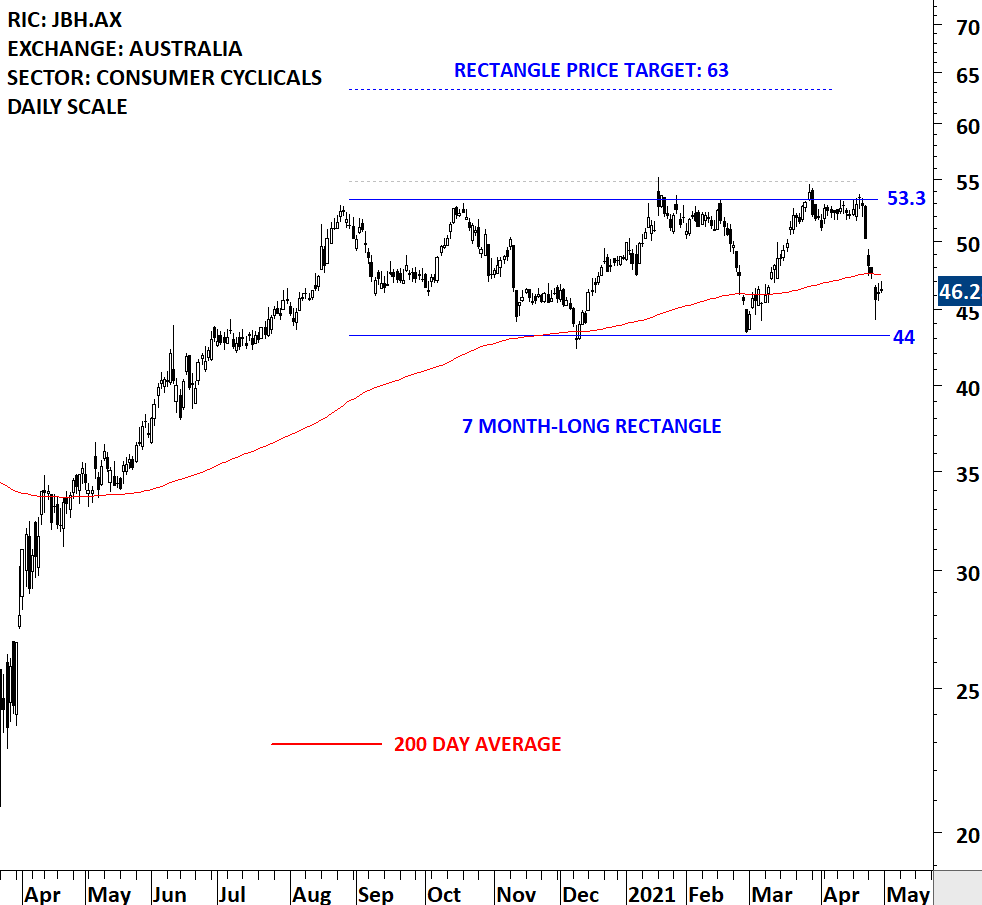
JB HI-FI LTD (JBH.AX)
JB Hi-Fi Ltd is an Australia-based company engaged in retailing of home consumer products. The Company offers a range of brands with a focus on consumer electronics, software, including music, games and movies, whitegoods and appliances. The stock is listed on the Australia Stock Exchange. Price chart formed a 7 month-long rectangle with the horizontal boundary acting as strong resistance at 53.30 levels. The horizontal boundary was tested several times over the course of the chart pattern. A daily close above 54.90 levels will confirm the breakout from the 7 month-long rectangle with the possible chart pattern price target of 63.00 levels. Breakout can push the stock to all-time highs.
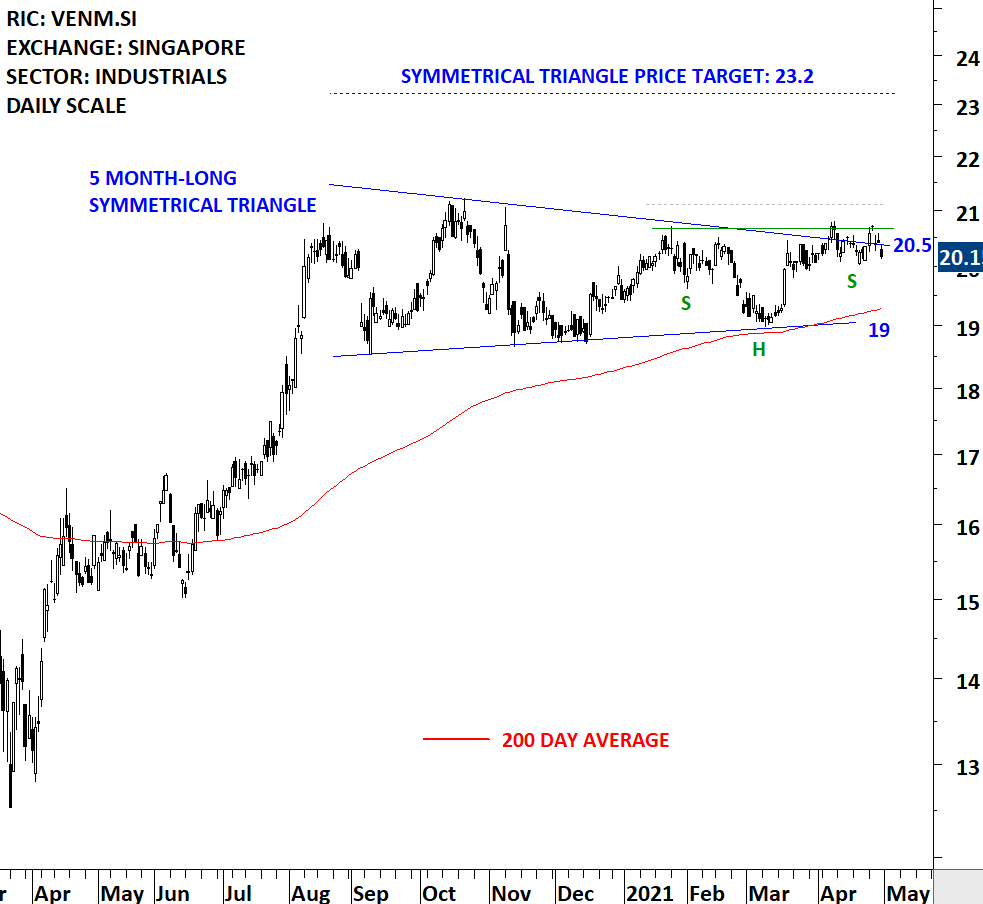
VENTURE CORPORATION LTD (VENM.SI)
Venture Corporation Limited is a Singapore-based provider of technology services, products and solutions. The principal activities of the Company are to provide marketing research, design and development, product and process engineering, design for manufacturability, supply chain management, as well as product refurbishment and technical support across a diversified range of products. The stock is listed on the Singapore Stock Exchange. Price chart formed a 5 month-long symmetrical triangle with the upper boundary acting as strong resistance at 20.50 levels. The upper boundary was tested several times over the course of the chart pattern. A daily close above 21.10 levels will confirm the breakout from the 5 month-long symmetrical triangle with the possible chart pattern price target of 23.20 levels.
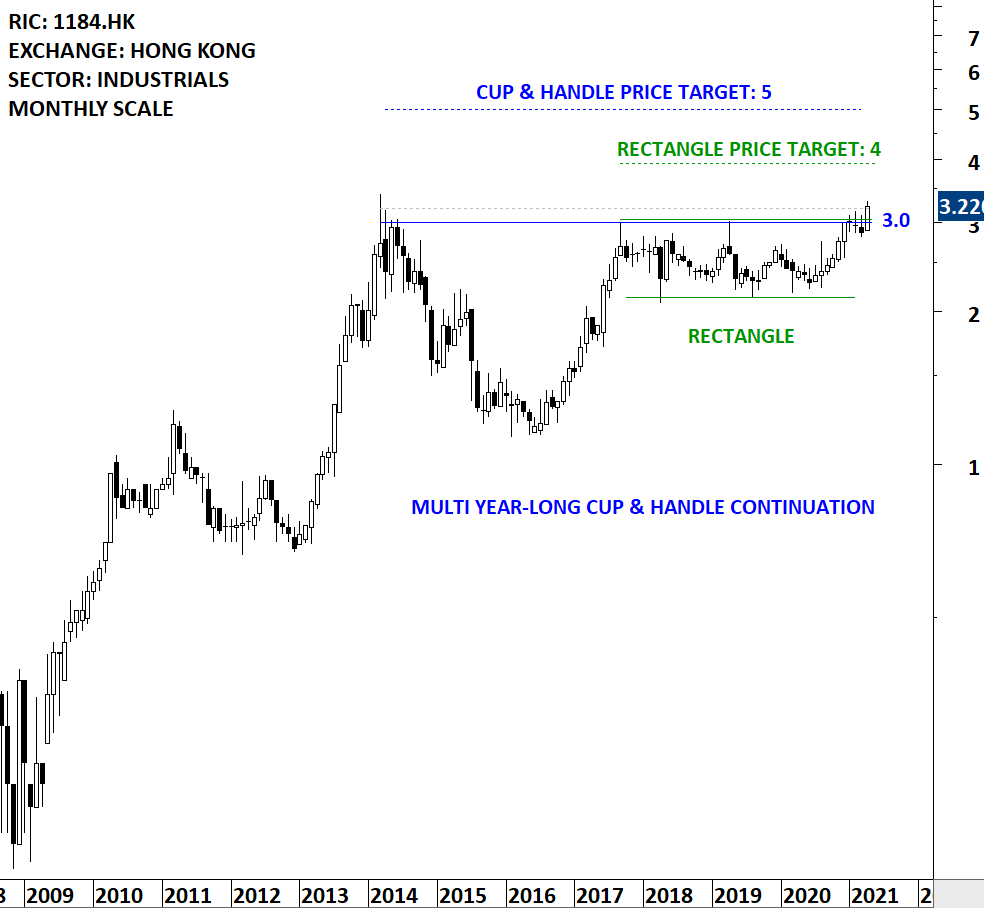
S.A.S. DRAGON HOLDINGS LTD (1184.HK)
S.A.S. Dragon Holdings Limited is an investment holding company principally engaged in the distribution of electronic components and semiconductor products. Its products and services mainly include chipset solutions, display panel, memory chips, light-emitting diode (LED) lighting solutions, power supply system solutions, multimedia system solutions and other premier solutions. The stock is listed on the Hong Kong Stock Exchange. Price chart formed a multi year-long cup & handle with the horizontal boundary acting as strong resistance at 3.00 levels. The horizontal boundary was tested several times over the course of the chart pattern. A daily close above 3.20 levels will confirm the breakout from the multi year-long month-long cup & handle with the possible chart pattern price target of 5.00 levels. The handle part of the chart pattern can be identified as a rectangle. Breakout from both chart patterns can take place at the same price level. I will monitor this name for another day of strength to confirm breakout.
