There are three types of triangles covered under the classical charting principles. The symmetrical triangle, ascending triangle and descending triangle. Between those three I favor ascending and descending triangles for couple of reasons. One of them is, both ascending and descending triangles have horizontal boundaries. Breakouts through the horizontal boundaries are the chart pattern signal. The other reason is that, both ascending and descending triangles have directional bias due to their upward and downward sloping lower and upper boundaries. I find symmetrical triangles difficult to trade as price usually finds resistance at the minor highs following the breakout. Pause around minor resistance usually hampers the momentum and can result in more frequent failures.
Let’s analyze the 3 different types of triangles with below interactive charts.
Symmetrical triangle has both boundaries converging towards an apex. It is a neutral chart pattern and doesn’t have a directional bias.
I follow the below template to review weekly scale price charts. The template loads 5 years of data (+/- 250 candles) on the weekly scale price chart. I like to view price action without any indicators and also on white background.
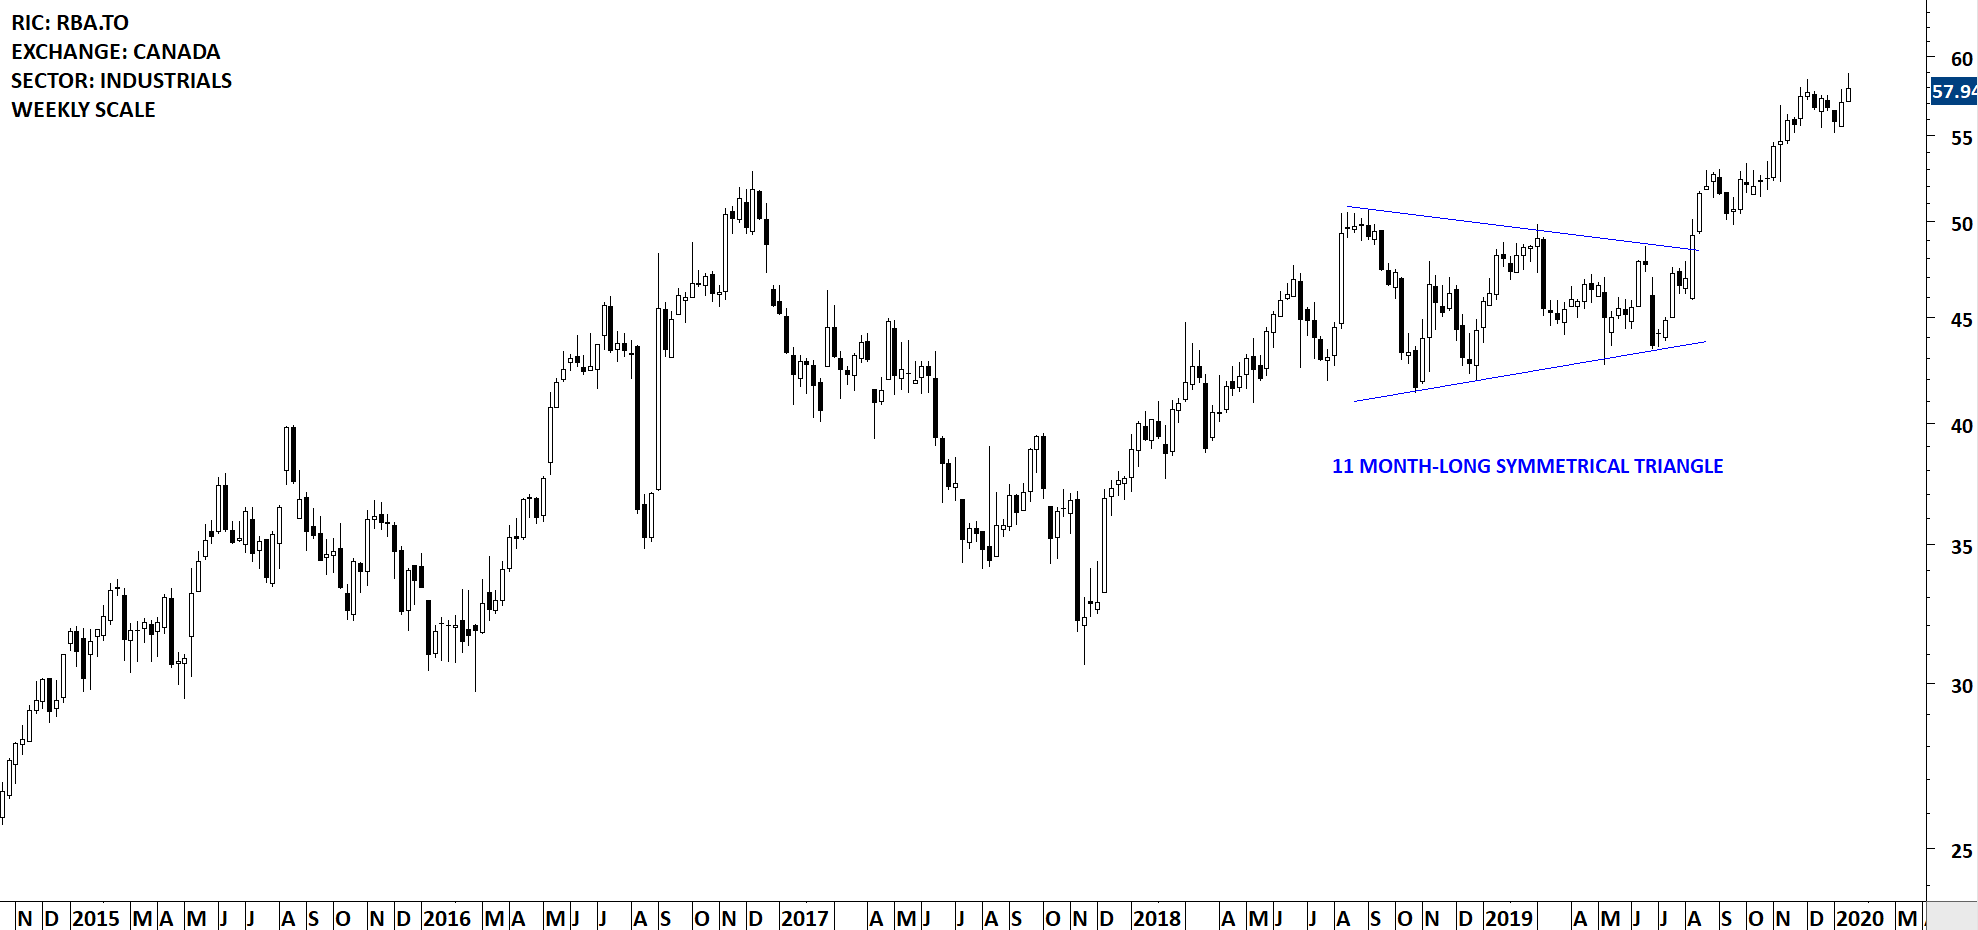
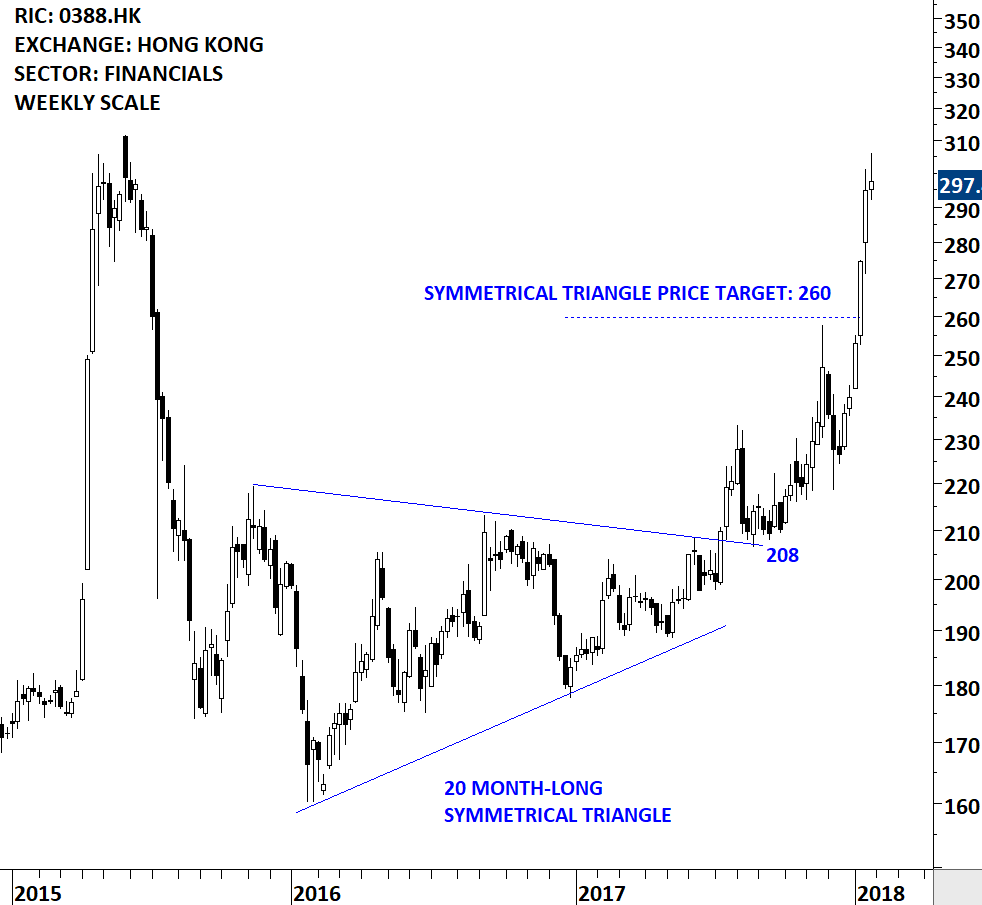
This is how I would draw the boundaries of a symmetrical triangle. I pay attention to several tests of pattern boundary before a breakout takes place. Minimum 3 touches of a chart pattern boundary gives me the confidence that the chart pattern boundary is well-defined and a breakout can trigger a directional movement.
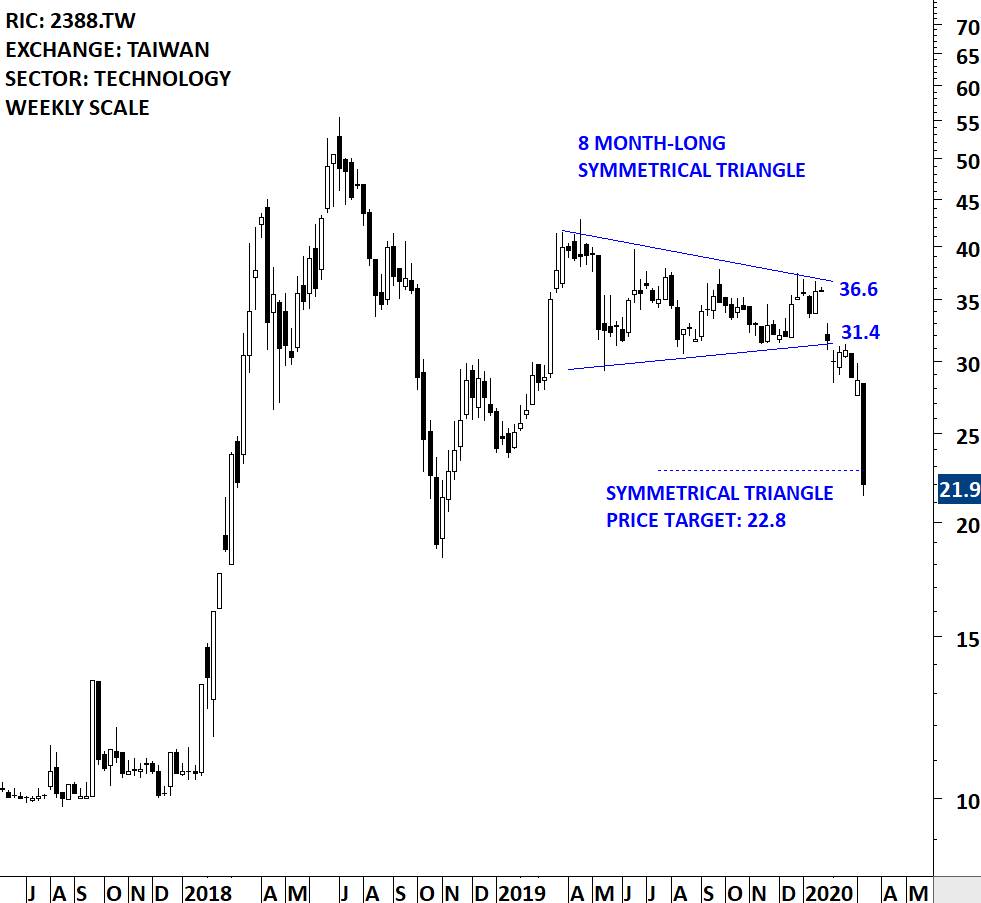
This was a symmetrical triangle reversal that was alerted to Tech Charts members as a symmetrical triangle bottom reversal. Note the 3 touches of the upper boundary and also the sharp pullback that followed the breakout. Minor high acted as resistance and resulted in several weeks of hesitation around the pattern boundary.
This was a symmetrical triangle that acted as a top reversal. You can see the several tests of the lower boundary before the breakdown took place. Note the re-test of the pattern boundary and where the rebound started from; the minor low.
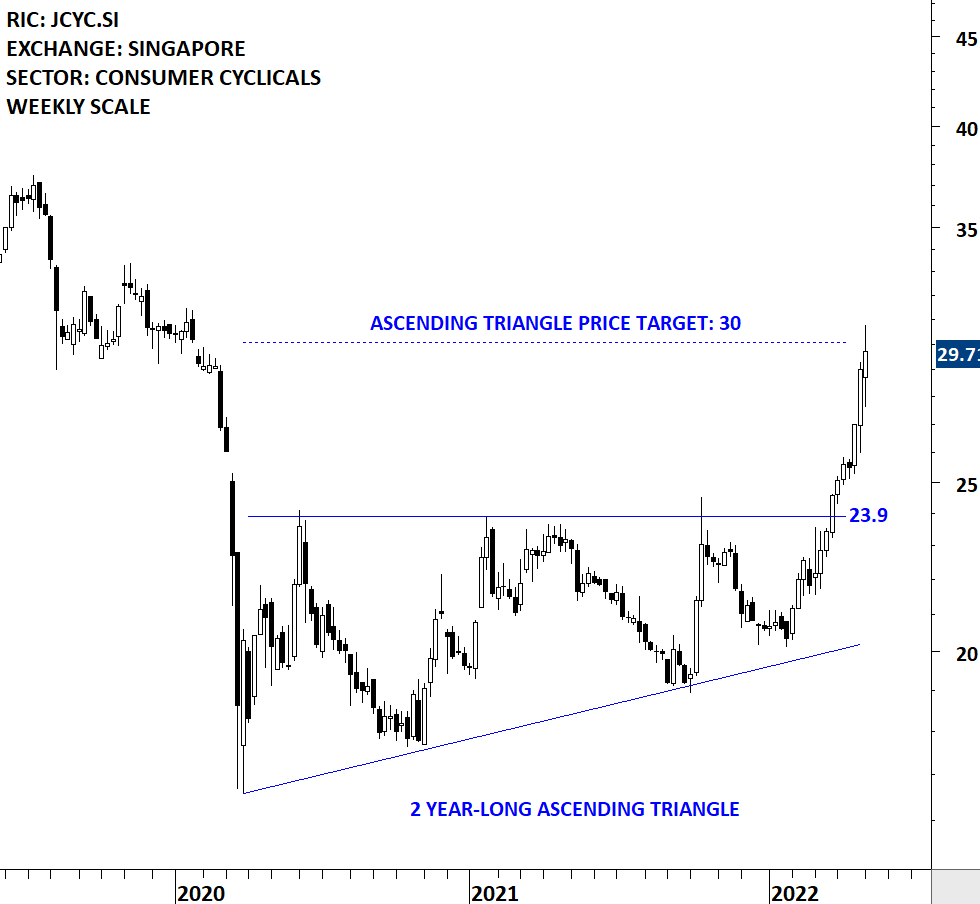
Ascending triangle is a bullish chart pattern. Its upward sloping lower boundary gives the pattern the bullish bias. Buyers are more impatient at every correction, bidding the price at a higher level while sellers defend the same horizontal resistance. Over time the pattern shows the battle between buyers and sellers shifting in favor of buyers. The pattern is completed with a breakout through the horizontal boundary.
I follow the below template to review daily scale price charts. The template loads 1 year of data (+/- 250 candles) on the daily scale price chart. I like to view price action without any indicators and also on white background.
This is how I would draw the boundaries of the ascending triangle. Please note the several tests of the upper boundary before the breakout takes place.
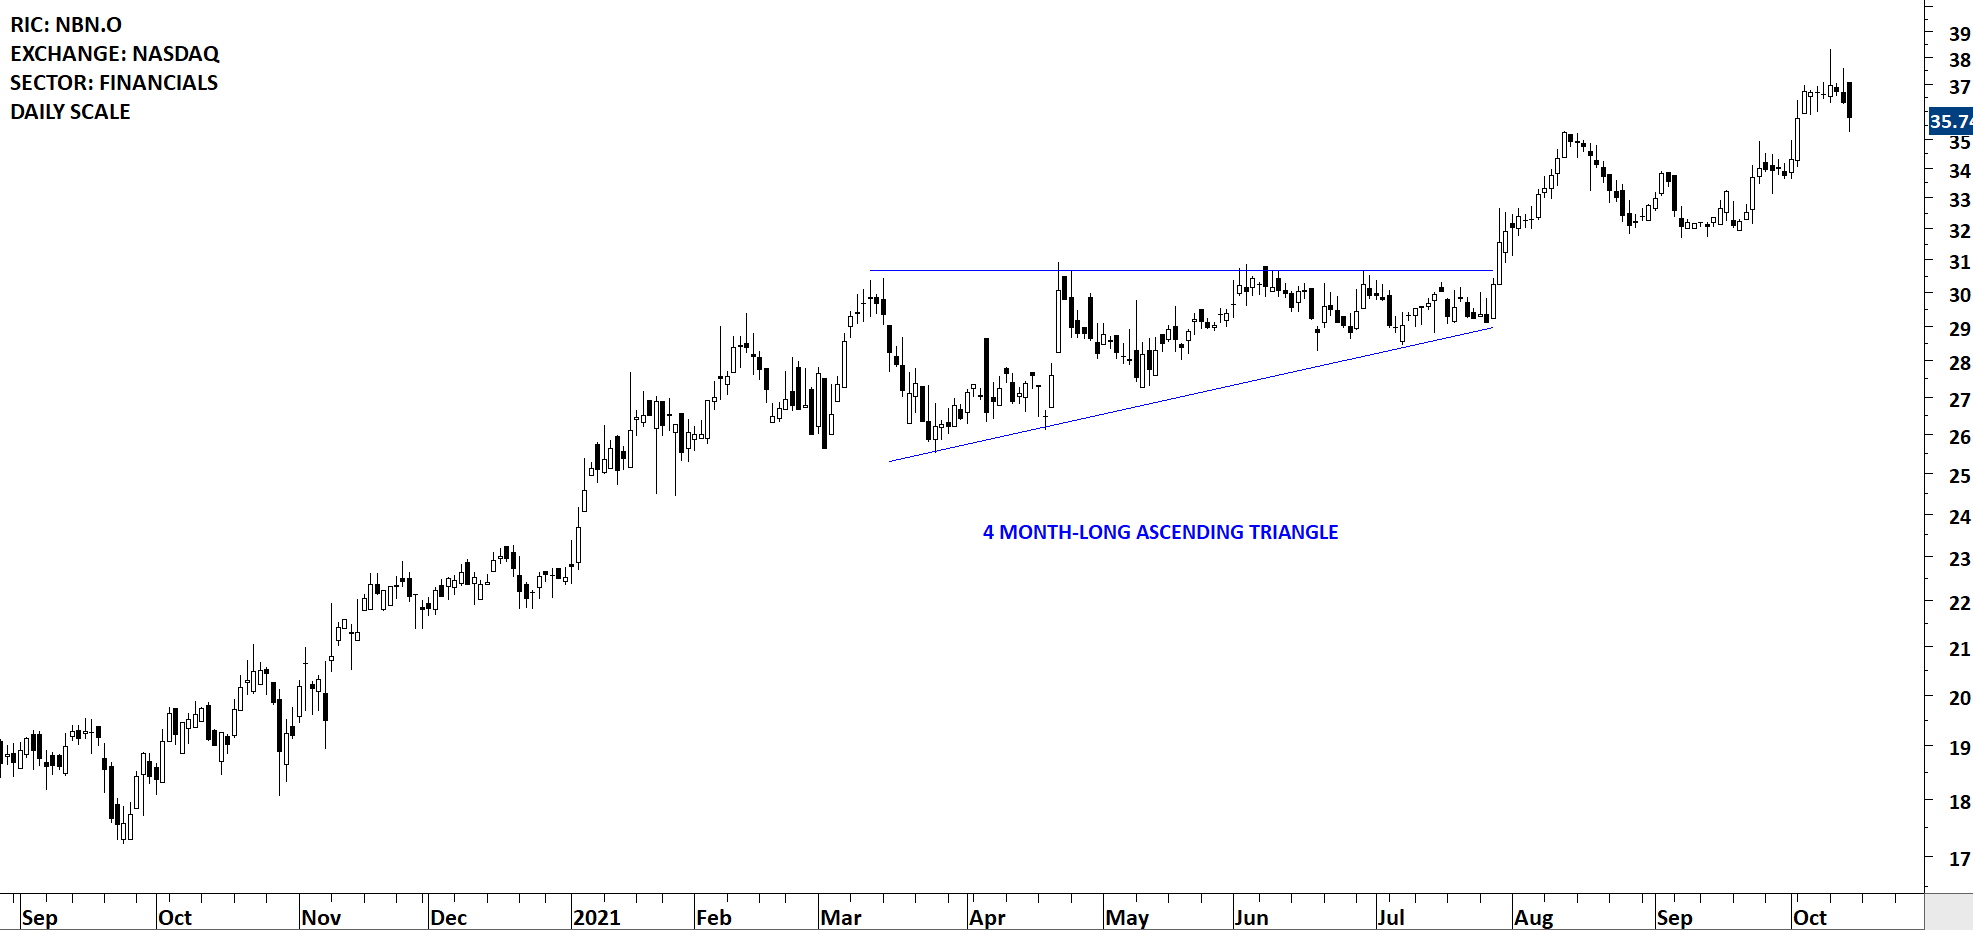
As a bottom reversal, the formation of the ascending triangle can spread over several months. Qualities I look for don’t change. I continue to look for a breakout through the horizontal boundary and also the several tests of the horizontal boundary before the breakout.
Descending triangle is a bearish chart pattern. Its downward sloping upper boundary gives the pattern the bearish bias. Sellers are more impatient at every recovery, pushing the price to a lower level while buyers defend the same horizontal support. Over time the pattern shows the battle between buyers and sellers shifting in favor of sellers. The pattern is completed with a breakdown through the horizontal boundary.
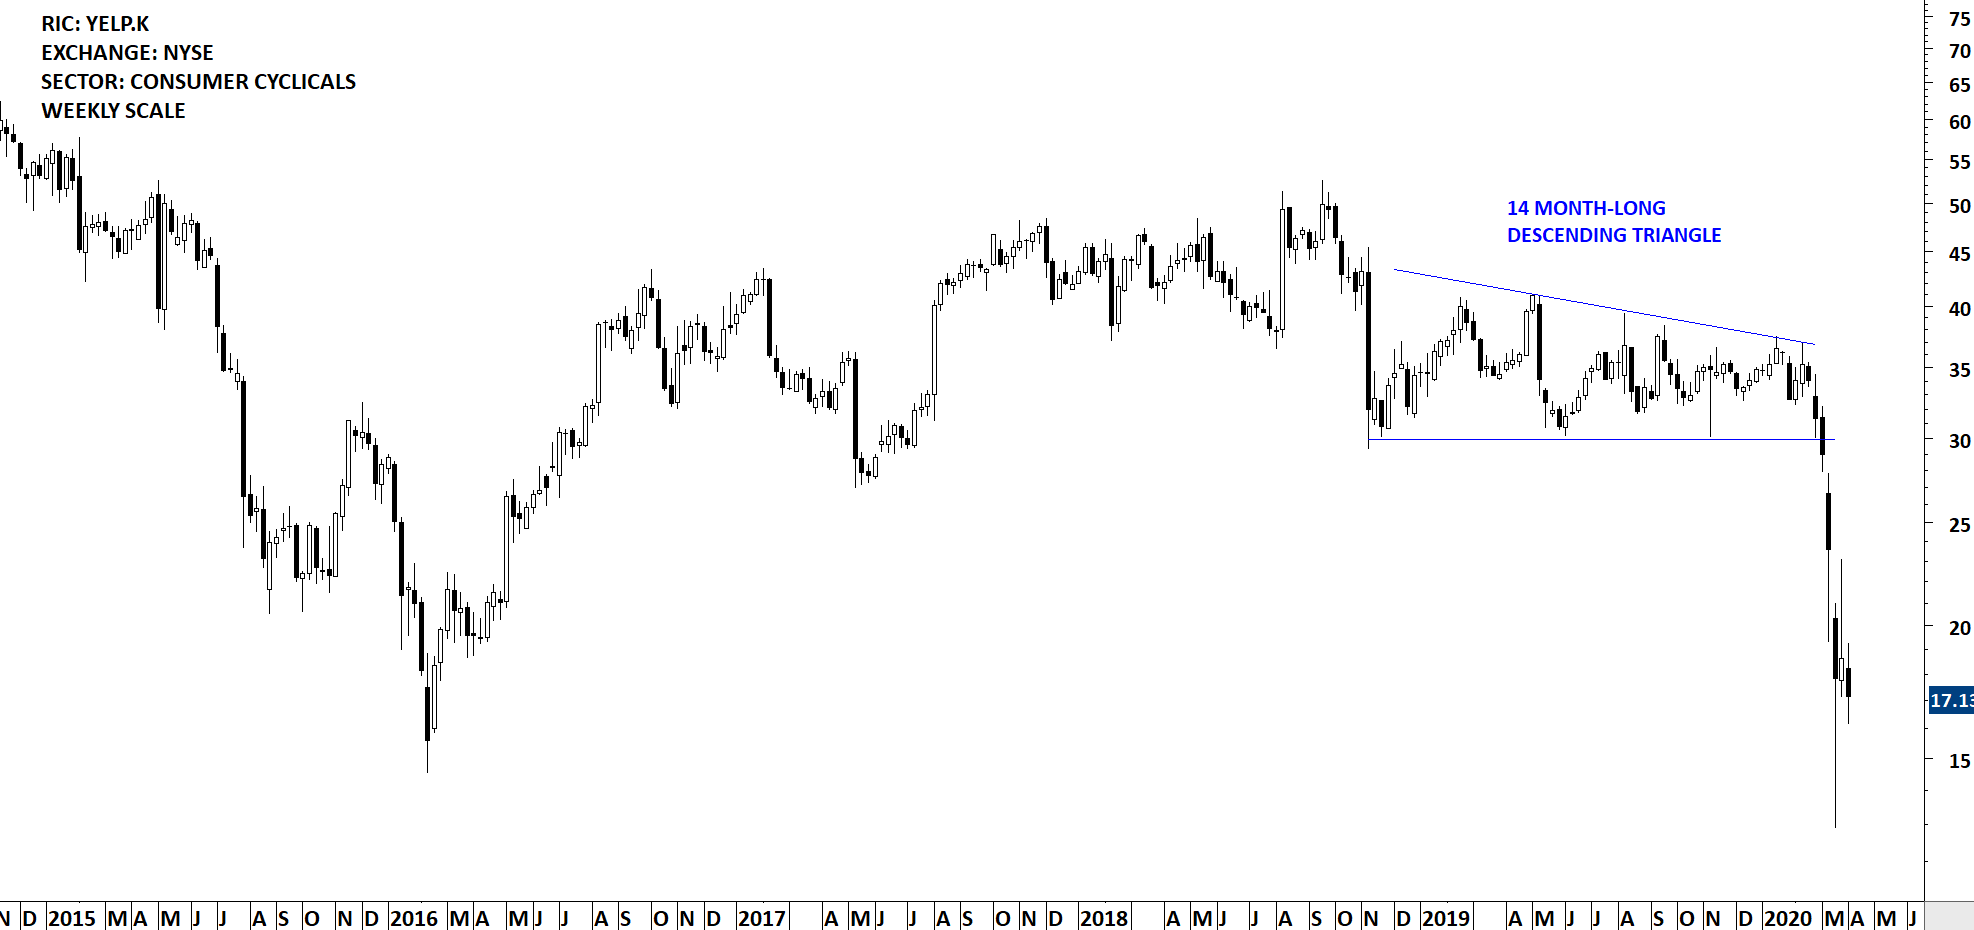
This is how I would draw the descending triangle on the weekly scale price chart of YELP.K. Breakdown took place after the 3 test of the lower boundary.
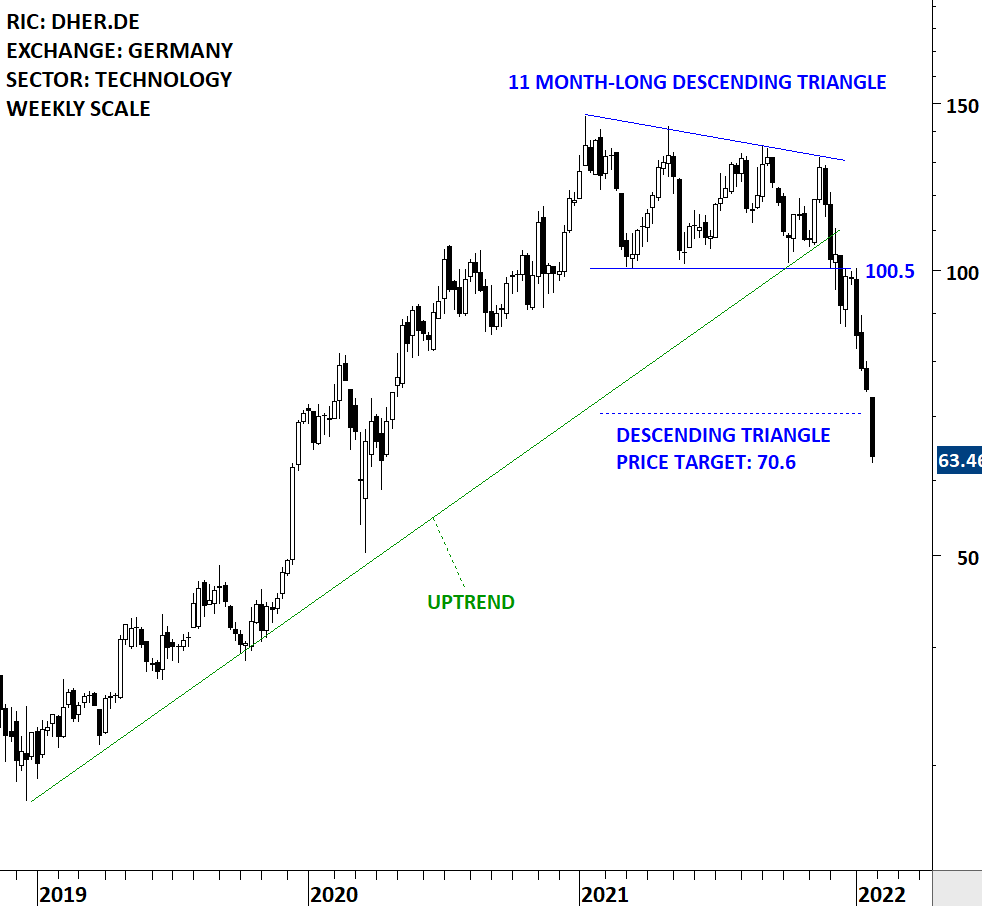
Given its bearish nature, descending triangle can form as a top reversal and the completion of it would forecast lower prices. High conviction setups are as always those with several tests of the horizontal boundary before a breakdown signal.
Tech Charts Membership

By becoming a Premium Member, you’ll be able to improve your knowledge of the principles of classical charting.
With this knowledge, you can merge them with your investing system. In fact, some investors use my analyses to modify their existing style to invest more efficiently and successfully.
Get Access Now
As a Premium Member of Aksel Kibar’s Tech Charts,
You will receive:
-
Global Equities Report. Delivered weekly.
-
Classical charting principles. Learn patterns and setups.
-
Actionable information. Worldwide indices and stocks of interest.
-
Risk management advice. The important trading points of each chart.
-
Information on breakout opportunities. Identify the ones you want to take action on.
-
Video tutorials. How patterns form and why they succeed or fail.
-
Watch list alerts. As they become available so you can act quickly.
-
Breakout alerts. Usually once a week.
-
Access to everything (now and as it becomes available)
o Reports
o Videos and video series
-
Multi-part webinar course. You learn the 8 most common charting principles.
-
Webinars. Actionable and timely advice on breaking out chart patterns.
For your convenience your membership auto renews each year.
Get Access Now