Every week Tech Charts Global Equity Markets report features some of the well-defined, mature classical chart patterns under a lengthy watchlist and the chart pattern breakout signals that took place during that week. Global Equity Markets report covers single stocks from developed, emerging and frontier markets, ETF’s, select commodities, cryptocurrencies and global equity indices. Below chart, CSW Industrials, Inc. is from the breakout alerts section of the weekly report. It is featuring a head and shoulder continuation chart pattern breaking out on weekly scale price charts.
Every week Tech Charts Global Equity Markets report features some of the well-defined, mature classical chart patterns under a lengthy watchlist and the chart pattern breakout signals that took place during that week. Global Equity Markets report covers single stocks from developed, emerging and frontier markets, ETF’s, select commodities, cryptocurrencies and global equity indices. Below chart, CSW Industrials, Inc. is from the watchlist section of the weekly report. It is featuring a head and shoulder continuation chart pattern.
Every week Tech Charts Global Equity Markets report features some of the well-defined, mature classical chart patterns under a lengthy watchlist and the chart pattern breakout signals that took place during that week. Global Equity Markets report covers single stocks from developed, emerging and frontier markets, ETF’s, select commodities, cryptocurrencies and global equity indices. Below chart, Array Technologies, Inc. is from the watchlist section of the weekly report. It is featuring a head and shoulder bottom reversal with the right shoulder as an ascending triangle.
Every week Tech Charts Global Equity Markets report features some of the well-defined, mature classical chart patterns under a lengthy watchlist and the chart pattern breakout signals that took place during that week. Global Equity Markets report covers single stocks from developed, emerging and frontier markets, ETF’s, select commodities, cryptocurrencies and global equity indices. Below chart is from the watchlist section of the weekly report. It is featuring a cup & handle continuation chart pattern on Visa Inc.
Every week Tech Charts Global Equity Markets report features some of the well-defined, mature classical chart patterns under a lengthy watchlist and the chart pattern breakout signals that took place during that week. Global Equity Markets report covers single stocks from developed, emerging and frontier markets, ETF’s, select commodities, cryptocurrencies and global equity indices. Below chart is from the review section of the weekly report. It is featuring a head and shoulder bottom reversal and a cup with handle continuation pattern on the iShares MSCI All Country World Index ETF (ACWI.O).
https://blog.techcharts.net/wp-content/uploads/2023/04/April-29-Featured-Image-II.png430703Aksel Kibarhttps://blog.techcharts.net/wp-content/uploads/2017/05/Tech-Charts-logo-FINAL-CLEAN-340w.pngAksel Kibar2023-04-29 17:05:212023-04-29 17:05:21ISHARES MSCI ALL COUNTRY WORLD INDEX ETF (ACWI.O)
Every week Tech Charts Global Equity Markets report features some of the well-defined, mature classical chart patterns under a lengthy watchlist and the chart pattern breakout signals that took place during that week. Global Equity Markets report covers single stocks from developed, emerging and frontier markets, ETF’s, select commodities, cryptocurrencies and global equity indices. Below charts are from the review section of the weekly report. It is featuring a rectangle chart pattern on Gold ($/ounce).
Every week Tech Charts Global Equity Markets report features some of the well-defined, mature classical chart patterns under a lengthy watchlist and the chart pattern breakout signals that took place during that week. Global Equity Markets report covers single stocks from developed, emerging and frontier markets, ETF’s, select commodities, cryptocurrencies and global equity indices. Below chart is from the watchlist section of the weekly report. It is featuring a rectangle chart pattern on The iShares 20+ Year Treasury Bond ETF.
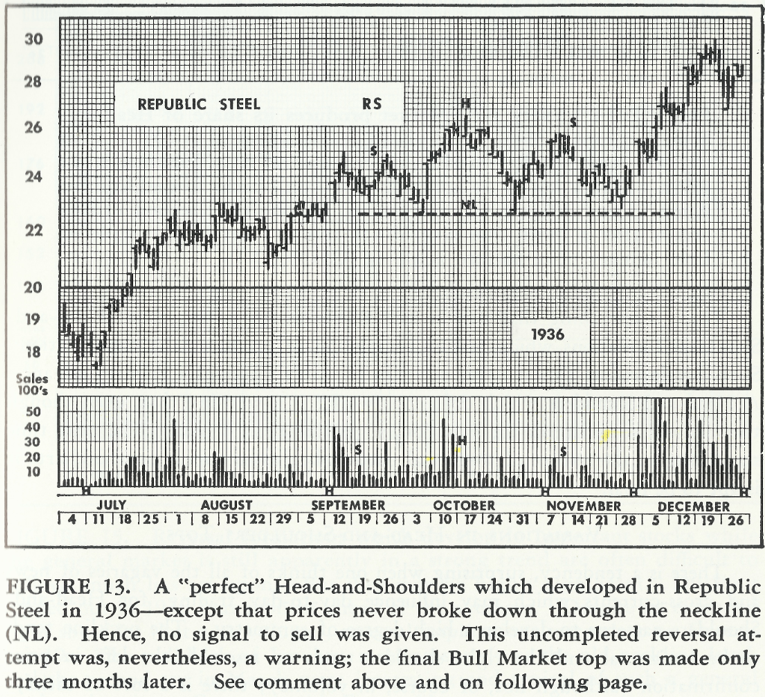
Head and Shoulder top failure can be as valuable as a successful H&S pattern completion. I started keeping statistics for H&S failures and the number of occurrences are increasing to a level which I will soon be able to publish statistically significant numbers.
Edwards & Magee in their book Technical Analysis of Stock Trends discussed H&S failures and used the below example.
In today’s markets we continue to see similar price structures and repetition of classical chart pattern setups that were identified back in 1930s. The H&S top failure in the below short educational video is what I have identified. I highlighted the important levels for chart pattern negation, price target calculation and also the level for long signal.
Short educational video on H&S top failure
Tech Charts Membership
By becoming a Premium Member, you’ll be able to improve your knowledge of the principles of classical charting.
With this knowledge, you can merge them with your investing system. In fact, some investors use my analyses to modify their existing style to invest more efficiently and successfully.
Every week Tech Charts Global Equity Markets report features some of the well-defined, mature classical chart patterns under a lengthy watchlist and the chart pattern breakout signals that took place during that week. Global Equity Markets report covers single stocks from developed, emerging and frontier markets, ETF’s, select commodities, cryptocurrencies and global equity indices. Below chart is from the watchlist section of the weekly report. It is featuring a rectangle chart pattern on Motorola Solutions, Inc.
Every week Tech Charts Global Equity Markets report features some of the well-defined, mature classical chart patterns under a lengthy watchlist and the chart pattern breakout signals that took place during that week. Global Equity Markets report covers single stocks from developed, emerging and frontier markets, ETF’s, select commodities, cryptocurrencies and global equity indices. Below chart is from the breakout section of the weekly report. It is featuring an ascending triangle chart pattern on E-J Holdings Inc.