SNC-LAVALIN GROUP INC (SNC.TO)

Every week Tech Charts Global Equity Markets report features some of the well-defined, mature classical chart patterns under a lengthy watchlist and the chart pattern breakout signals that took place during that week. Global Equity Markets report covers single stocks from developed and emerging markets, ETF’s and global equity indices. The report starts with a review section that highlights the important chart developments on global equity benchmarks. This blog post features a developing chart pattern on SNC-LAVALIN GROUP INC listed on the Toronto Stock Exchange.

Read More

ISHARES MSCI ALL COUNTRY WORLD INDEX ETF

Every week Tech Charts Global Equity Markets report features some of the well-defined, mature classical chart patterns under a lengthy watchlist and the chart pattern breakout signals that took place during that week. Global Equity Markets report covers single stocks from developed and emerging markets, ETF’s and global equity indices. The report starts with a review section that highlights the important chart developments on global equity benchmarks. This blog post features a developing chart pattern on the iShares MSCI All Country World Index ETF listed on the NYSE.

Benchmark for Global equity markets performance, the iShares MSCI All Country World Index ETF (ACWI.O) continues to consolidate in a tight range. Last 4 month’s consolidation can be identified as a possible symmetrical triangle. Symmetrical triangle is a neutral chart pattern. Price can breakout in any direction. Strong resistance stands at 73.90 levels. Support, formed by both the lower boundary of the symmetrical triangle and the 200-day (40-week) moving average stands at 71 levels. Last 4 month’s consolidation is taking place inside the 2 year-long uptrend channel. Long-term trend is upwards. Decisive breakdown below the lower boundary of the symmetrical triangle will not only complete the chart pattern but also breach the boundary of the uptrend channel and the long-term moving average. Such price action will suggest lower levels in the coming weeks. Until we see a decisive breakdown from the symmetrical triangle, we will expect the long-term uptrend to remain intact. A daily close below 70.5 levels will confirm the breakdown from the 4 month-long symmetrical triangle. Breakout above 73.90 levels will resume the uptrend.


Tech Charts Membership

By becoming a Premium Member, you’ll be able to improve your knowledge of the principles of classical charting.

With this knowledge, you can merge them with your investing system. In fact, some investors use my analyses to modify their existing style to invest more efficiently and successfully.

Get Access Now

As a Premium Member of Aksel Kibar’s Tech Charts,

You will receive:

  • Global Equities Report. Delivered weekly.
  • Classical charting principles. Learn patterns and setups.
  • Actionable information. Worldwide indices and stocks of interest.
  • Risk management advice. The important trading points of each chart.
  • Information on breakout opportunities. Identify the ones you want to take action on.
  • Video tutorials. How patterns form and why they succeed or fail.
  • Watch list alerts. As they become available so you can act quickly.
  • Breakout alerts. Usually once a week.
  • Access to everything (now and as it becomes available)
    o Reports
    o Videos and video series
  • Multi-part webinar course. You learn the 8 most common charting principles.
  • Webinars. Actionable and timely advice on breaking out chart patterns.

For your convenience your membership auto renews each year.

Get Access Now


GLOBAL EQUITY MARKETS – May 5, 2018

Dear Tech Chart followers,

Every week Tech Charts Global Equity Markets report features some of the well-defined, mature classical chart patterns under a lengthy watch list and the chart pattern breakout signals that took place during that week. Global Equity Markets report covers single stocks from developed and emerging markets, ETF’s and global equity indices. The report starts with a review section that highlights the important chart developments on global equity benchmarks. Following the breakout alerts and the lengthy watch list, a section on correlation helps members to see the degree of relationship between the stocks and indices in the weekly report.

Below I'm sharing with you a sample report that was published on May 5, 2018. I hope this sample report will give you an idea of what to expect from the weekly Global Equity Markets report that Tech Charts Members receive.


REVIEW


Global equity markets is getting closer to a strong directional movement. Tight consolidations on both the iShares MSCI All Country World Index ETF and the iShares MSCI Emerging Markets Index ETF suggest breakouts can result in a trend period. Consolidations are followed by trends and vice versa. Both ACWI and EEM are trading above their long-term moving averages and inside the boundaries of multi-month long uptrend channels. Breakdown below the long-term averages and the lower boundary of trend channels can result in a larger scale correction. At this point, with the current available information, we can conclude that the long-term uptrend is still intact. We are very close to the completion of last quarter's tight consolidation.

Read More

RECTANGLE – A BREAKOUT OPPORTUNITY

Dear Tech Charts followers,

I hope you have been enjoying the weekly blog posts on Global Equity Markets. The blog posts are part of many other great analysis and educational content Tech Charts membership offers. In celebration of our 1st anniversary and a very successful year, we’re offering everyone one last opportunity to get on board the Tech Charts service at the original launch price.  On June 2nd, our membership price will increase by 20%.

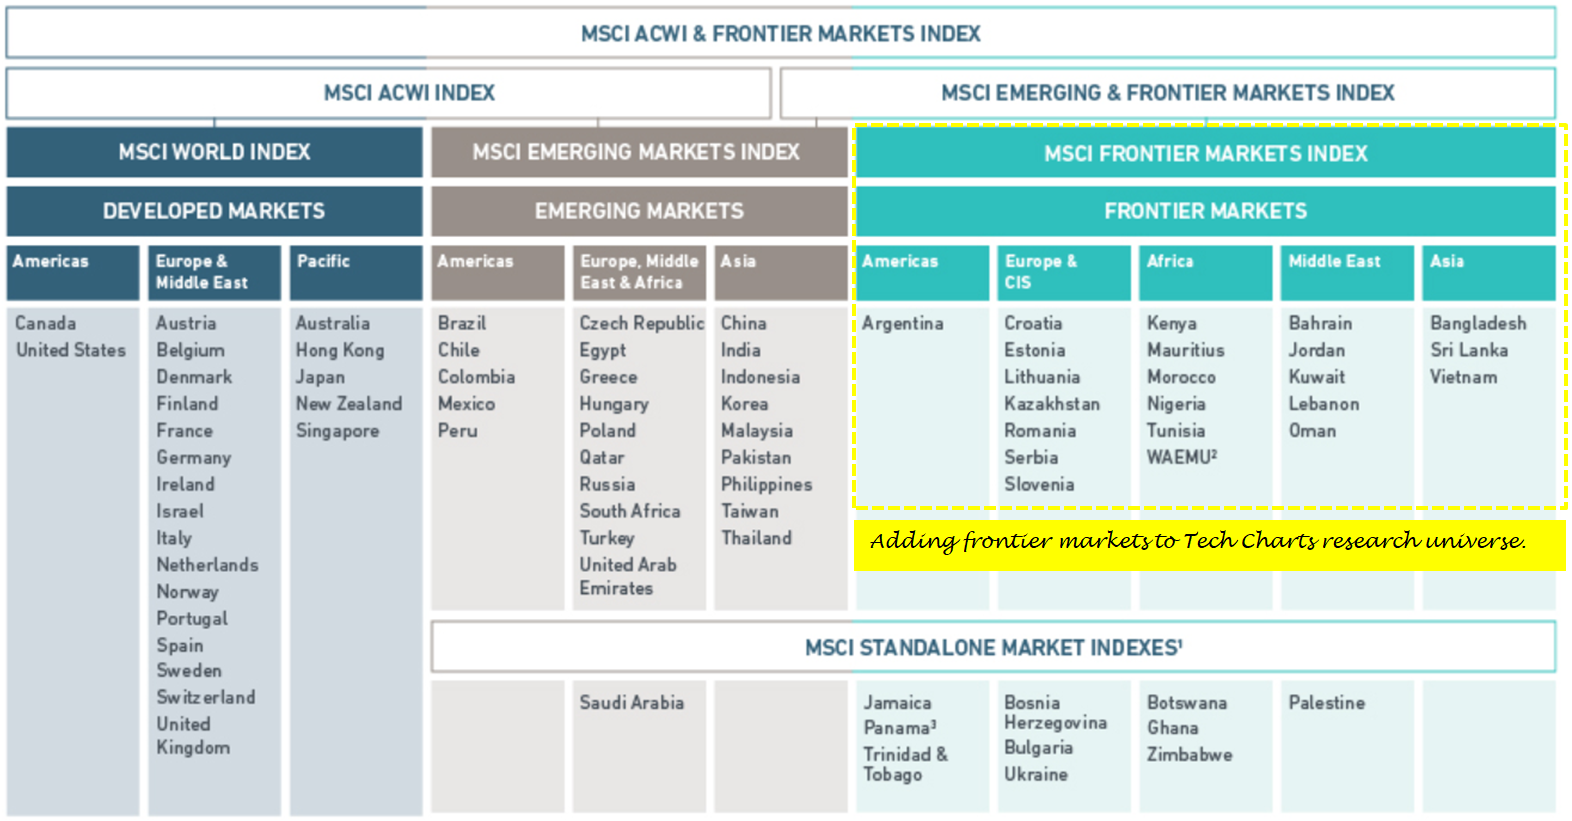
Starting from June 2nd, Global Equity Markets report will also include Frontier Market equities in its research universe. We also plan to expand our educational video tutorials that will benefit members who are new to classical charting and technical analysis. New, step by step video tutorials are being prepared on classical charting principles. I’m excited and motivated to improve our membership service every year.

I hope to build a long lasting relationship with all of our members and hope to serve you in the coming years.

<< Get access to Tech Charts at the original launch price & watch Year in Review Webinar >> 


HYATT HOTELS CORP (H)

Hyatt Hotels Corporation is a global hospitality company. The Company develops, owns, operates, manages, franchises, licenses or provides services to a portfolio of properties. The Company operates through four segments: owned and leased hotels; Americas management and franchising (Americas); ASPAC management and franchising (ASPAC), and EAME/SW Asia management and franchising (EAME/SW Asia). The owned and leased hotels segment consists of its owned and leased full service and select service hotels. The Americas segment consists of its management and franchising of properties located in the United States, Latin America, Canada and the Caribbean. The ASPAC segment consists of its management and franchising of properties located in Southeast Asia, as well as China, Australia, South Korea, Japan and Micronesia. The EAME/SW Asia segment consists of its management and franchising of properties located in Europe, Africa, the Middle East, India, Central Asia and Nepal. The stock is listed on the New York Stock Exchange. Price chart formed a 4 month-long rectangle with the upper boundary acting as strong resistance at 81.75 levels. The upper boundary was tested several times over the course of the chart pattern. A daily close above 83.4 levels will confirm the breakout from the 4 month-long rectangle with the possible chart pattern price target of 88.85 levels.

<< Get access to Tech Charts at the original launch price & watch Year in Review Webinar >> 

DUBAI TRADERS SUMMIT – RECTANGLE

In April 2018, I was invited to share my experiences in charting the Middle East and Africa equity markets at the Dubai Traders Summit. The event was not recorded. I wanted to make this presentation available for our members so I recorded this educational video, featuring parts of the presentation I shared at the event. This section focuses on Rectangle examples. I hope you will find it valuable.

Read More

LEARNING TO IDENTIFY CHART PATTERNS

As part of our member webinars, on the 8th of March 2018 we recorded a live webinar discussing ascending triangle patterns. During the Q&A session one of the Tech Charts members asked this question, "If I’m new to classical charting, what should I do to learn how to identify each pattern?"

We have prepared an excerpt from the webinar. I hope that it will add value in your learning experience. Educational Videos section is expanding rapidly. In the following months we plan not only more educational tutorials on Classical Charting Principles but also videos on the fine points of Technical Analysis.

Read More

EUROPE HEDGED EQUITY FUND (HEDJ.K)


Reminder: 

Both Members and Non-Members are invited to join us for the public webinar on Thursday, May 17, 11am mountain: Tech Charts Year in Review. I will compare the before and after of charts shared with Members over the last year and go through some of the developing chart setups on equities and Global indices. I will also discuss some statistics on chart pattern reliability. As always, we'll end the webinar with a live Q&A.

If you have any questions you'd like to submit, please send them to us via the "Contact" link  under Support on our website.

CLICK HERE to register

Every week Tech Charts Global Equity Markets report features some of the well-defined, mature classical chart patterns under a lengthy watchlist and the chart pattern breakout signals that took place during that week. Global Equity Markets report covers single stocks from developed and emerging markets, ETF’s and global equity indices. The report starts with a review section that highlights the important chart developments on global equity benchmarks. This blog post features a recent breakout opportunity in European equity ETF listed on the NYSE.

Read More

Tech Charts Year in Review with Aksel – Thursday, May 17, 11am mountain

Both Members and Non-Members are invited to join us for this public webinar: Tech Charts Year in Review. Aksel will compare the before and after of charts shared with Members over the last year and go through some of the developing chart setups on equities and Global indices. As always, we’ll end the webinar with a live Q&A.

If you have any questions you’d like to submit, please send them to us via the “Contact” link  under Support on our website.


CLICK HERE to register


CUP & HANDLE BULLISH CONTINUATION

Every week Tech Charts Global Equity Markets report features some of the well-defined, mature classical chart patterns under a lengthy watchlist and the chart pattern breakout signals that took place during that week. Global Equity Markets report covers single stocks from developed and emerging markets, ETF’s and global equity indices. The report starts with a review section that highlights the important chart developments on global equity benchmarks. This blog post features a recent breakout opportunity in U.S. equities from the Breakout Alerts section of the latest weekly Global Equity Markets report. Also below you will find a free educational video on cup & handle classical chart pattern.

Read More

FINLAND OMX HELSINKI 25 INDEX

Every week Tech Charts Global Equity Markets report features some of the well-defined, mature classical chart patterns under a lengthy watchlist and the chart pattern breakout signals that took place during that week. Global Equity Markets report covers single stocks from developed and emerging markets, ETF’s and global equity indices. The report starts with a review section that highlights the important chart developments on global equity benchmarks. This blog post features short and long-term analysis of Finland equity benchmarks and ETF from the review section of the latest weekly Global Equity Markets report.

Read More