
FRONTIER MARKET EQUITIES – KUWAIT
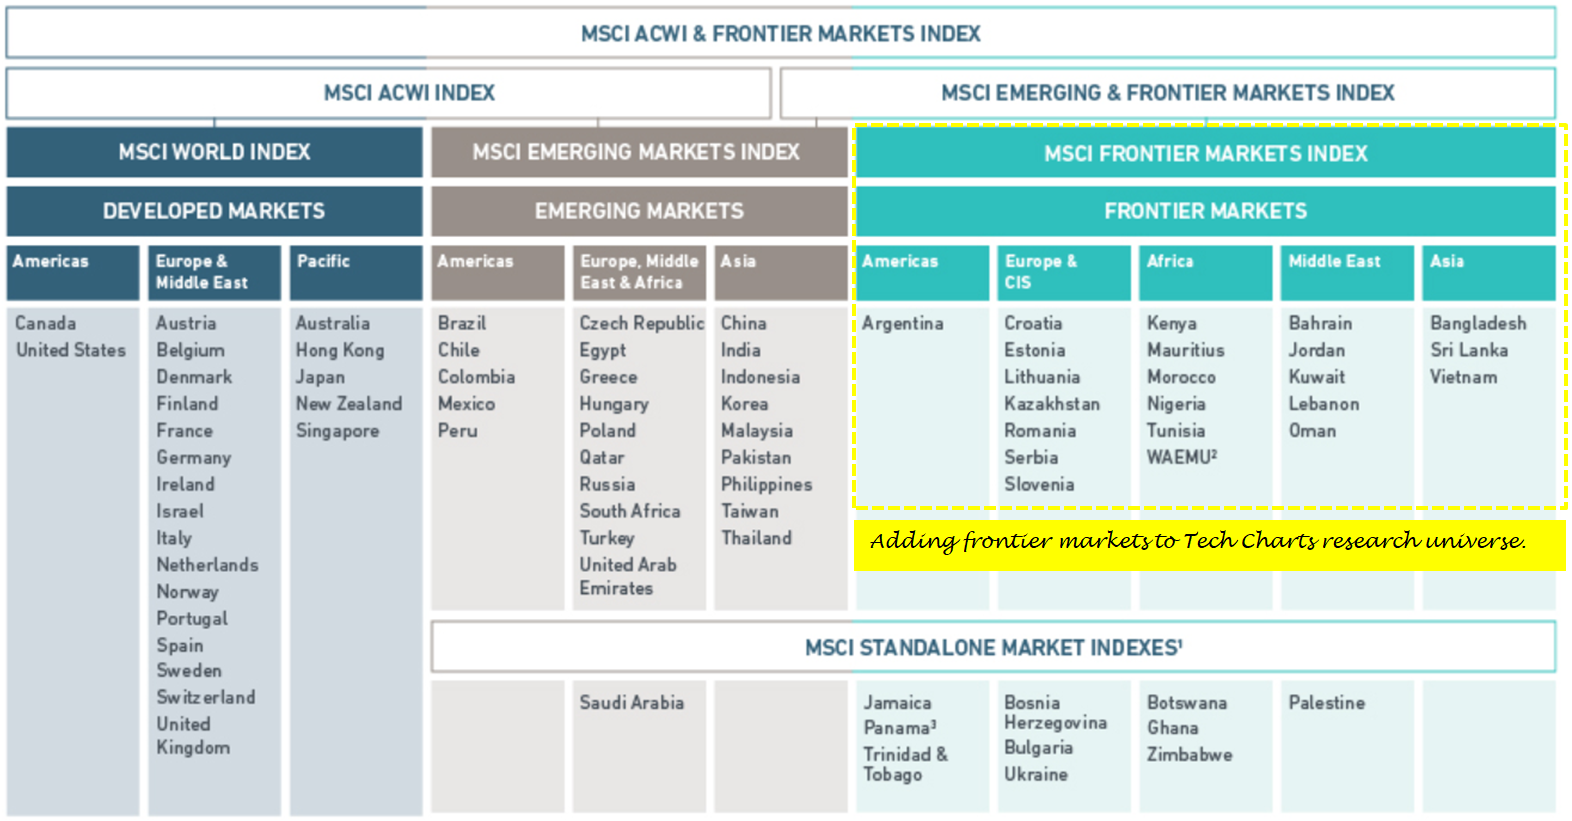
Tech Charts follows the MSCI classification for market research. Below is a table that shows MSCI classification for each market. Over the past year Global Equity Markets report have been covering developing breakout opportunities in Developed and Emerging Markets. In June 2018 we started adding Frontier Markets equities to our research universe and the weekly report. Please note that coverage of a specific market doesn’t mean you will find every equity available in that specific market. Global Equity Markets report features selective number of opportunities only if the price chart has a well-defined and mature classical chart pattern.
Every week Tech Charts Global Equity Markets report features some of the well-defined, mature classical chart patterns under a lengthy watchlist and the chart pattern breakout signals that took place during that week. Global Equity Markets report covers single stocks from developed, emerging and frontier markets, ETF’s and global equity indices. The report starts with a review section that highlights the important chart developments on global equity benchmarks. This blog post features two breakout opportunities in the Frontier Market Equities listed on the Kuwait Stock Exchange. Both equities were featured in the latest Global Equity Markets report.
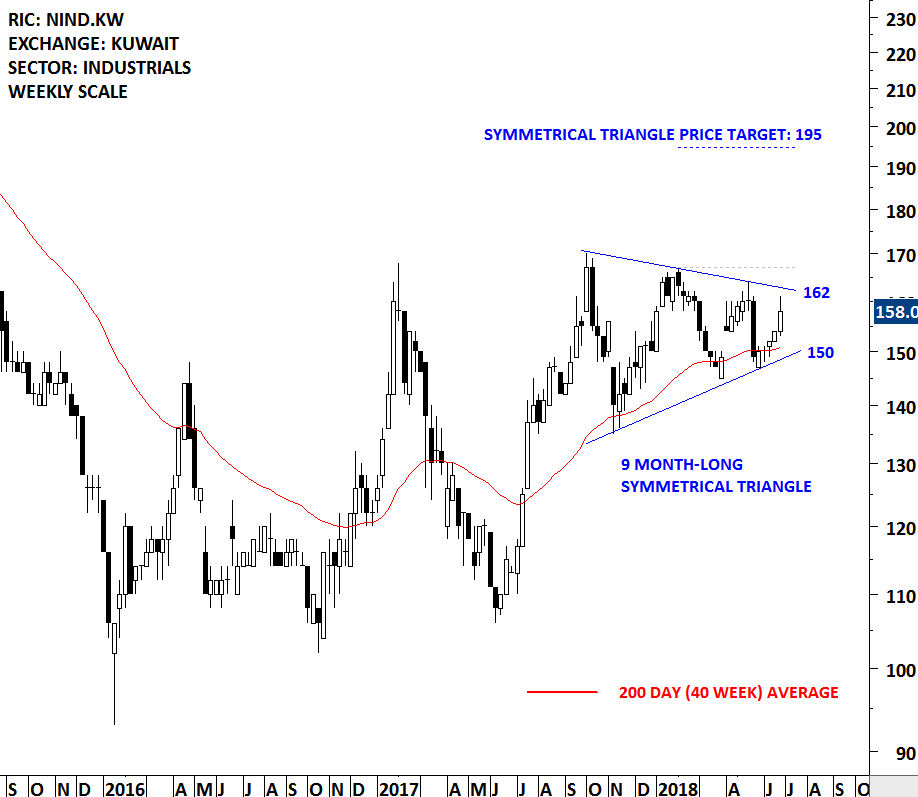
NATIONAL INDUSTRIES GROUP HOLDING KPSC (NIND.KW)
National Industries Group Holding KPSC is a Kuwait-based company engaged in diversified industrial sectors. The Company operates, along with its subsidiaries, in three business segments: Investment, Building materials and Specialist engineering. The Company manages a range of activities in investment and shares, in building materials, petrochemicals, oil & gas services, mechanical industries, utilities, real estate infrastructure, and financial services. The stock is listed on the Kuwait Stock Exchange. Price chart formed a 9 month-long symmetrical triangle with the upper boundary acting as resistance at 162 levels. A daily close above 167 levels will confirm the breakout from the 9 month-long symmetrical triangle with the possible chart pattern price target of 195 levels.
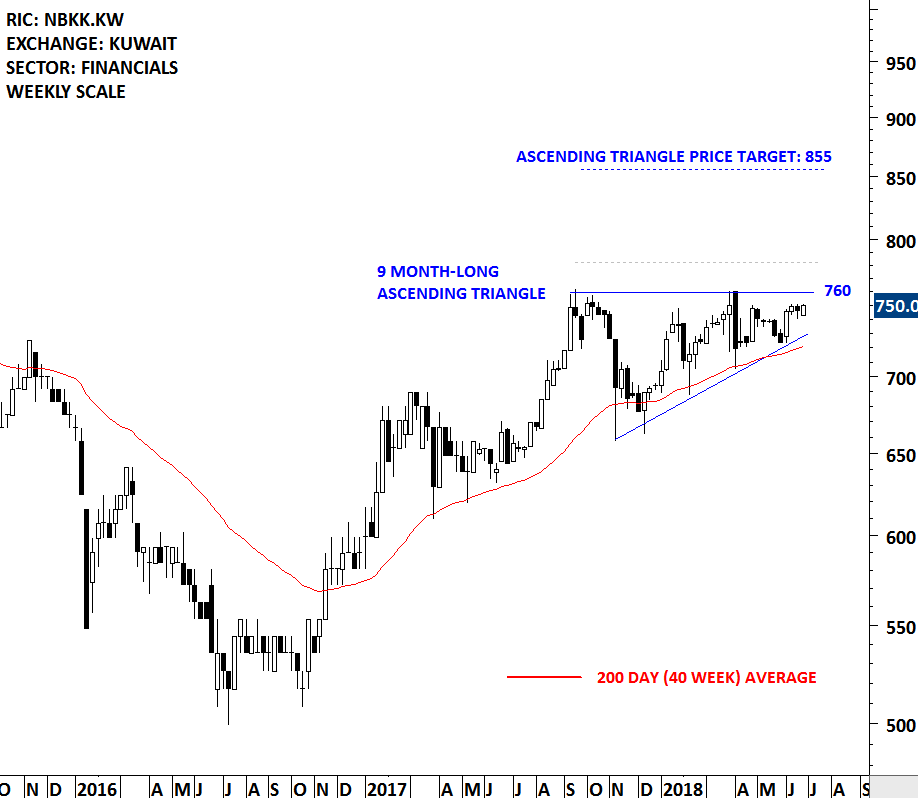
NATIONAL BANK OF KUWAIT SAKP (NBKK.KW)
National Bank of Kuwait SAK (NBK) is a Kuwait-based bank engaged in the provision of banking, financial and investment services. The Bank operates, along with its subsidiaries, through six segments: the Consumer and Private Banking segment provides consumer loans, credit cards, deposits, foreign exchange, other branch related services to individuals and institutional clients; the Corporate Banking segment provides lending, deposits, trade finance, foreign exchange and advisory services to business and corporate customers; the Investment Banking and Asset Management segment provides capital market advisory and execution services, wealth management, asset management, custody, brokerage and research; the Islamic Banking segment serves its clients through its subsidiary, Boubyan Bank KSC; the Group Centre segment includes treasury, investments and other activities, and the International segment includes all branches, subsidiaries and associates outside Kuwait. The stock is listed on the Kuwait Stock Exchange. Price chart formed a 9 month-long ascending triangle with the horizontal boundary acting as strong resistance at 760 levels. A daily close above 782 levels will confirm the breakout from the 9 month-long ascending triangle with the possible chart pattern price target of 855 levels.
Tech Charts Membership

By becoming a Premium Member, you’ll be able to improve your knowledge of the principles of classical charting.
With this knowledge, you can merge them with your investing system. In fact, some investors use my analyses to modify their existing style to invest more efficiently and successfully.

As a Premium Member of Aksel Kibar’s Tech Charts,
You will receive:
-
Global Equities Report. Delivered weekly.
-
Classical charting principles. Learn patterns and setups.
-
Actionable information. Worldwide indices and stocks of interest.
-
Risk management advice. The important trading points of each chart.
-
Information on breakout opportunities. Identify the ones you want to take action on.
-
Video tutorials. How patterns form and why they succeed or fail.
-
Watch list alerts. As they become available so you can act quickly.
-
Breakout alerts. Usually once a week.
-
Access to everything (now and as it becomes available)o Reports
o Videos and video series -
Multi-part webinar course. You learn the 8 most common charting principles.
-
Webinars. Actionable and timely advice on breaking out chart patterns.
For your convenience your membership auto renews each year.


