
S&P 500 HIGH BETA ETF (SPHB.K)
Every week Tech Charts Global Equity Markets report features some of the well-defined, mature classical chart patterns under a lengthy watchlist and the chart pattern breakout signals that took place during that week. Global Equity Markets report covers single stocks from developed, emerging and frontier markets, ETF’s and global equity indices. The report starts with a review section that highlights the important chart developments on global equity benchmarks. This blog post features a symmetrical triangle chart pattern on S&P 500 HIGH BETA ETF (SPHB.K) listed on the New York Stock Exchange.
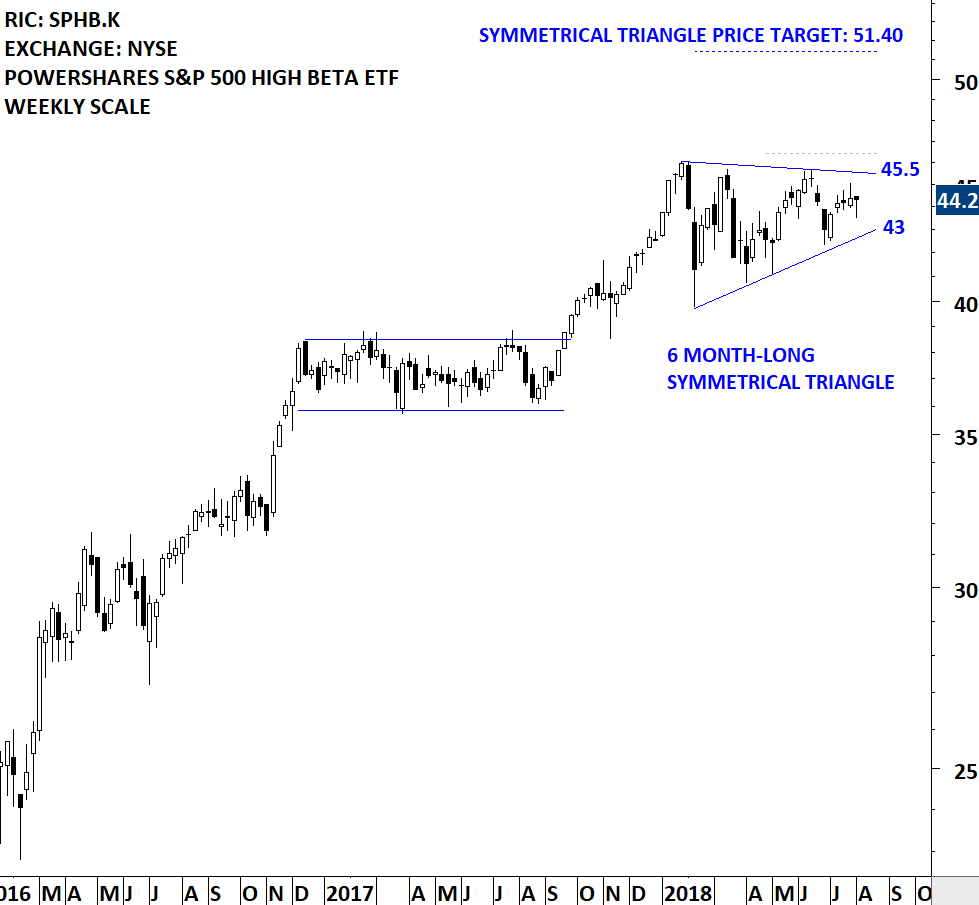
POWERSHARES S&P 500 HIGH BETA ETF (SPHB.K)
The Fund seeks investment results that correspond to the S&P 500 High Beta Index. This Index consists of the 100 stocks from the S&P 500 Index with the highest sensitivity to market movements, or beta, over the past 12 months. The Fund will typically invest at least 90% of its assets in stocks in the Underlying Index. The ETF is listed on the New York Stock Exchange. Price chart formed a 6 month-long symmetrical triangle with the upper boundary acting as resistance at 45.5 levels. A daily close above 46.4 levels will confirm the breakout from the multi-month long sideways consolidation with a possible chart pattern price target of 51.4 levels.
Tech Charts Membership

By becoming a Premium Member, you’ll be able to improve your knowledge of the principles of classical charting.
With this knowledge, you can merge them with your investing system. In fact, some investors use my analyses to modify their existing style to invest more efficiently and successfully.

As a Premium Member of Aksel Kibar’s Tech Charts,
You will receive:
-
Global Equities Report. Delivered weekly.
-
Classical charting principles. Learn patterns and setups.
-
Actionable information. Worldwide indices and stocks of interest.
-
Risk management advice. The important trading points of each chart.
-
Information on breakout opportunities. Identify the ones you want to take action on.
-
Video tutorials. How patterns form and why they succeed or fail.
-
Watch list alerts. As they become available so you can act quickly.
-
Breakout alerts. Usually once a week.
-
Access to everything (now and as it becomes available)o Reports
o Videos and video series -
Multi-part webinar course. You learn the 8 most common charting principles.
-
Webinars. Actionable and timely advice on breaking out chart patterns.
For your convenience your membership auto renews each year.


