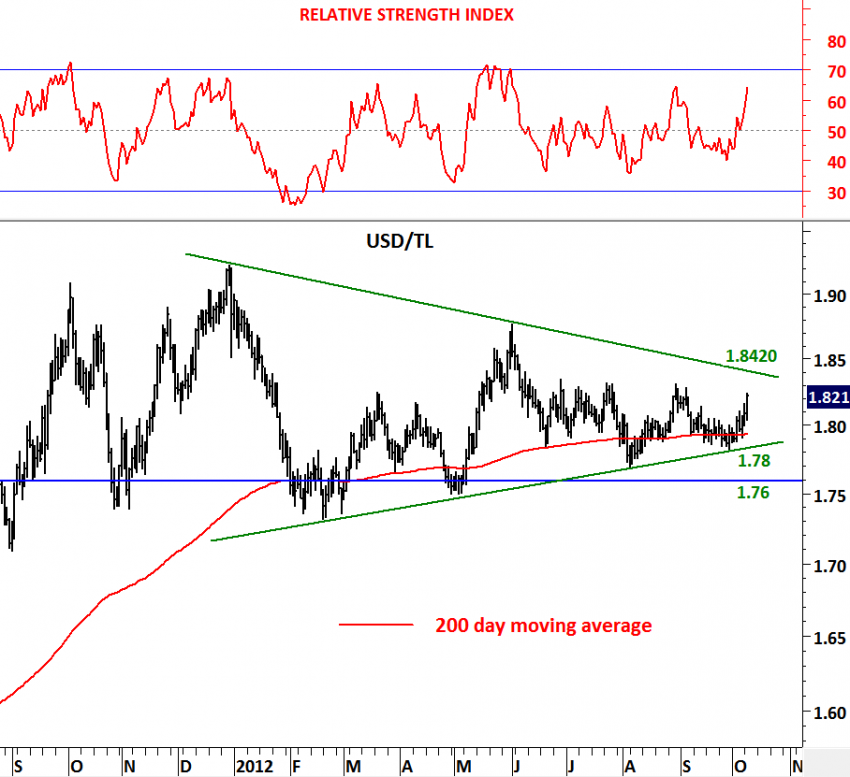
USD/TL
Long-term charts are usually self-explanatory. They lay out the big picture in a clear-cut way. The below long-term chart (decade-long) shows U.S. dollar vs. Turkish Lira. From 2002 to 2011 USD/TL moved between 1.15 and 1.76. This was a wide trading range with several of volatile swings. In the last quarter of 2011 there has been a major change in supply & demand. USD/TL breached 1.76 levels… This was followed by a consolidation above the long-term resistance. Long-term resistance at 1.76 became support.
Not only USD/TL found support at 1.76 levels but also above the 200-day moving average. Over the past year, the consolidation took the shape of a symmetrical triangle. Symmetrical triangle is usually regarded as a continuation chart pattern. The chart below takes a closer look at the symmetrical triangle consolidation between 1.8420 and 1.78. It is now clear that USD/TL will breakout from the year-long contracting range. A breakout on the upside (breaching above 1.8420) will be bullish for the dollar. Unless we see USD/TL below 1.76, we should continue to expect strong USD and weak TL.


