CBOE VOLATILITY INDEX (VIX)
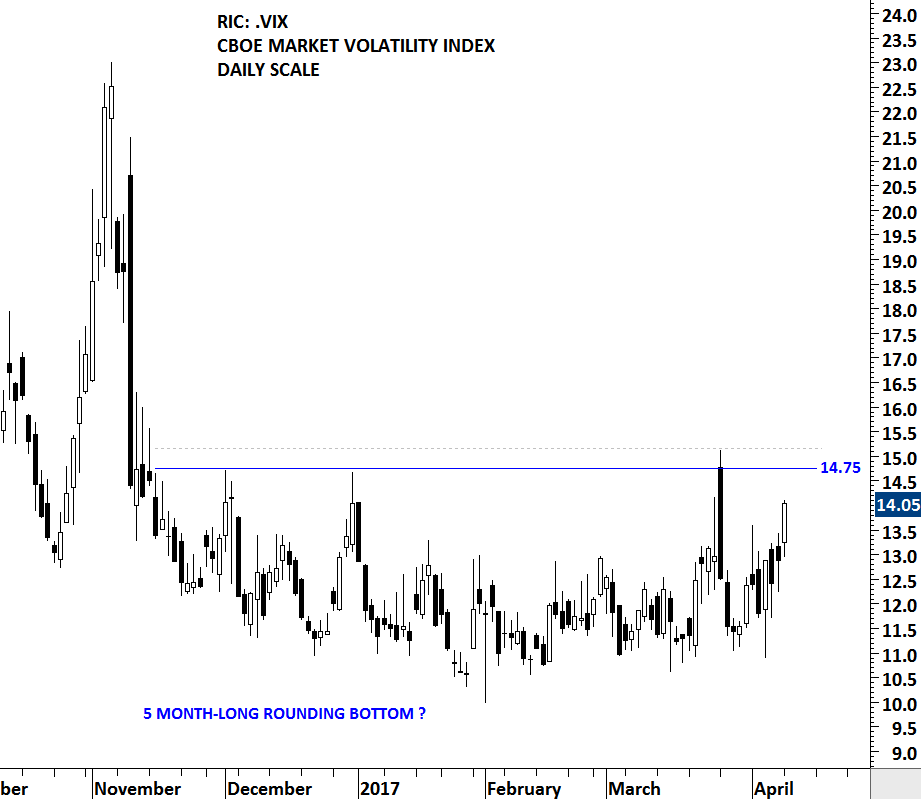
Strong technical support & resistance levels are formed after consecutive tests of the same price level. Support/resistance areas show the battle between the buyers and the sellers. The strong resistance for the CBOE VOLATILITY INDEX (VIX) stands at 14.75 levels. Over the past 5 months, the VIX consolidated between 10 and 15 levels. Price tested the horizontal resistance at 14.75 for 3 times over the course of the 5 month-long consolidation. Since the beginning of April, volatility index has been inching higher towards the strong resistance. A daily close above 15.15 levels can complete the 5 month-long consolidation and result in a spike in volatility. A spike in volatility can put downward pressure on global equity indices. This chart should be on your radar in the coming weeks.


