Dear Tech Charts members,
2017 has been a special year for me. I made several decisions; the most important ones were moving to a new country with my family and launching the Tech Charts membership service. Like with our decisions with trading opportunities, life decisions require the leap of faith. Good or bad, we need to step to the line and take the next opportunity in our life. Without God's blessing and Tech Charts members support this wouldn't have come to fruition. I've taken this challenge and enjoyed every part of it and I look forward continuing to add value to your decision making and learning experience in the field of classical charting principles and technical analysis.
In the beginning of every year I wish health for family members, friends and their loved ones. Tech Charts community has become a family. I wish all of you a healthy New Year.
Kind regards,

REVIEW
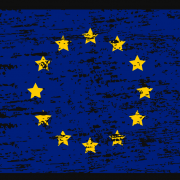
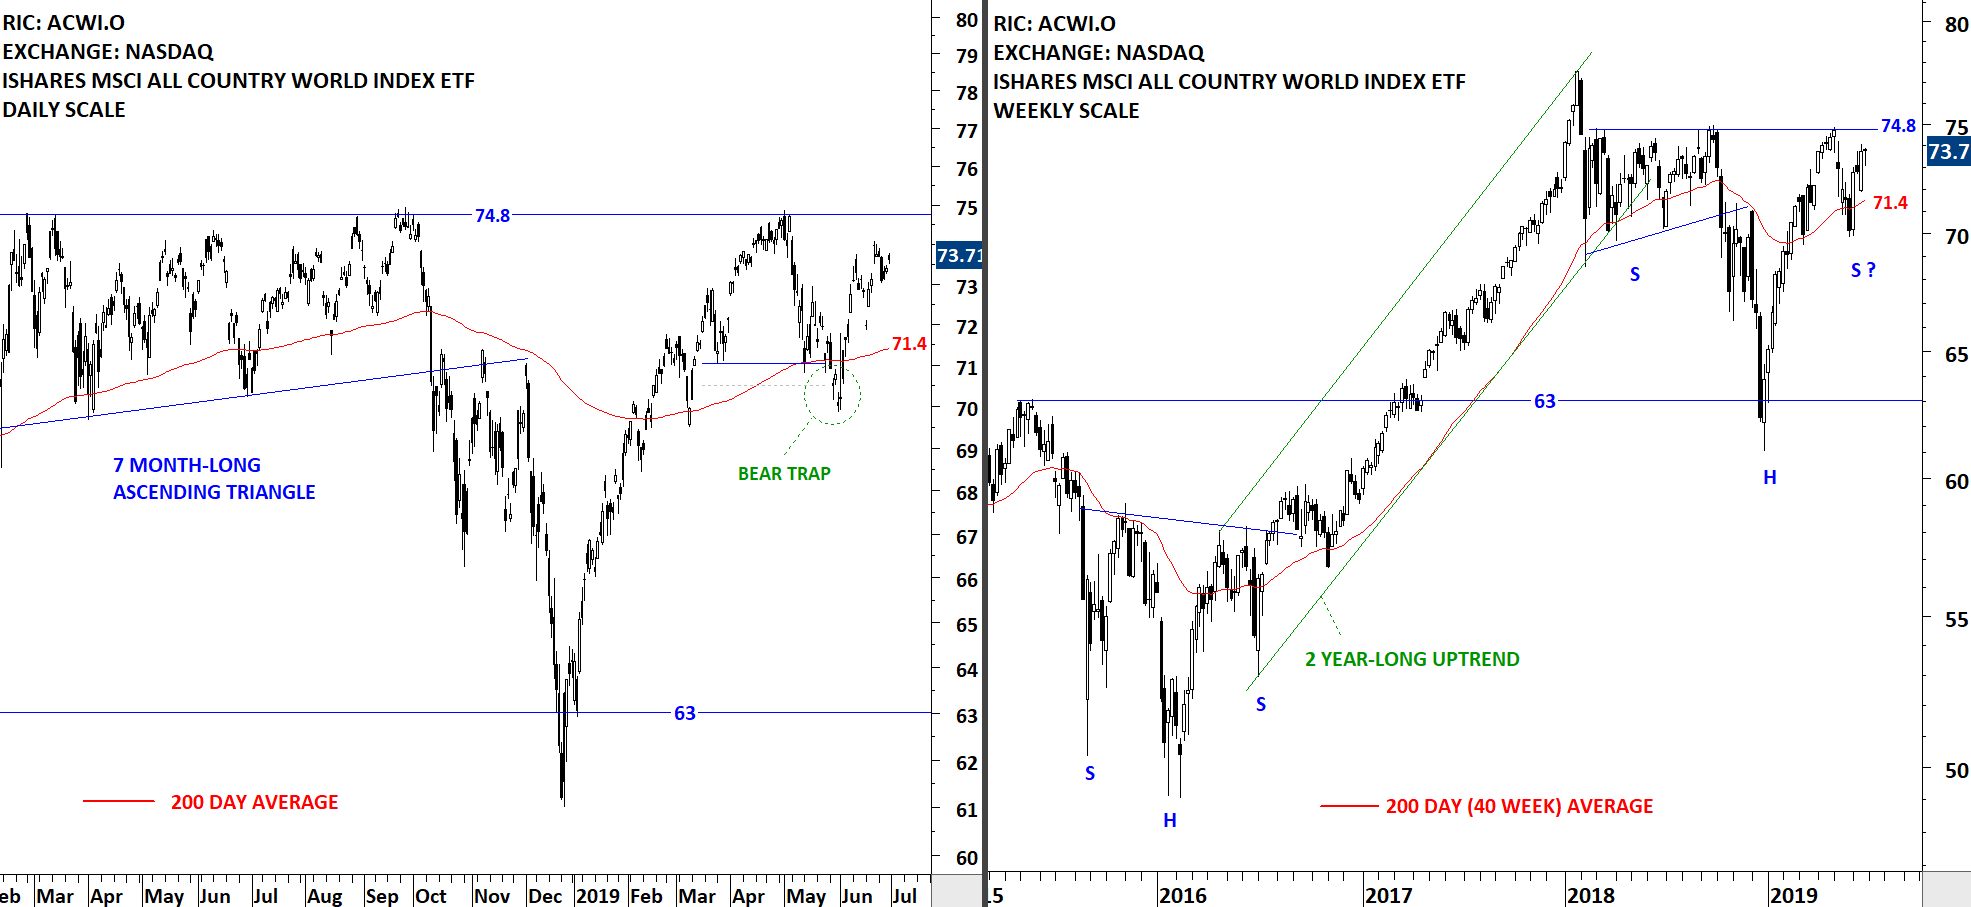
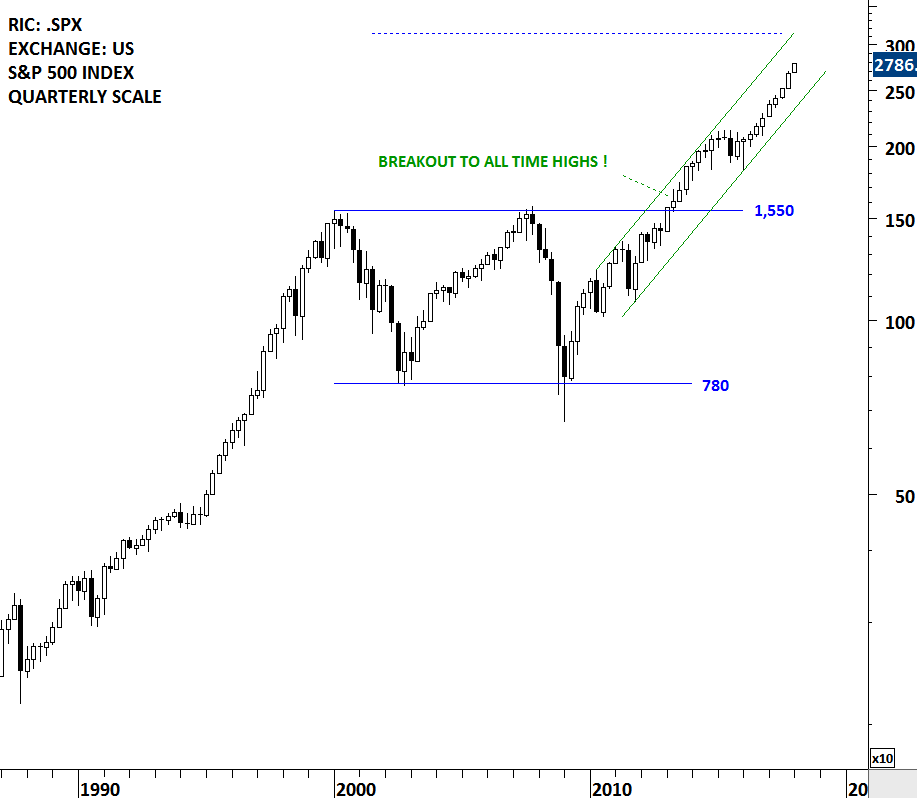
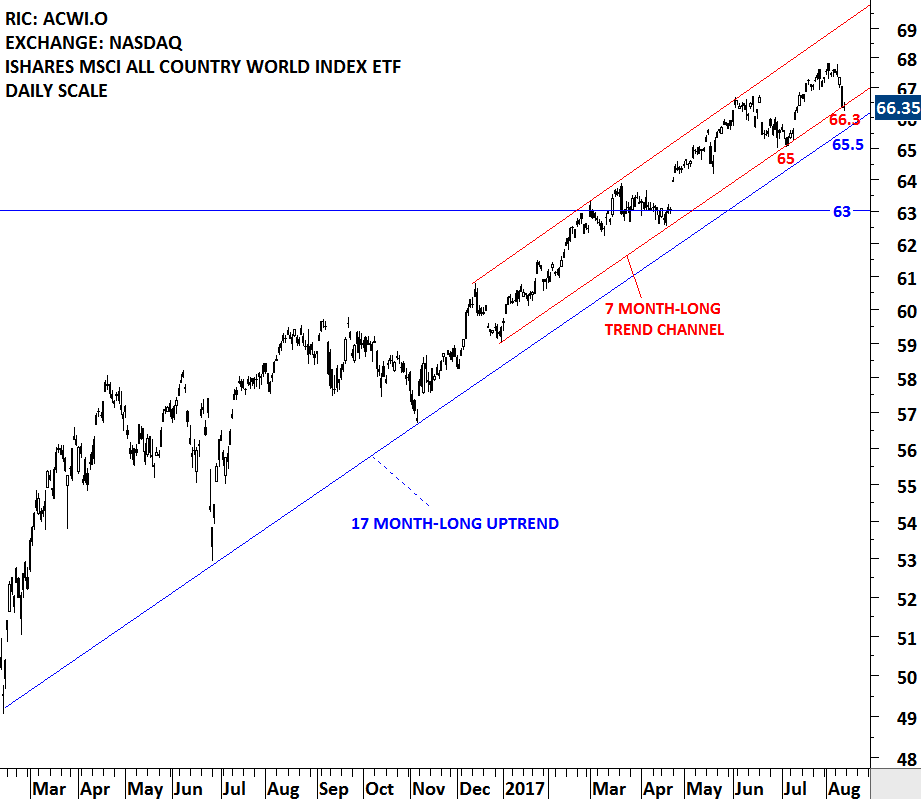
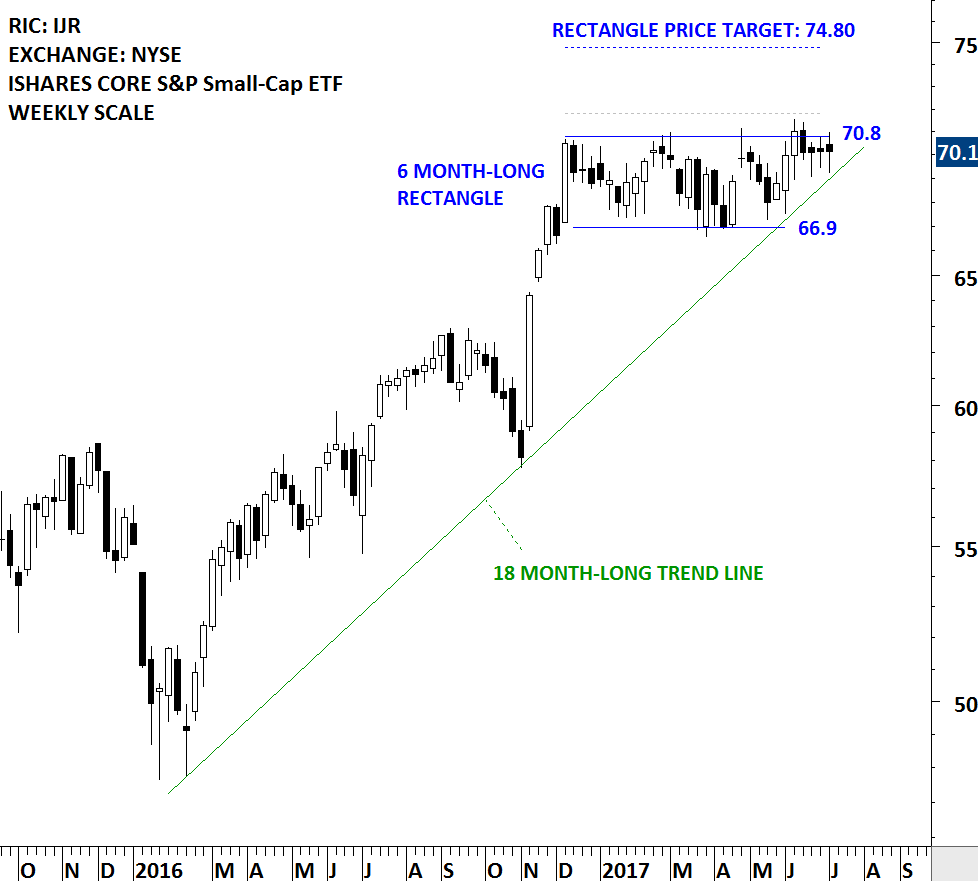
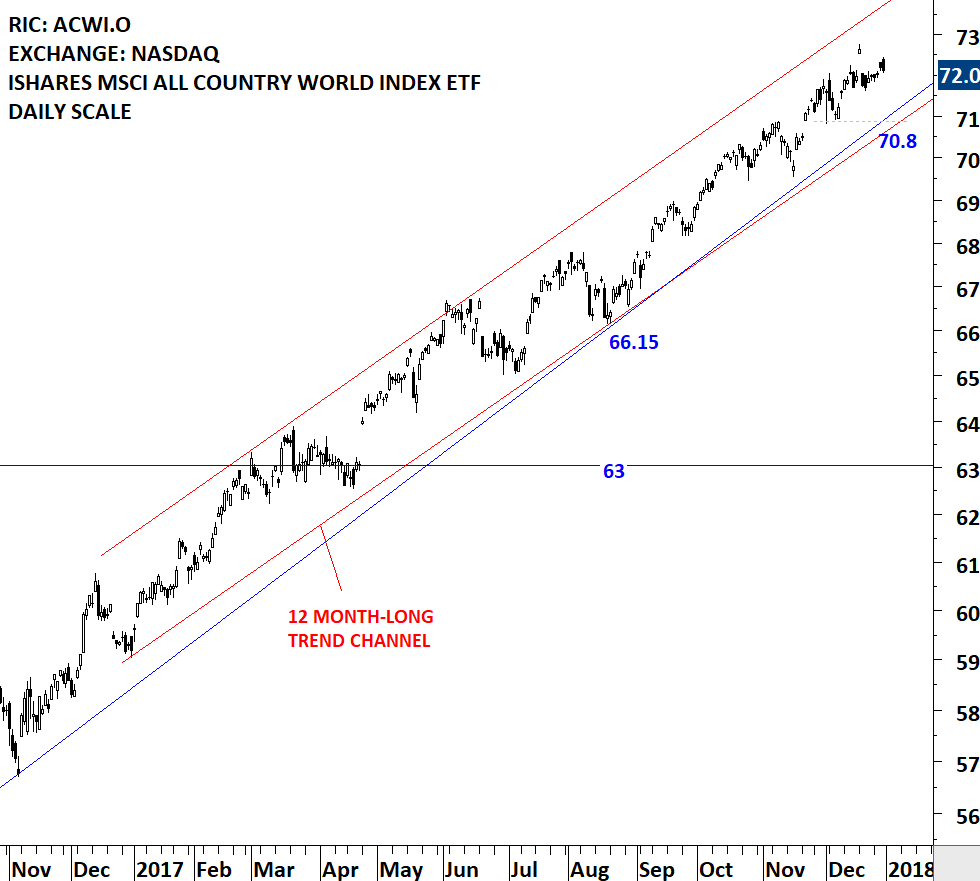
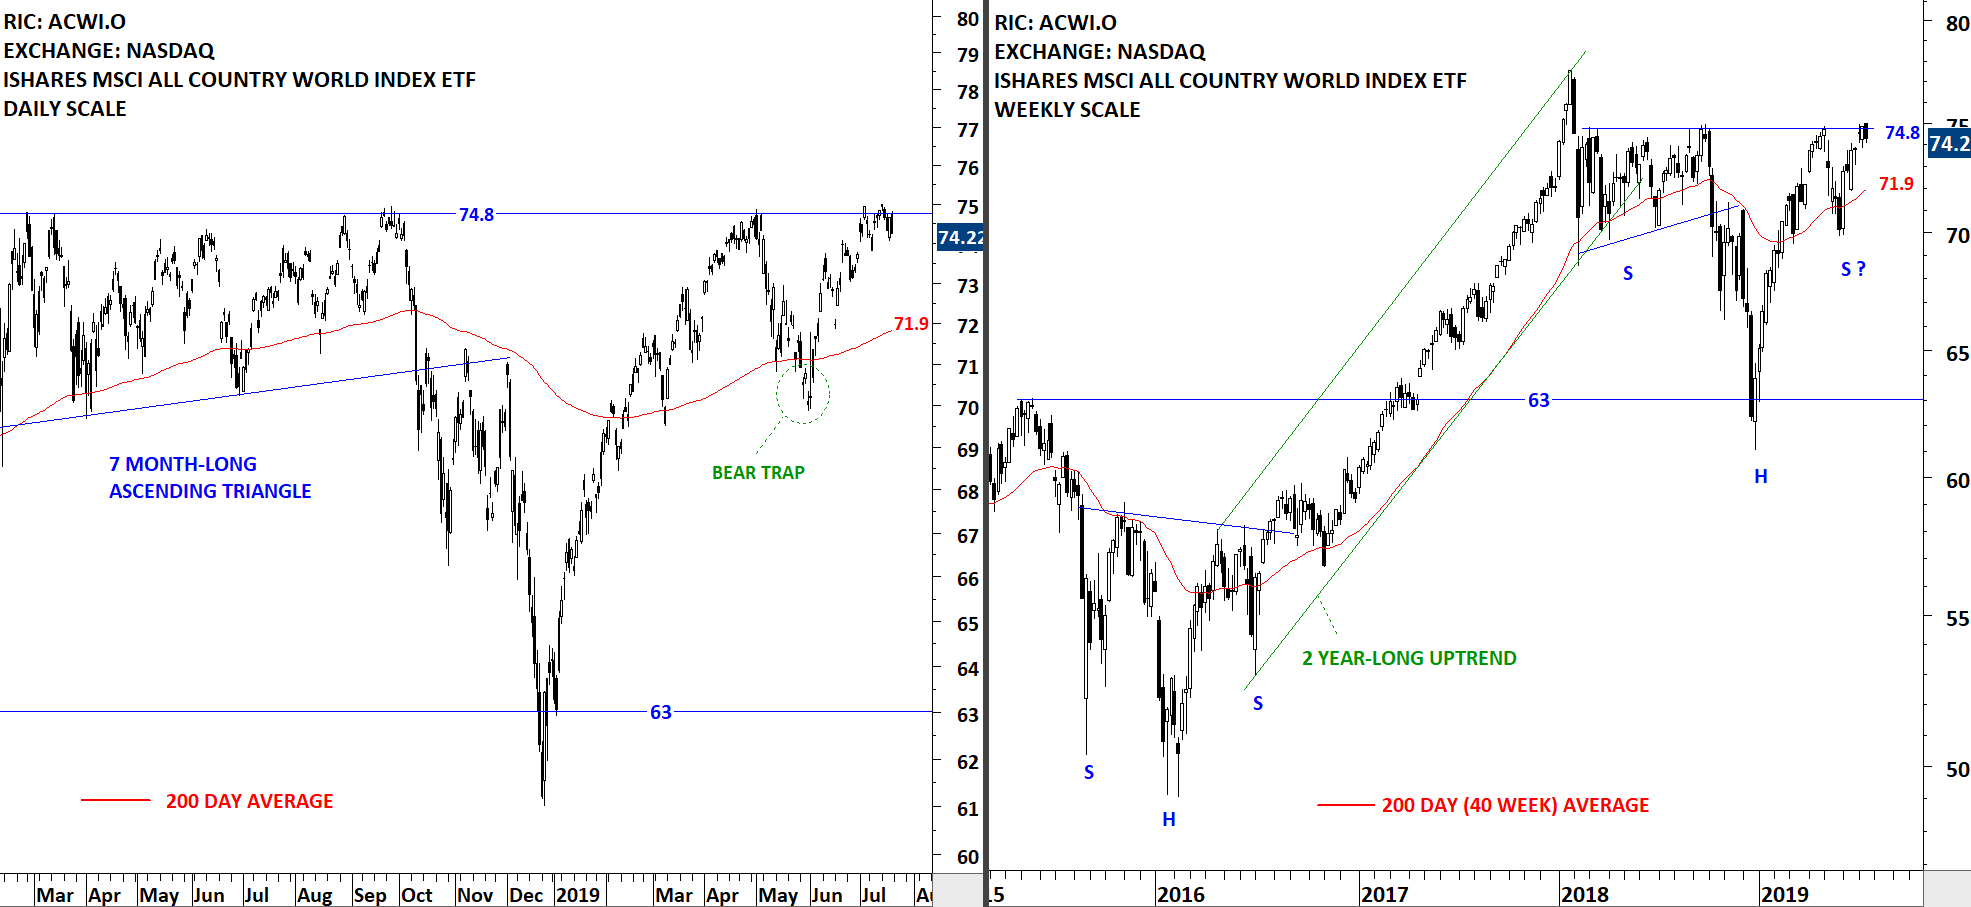
2017 was a strong year for Global Equity Markets. In the second quarter of 2017, iShares MSCI All Country World Index ETF broke out to all-time highs. The daily price chart formed a year-long upward trend channel and the steady uptrend resumed between the boundaries of the steep trend channel. Over the past month the ACWI ETF formed a minor low which now acts as a short-term support at 70.80 levels. Both the 20 month-long uptrend and the year-long trend channel are still intact.
 Read More
 Read More