Posts

GLOBAL EQUITY MARKETS – November 3, 2018

REVIEW


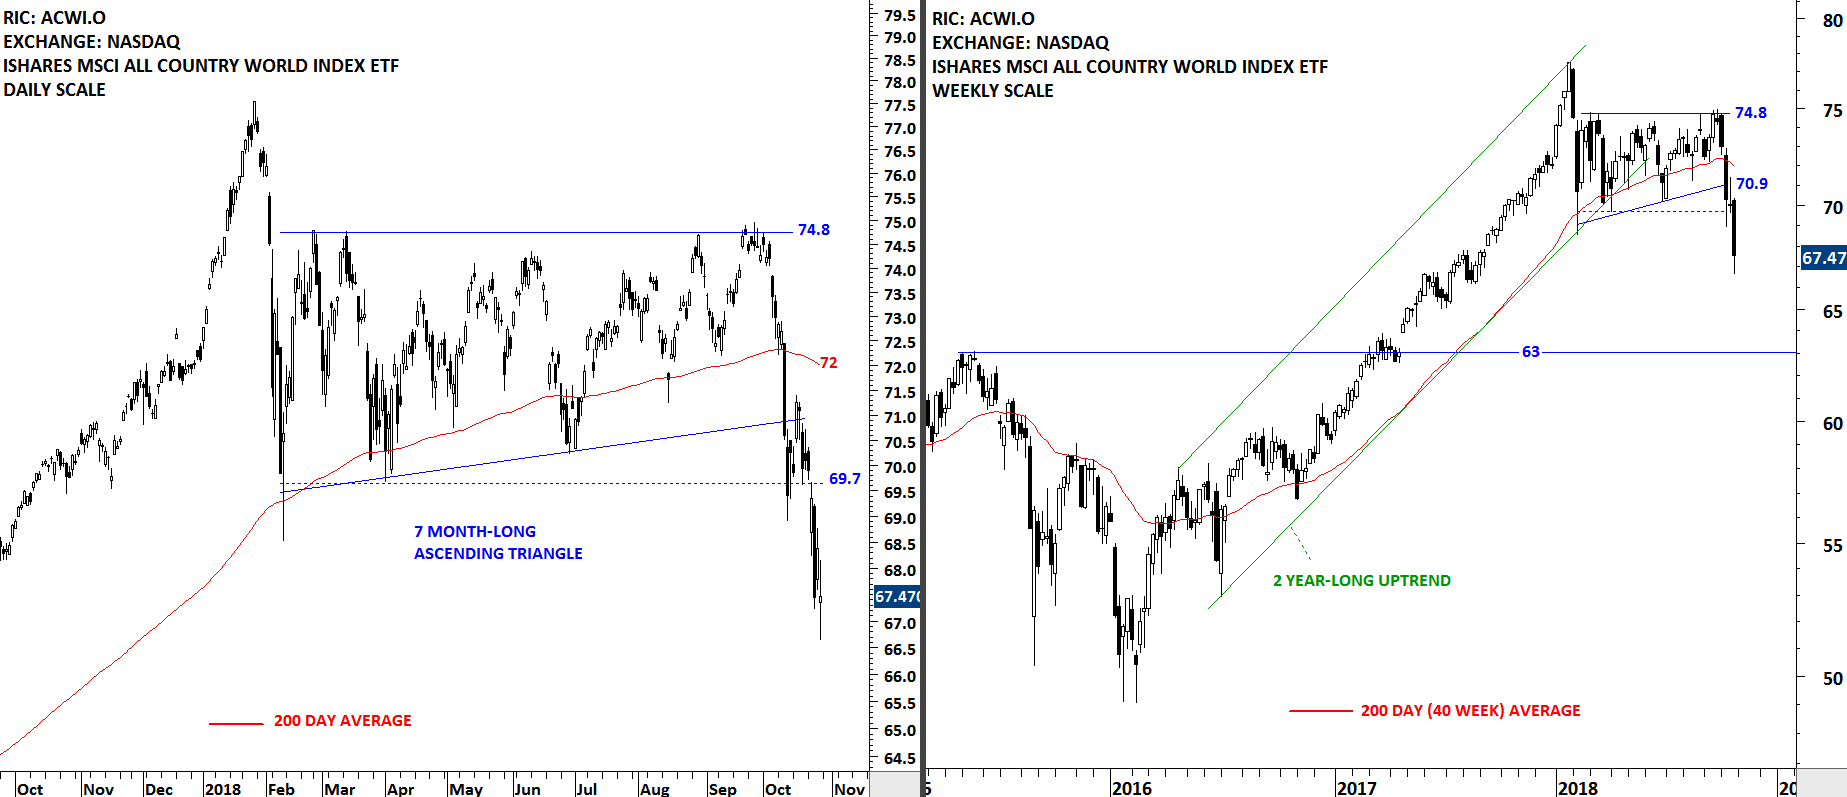
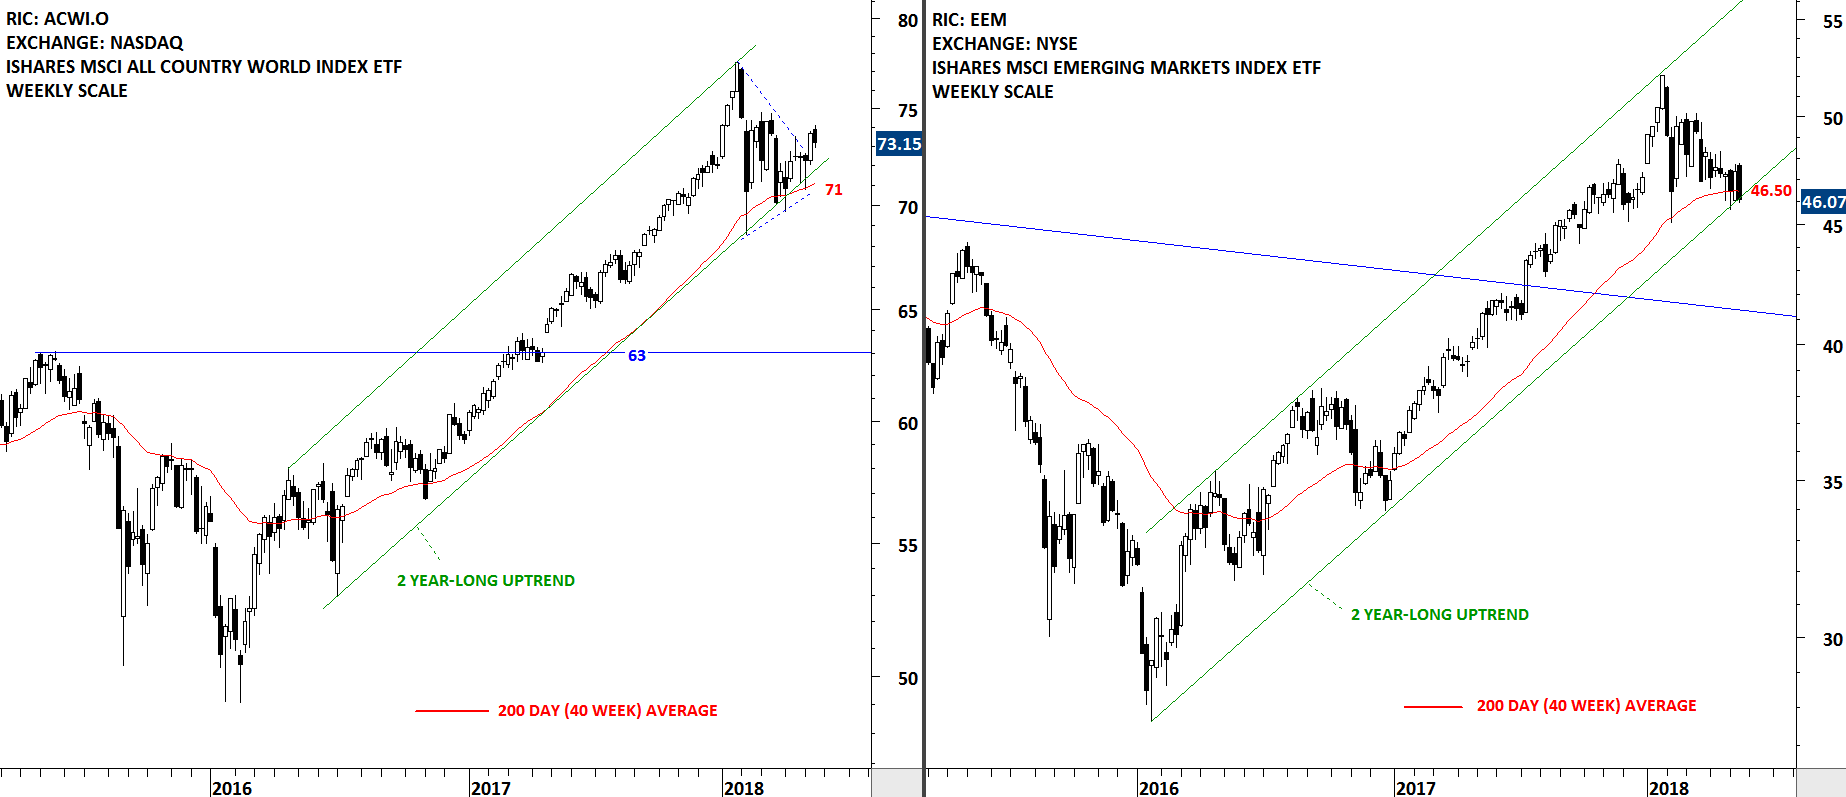
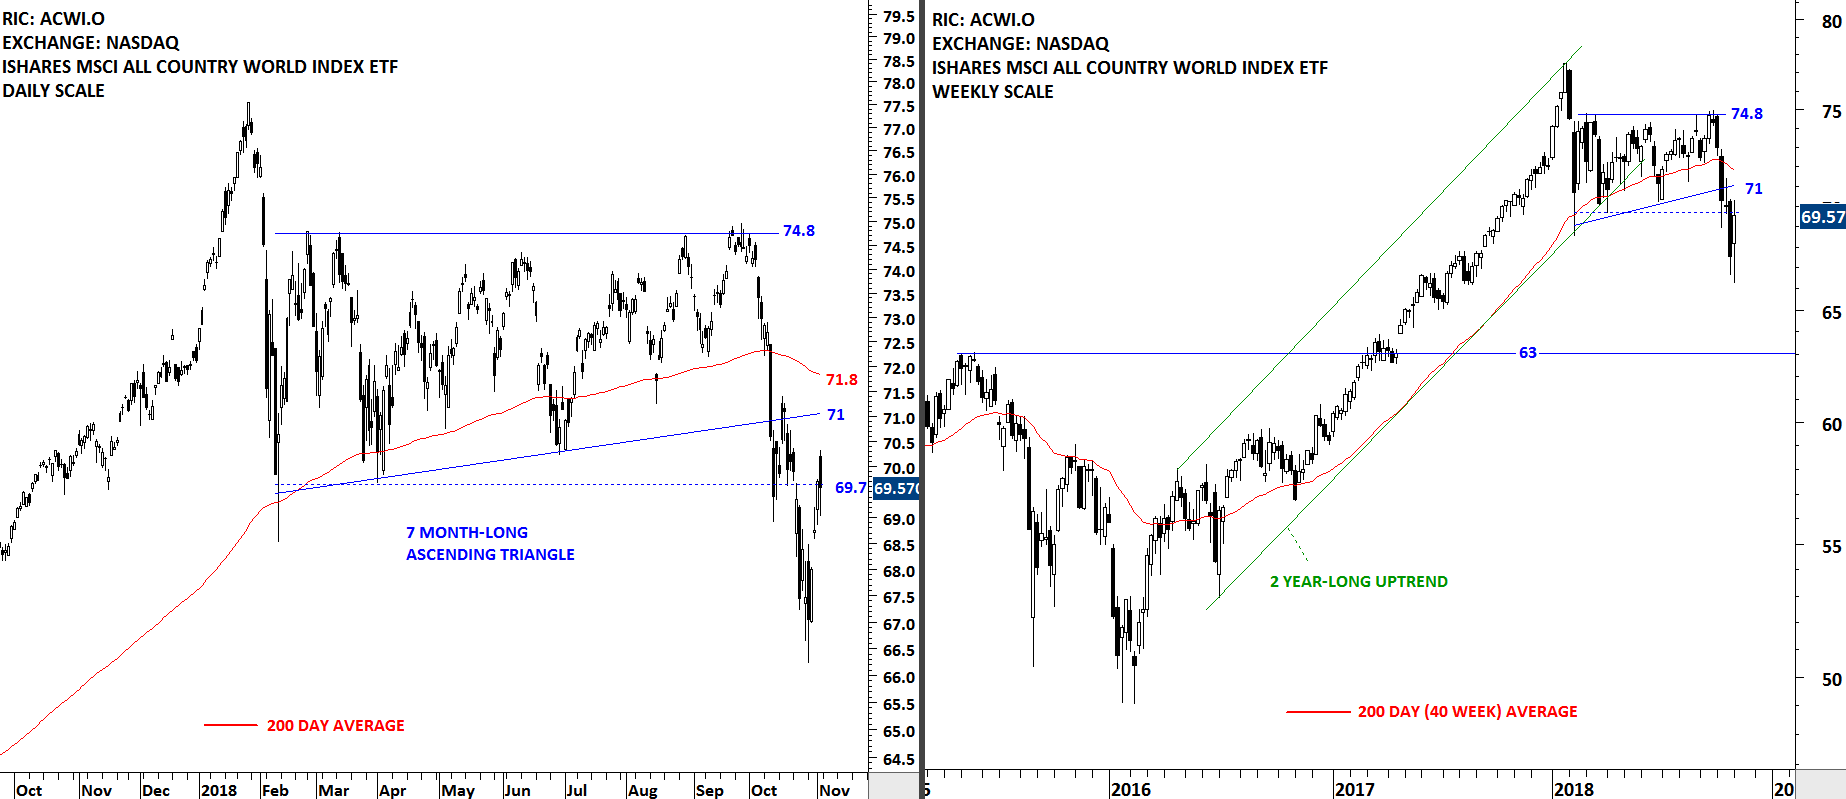
Strong rebound on the iShares MSCI All Country World Index ETF pulled the price back to February lows. Strong resistance area stands between 70 and 71.8 levels. After a sharp drop and increase in volatility, we should expect more choppy price action resulting in a short-term consolidation. There is no chart pattern development that would suggest a short-term bottom at this stage. The ACWI ETF is trading below its long-term average.

Read More

GLOBAL EQUITY MARKETS – October 27, 2018

REVIEW


The benchmark for Global equity markets performance, iShares MSCI All Country World Index ETF (ACWI.O) broke down its February lows with a long weekly candle. The ACWI ETF is now clearly below its long-term 200-day moving average. February low at 69.7 levels will become the new strong resistance. Next support area for the ACWI ETF is between 63 and 65. In the short-term the daily chart needs to form some sort of a reversal chart pattern to conclude that the downtrend is over. The iShares MSCI All Country World Index ETF (ACWI.O) is in a downtrend.

Read More

GLOBAL EQUITY MARKETS – October 13, 2018

REVIEW


Since the beginning of 2018, the performance between Emerging Markets and Developed Markets diverged. Emerging Markets have underperformed the Developed Markets by around 15%. Two charts below show the relative performance ratio between EEM and ACWI and also the MSCI indices, MSCI Emerging Markets Index vs. MSCI World Markets Index. You can see the fluctuations on the ratio over the years.

2016-2017 was a period of EM outperformance. In the beginning of 2018, the ratio reversed sharply and the past 10 months resulted in a massive underperformance for the Emerging Markets. We might be at an inflection point as the ratio is now testing 2016 lows. Emerging Markets might start outperforming the Developed Markets once again. (The ratio is calculated by dividing two time series EEM & ACWI and indexing it to 1 on the 1st January 2018)

Read More

GLOBAL EQUITY MARKETS – August 18, 2018

REVIEW


Global Equity Markets continue to remain in a range. The iShares MSCI All Country World Index ETF (ACWI.O) is possibly forming a 6 month-long symmetrical triangle with the upper boundary acting as resistance at 74 and the lower boundary as support at 70.5 levels. Breakout from this lengthy consolidation range will result in a directional move.

Read More

GLOBAL EQUITY MARKETS – July 28, 2018

REVIEW


The iShares MSCI All Country World Index ETF (ACWI.O) found resistance at the upper boundary of its 5 month-long consolidation. Last 5 month's price action can be identified as a possible symmetrical triangle with the upper boundary acting as resistance at 74 levels and the lower boundary as support at 70.4 levels. I track ACWI ETF to measure Global equity markets performance. Price continues to remain range-bound.

Read More

GLOBAL EQUITY MARKETS – July 14, 2018

REVIEW


Until a chart pattern is mature and ready to resolve in one direction we have to make minor adjustments to the chart pattern boundaries. (Learn more: Morphology) Dealing with chart patterns and breakouts in real-time is difficult compared to labeling chart patterns on price charts in hindsight. Corrective periods are more tricky compared to trend periods because market corrections are periods of indecision between buyers and sellers whereas trend periods show consensus. The iShares MSCI All Country World Index ETF (ACWI.O) is going through a corrective period. The 5 month-long choppy sideways movement is possibly forming a symmetrical triangle between the boundaries of 70.4 and 74. This week's price action pushed the ETF above its long-term average. For the long-term uptrend to resume, price should remain above the 200 day-average.

Read More

GLOBAL EQUITY MARKETS – June 2, 2018

REVIEW


Benchmark for Global equity markets performance, the iShares MSCI All Country World Index ETF (ACWI.O) continues to consolidate in a tight range. Last 4 month's consolidation can be identified as a possible symmetrical triangle. Symmetrical triangle is a neutral chart pattern. Price can breakout in any direction. Strong resistance stands at 73.90 levels. Support, formed by both the lower boundary of the symmetrical triangle and the 200-day (40-week) moving average stands at 71 levels. Last 4 month's consolidation is taking place inside the 2 year-long uptrend channel. Long-term trend is upwards. Read More

GLOBAL EQUITY MARKETS – May 19, 2018

REVIEW


We are seeing a decoupling in terms of performance in the Global Equity Markets. Developed markets continue to remain strong whereas Emerging markets start to weaken. The charts below show both the iShares MSCI All Country World Index ETF and the iShares MSCI Emerging Markets Index ETF in a steady uptrend. However, over the past few weeks, the iShares MSCI All Country World Index ETF managed to rebound from its long-term average but the iShares MSCI Emerging Markets Index ETF struggled around the strong support area. Failure to recover from strong support area can result in a breakdown and larger scale correction for the Emerging Markets. The iShares MSCI Emerging Markets Index ETF is testing the 200-day (40 week) moving average.

Read More