Posts

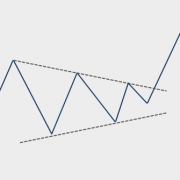
SYMMETRICAL TRIANGLE – DIAGONAL CHART PATTERN

Every week Tech Charts Global Equity Markets report features some of the well-defined, mature classical chart patterns under a lengthy watchlist and the chart pattern breakout signals that took place during that week. Global Equity Markets report covers single stocks from developed, emerging and frontier markets, ETF’s and global equity indices. The report starts with a review section that highlights the important chart developments on global equity benchmarks. This blog post features from the breakout section a symmetrical triangle. Breakout signal was confirmed few weeks back and since then the stock has possibly completed a pullback. This chart is a good example to discuss the dynamics of breakouts from diagonal chart patterns. Below you will also find a short educational video on how breakouts can develop after completing symmetrical triangle chart patterns.

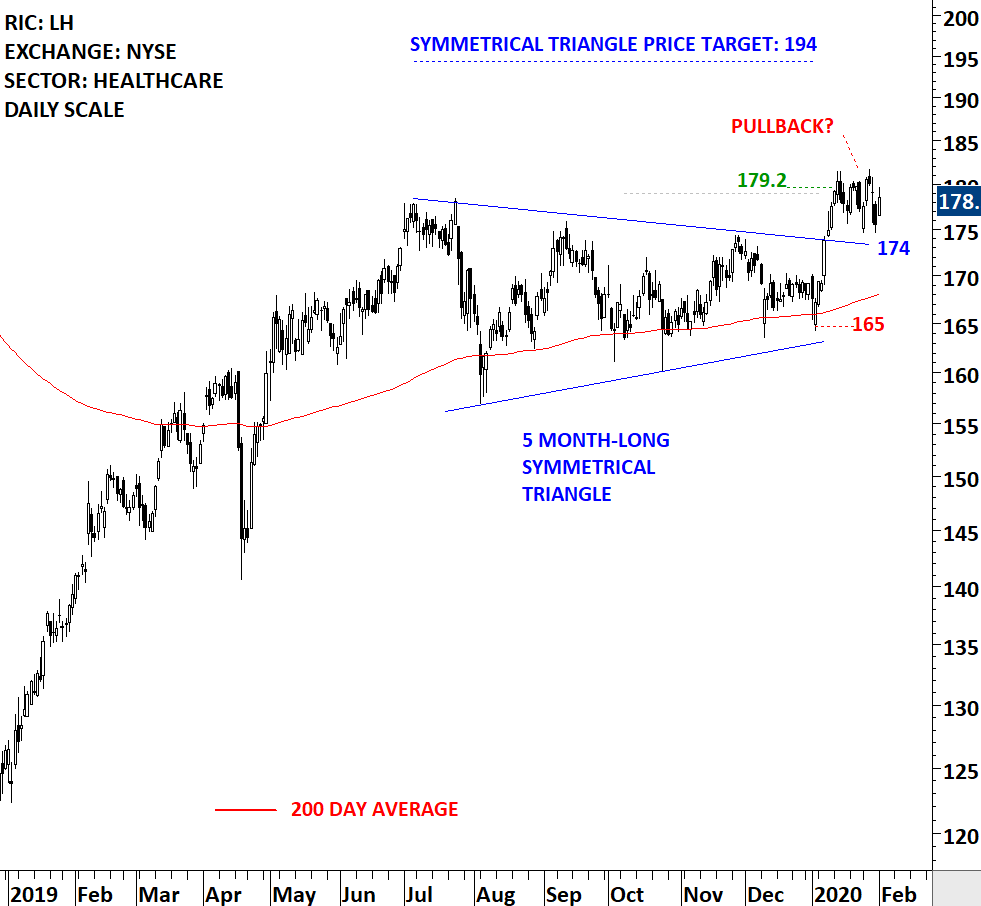
LABORATORY CORPORATION OF AMERICA HOLDINGS (LH)

Laboratory Corporation of America Holdings is a life sciences company that is integrated in guiding patient care, providing clinical laboratory and end-to-end drug development services. The Company operates as a healthcare diagnostics company. The stock is listed on the New York Stock Exchange. Price chart formed a 5 month-long symmetrical triangle with the upper boundary acting as strong resistance at 174.00 levels. Both boundaries were tested several times over the course of the chart pattern. The daily close above 179.00 levels confirmed the breakout from the 5 month-long symmetrical triangle with the possible chart pattern price target of 194.00 levels. The chart below is an update with the latest data from 03/02/2020.

A SHORT EDUCATIONAL VIDEO ON SYMMETRICAL TRIANGLES


Tech Charts Membership

By becoming a Premium Member, you’ll be able to improve your knowledge of the principles of classical charting.

With this knowledge, you can merge them with your investing system. In fact, some investors use my analyses to modify their existing style to invest more efficiently and successfully.

Get Access Now

As a Premium Member of Aksel Kibar’s Tech Charts,

You will receive:

  • Global Equities Report. Delivered weekly.
  • Classical charting principles. Learn patterns and setups.
  • Actionable information. Worldwide indices and stocks of interest.
  • Risk management advice. The important trading points of each chart.
  • Information on breakout opportunities. Identify the ones you want to take action on.
  • Video tutorials. How patterns form and why they succeed or fail.
  • Watch list alerts. As they become available so you can act quickly.
  • Breakout alerts. Usually once a week.
  • Access to everything (now and as it becomes available)
    o Reports
    o Videos and video series
  • Multi-part webinar course. You learn the 8 most common charting principles.
  • Webinars. Actionable and timely advice on breaking out chart patterns.

For your convenience your membership auto renews each year.

Get Access Now

GLOBAL EQUITY MARKETS – January 18, 2020

REVIEW


The benchmark for the Global equity markets performance, the iShares MSCI All Country World Index ETF (ACWI.O) continues to remain strong after completing both rectangle and H&S continuation chart patterns. ACWI ETF is in a steady uptrend. During any pullback, the high of 2018 (77.5) can act as support. It is usually difficult to pick tops and bottoms. The best way to approach strong trending markets is to trail it with trend following indicators such as ATR based trailing stops or different period moving averages. Selection of moving average period will depend on your time frame. Short-term moving averages will trail the price closely, resulting in an early exit signal.

  Read More

GLOBAL EQUITY MARKETS – January 4, 2020

REVIEW


The benchmark for the Global equity markets performance, the iShares MSCI All Country World Index ETF (ACWI.O) reached its initial price target after completing both rectangle and H&S continuation chart patterns. The right shoulder of a possible H&S continuation was identified as a rectangle with the price target of 79.6 levels. So far the price remained stable after reaching price objective. ACWI ETF is in a steady uptrend. During any pullback, the high of 2018 (77.5) can act as support.

Read More

GLOBAL EQUITY MARKETS – December 28, 2019

Dear Tech Charts members,

Another year is almost behind us. 2019 has been a productive year. Your communications and feedback has been helpful in improving the membership service and I'm thankful for that. Without your support I would not be able to put out this product. I hope the ideas, the educational content, webinars and reports have added value in your decision making. Guided and motivated by our members feedback and comments there will be several new additions to Tech Charts membership service in the new Year. I look forward to announcing them as the new Year progresses. I wish all of you a healthy and successful new Year and I would like to thank you for being a Tech Charts member.

Regards,

Aksel Kibar, CMT

REVIEW


The benchmark for the Global equity markets performance, the iShares MSCI All Country World Index ETF (ACWI.O) reached its initial price target after completing both the rectangle and H&S continuation chart patterns. The right shoulder of a possible H&S continuation was identified as a rectangle with the price target of 79.6 levels. This week's price action pushed the ETF towards its rectangle chart pattern price target. Long-term chart pattern price objective stands at 85.5 levels. During any pullback, the high of 2018 (77.5) can act as support. Daily and weekly price charts show a steady uptrend.

Read More

GLOBAL EQUITY MARKETS – December 14, 2019

REVIEW


The benchmark for the Global equity markets performance, the iShares MSCI All Country World Index ETF (ACWI.O) cleared the resistance at 77.5 levels. After a week of short-term volatility and pullback the ETF resumed higher towards its possible rectangle chart pattern price target at 79.6 levels. Both the daily and weekly price charts show a steady uptrend.

Read More

GLOBAL EQUITY MARKETS – December 7, 2019

REVIEW


The benchmark for the Global equity markets performance, the iShares MSCI All Country World Index ETF (ACWI.O) found resistance at 77.5 levels. Last week's bearish shooting star candlestick pattern proved to be a short-term correction signal. Following a quick sell-off (intra-week) the ETF recovered to test its previous high.

Is the short-term correction over? Read More