Posts

LOGARITHMIC vs. LINEAR SCALE CHARTING

The weekly Global Equity Markets report now has a new section; TECH CHARTS STUDY. In this new section I try to answer member's questions on different aspects of classical charting and technical analysis. Members who are new to classical charting and technical analysis will have another resource other than the educational video series to learn from and apply this knowledge to their own analysis. The latest weekly report's Tech Charts Study section reviewed the difference between logarithmic and linear scale charting applied on Russell 2000 Index ETF (IWM).

Read More

GLOBAL EQUITY MARKETS – August 19, 2017

REVIEW


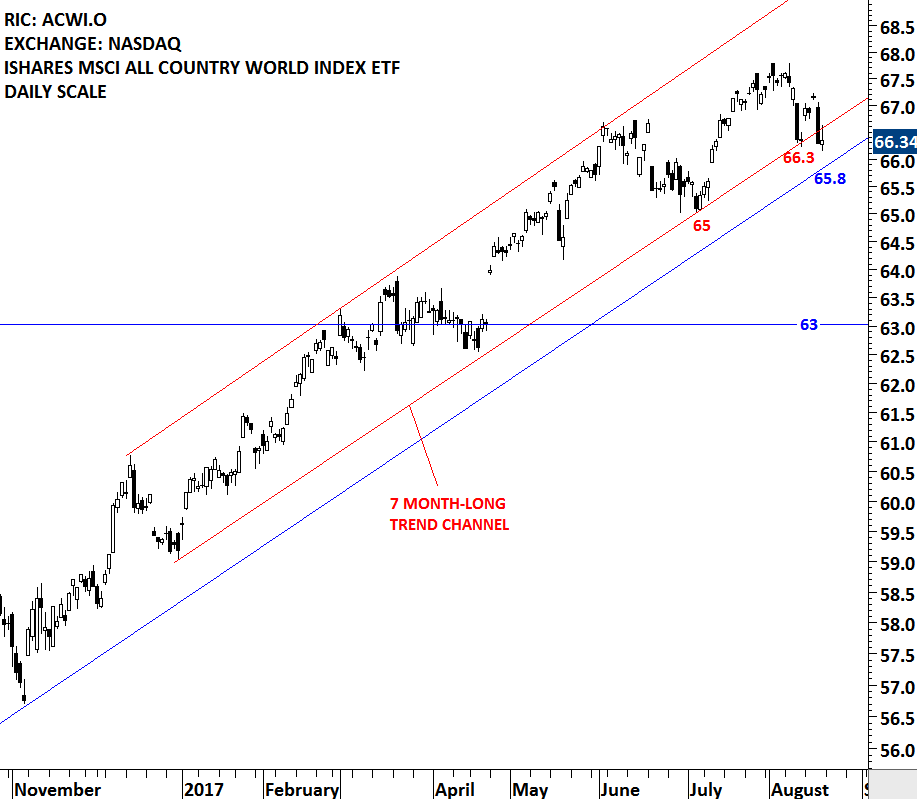
The iShare MSCI ACWI ETF is testing a 17 month-long upward trend line. The more a trend line or a support/resistance area is tested the more important it becomes. The long-term trend line has been tested several times. In the beginning of the week, the global equity benchmark ACWI rebounded from the lower boundary of its 7 month-long trend channel but finished at the same level on Friday. A breakdown below 66.3 levels can push the price towards the long-term trend line support at 65.8. Steep trend lines like the one we are seeing on the ACWI, can't extend for a long time. The trend needs adjustment, in other words find another low. (I added an S&P 500 chart below to better explain this point). The real test will be at 65.8 levels. Breakdown below that support can result in a correction towards 63 levels. Next week, I will be monitoring 66.3 and 65.8 levels closely. Important support area is between 65.8 and 66.3. I will issue interim updates if there is a change in the technical outlook.

Read More

GLOBAL EQUITY MARKETS – July 22, 2017

REVIEW


U.S. Biotech stocks resume uptrend after their strong breakout in the last week of June. June 17, 2017 and June 24, 2017 Global Equity Markets reports drew attention to the strength in the Biotech ETFs and alerted members on the multi-month bullish chart pattern completions. Both SPDR S&P BIOTECH ETF and ISHARES NASDAQ BIOTECH ETF had strong breakouts. After few weeks of pull back to the previously broken chart pattern boundary, NASDAQ BIOTECH INDEX resumed its uptrend. Read More

GLOBAL EQUITY MARKETS – July 8, 2017

REVIEW


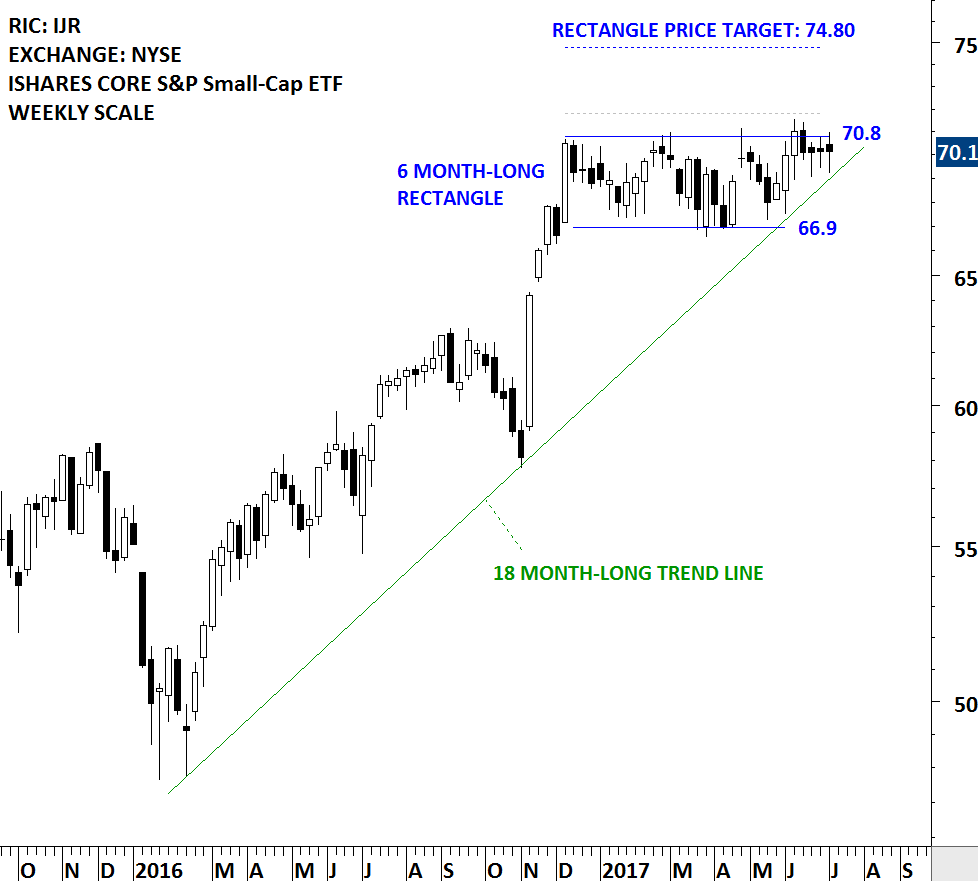
It has been more than six months that the U.S. small caps are trading in a tight range. One of the well-defined chart patterns the weekly global equity markets report frequently discussed was the ISHARES CORE S&P Small-Cap ETF. IJR has a well-defined trading range between 66.9 and 70.8 levels. The ETFs price is holding above the 18 month-long upward trend line. A directional move should follow soon. The margin between the multi-month trend line and the upper boundary of the 6 month-long rectangle has narrowed. A daily close above 71.80 will confirm the breakout from the 5 month-long rectangle and suggest higher prices. A breach below the 18 month-long trend line can put pressure on the small caps and push prices towards the lower boundary of the rectangle at 66.9 levels.

Read More

GLOBAL EQUITY MARKETS – June 17, 2017

Announcements:

1) New educational videos explaining the most analyzed 8 classical chart patterns are uploaded under the Educational Videos page. More videos are being prepared, featuring different outcomes for these chart patterns.

2) A new page featuring all the breakout alerts will be made available (next few days) for members. It will be a helpful tool for following up on the latest chart patterns, sort latest breakout alerts by date and search by ticker.

3) Due to high volume of requests from Tech Charts members, starting from this update I will add reference levels that would possibly negate a chart pattern. Other important labeling will be included on the charts. Below info graphic can be useful to explain the new additions on the charts.

Read More