GLOBAL EQUITY MARKETS – July 6, 2019
REVIEW
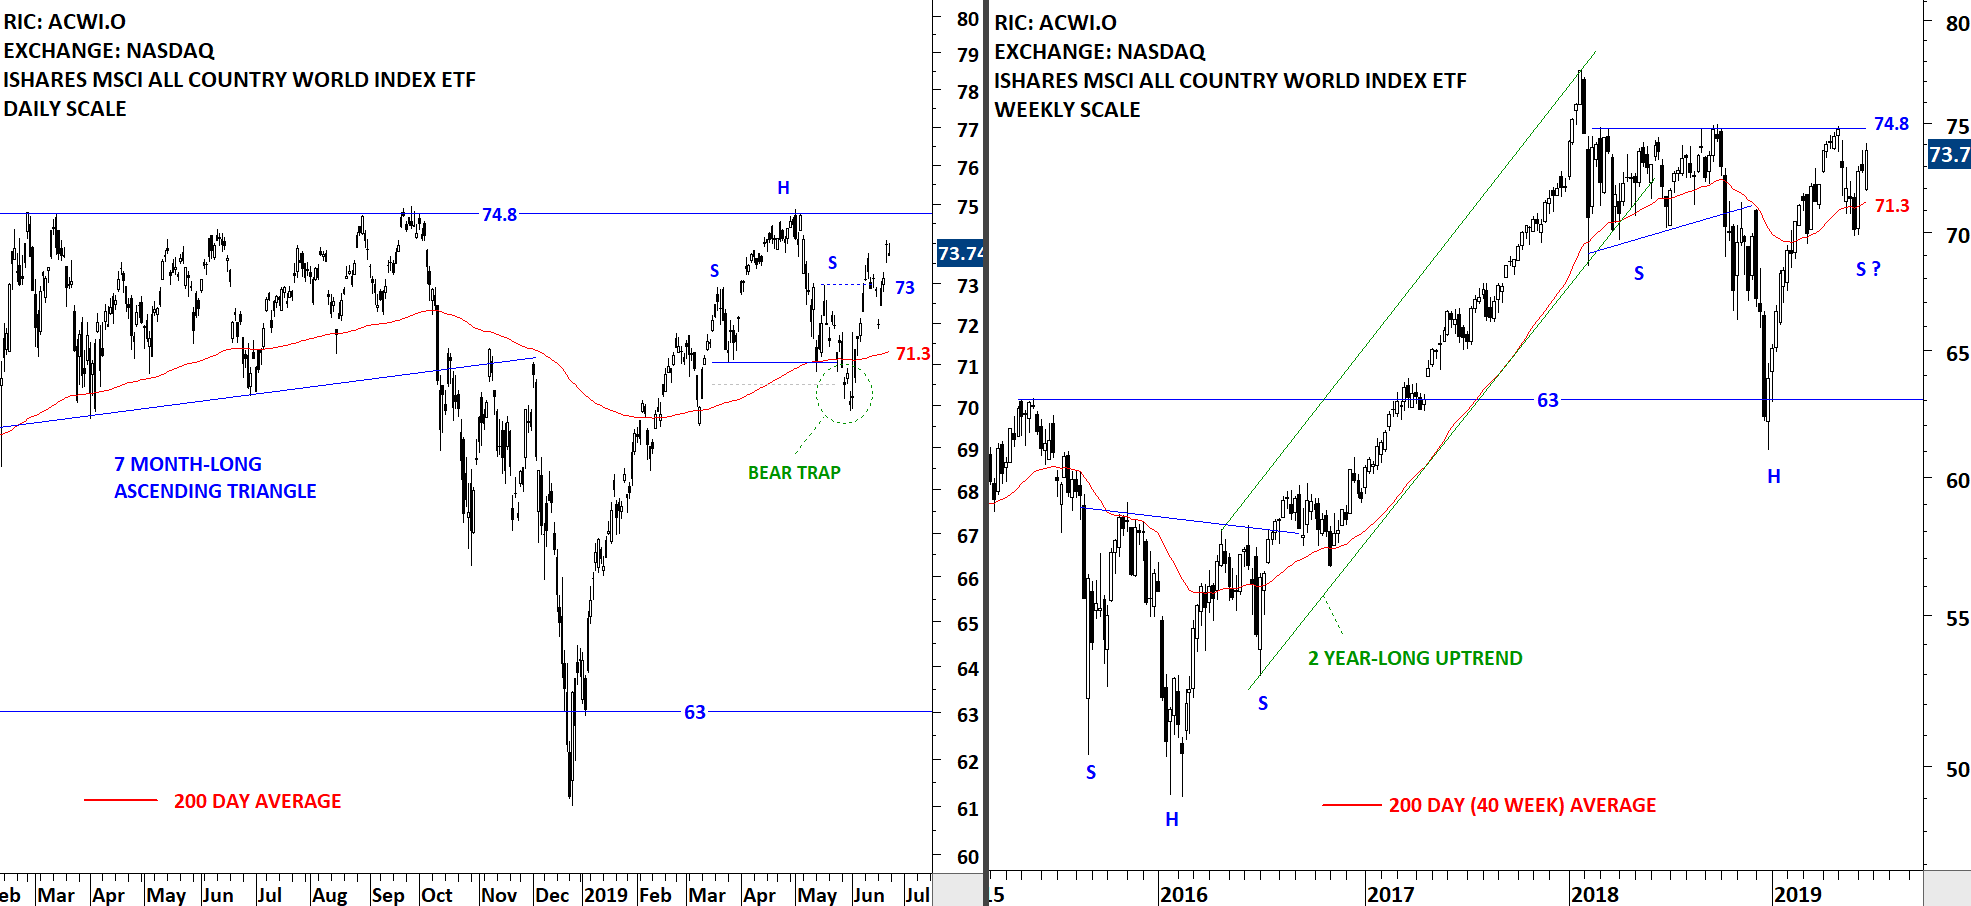
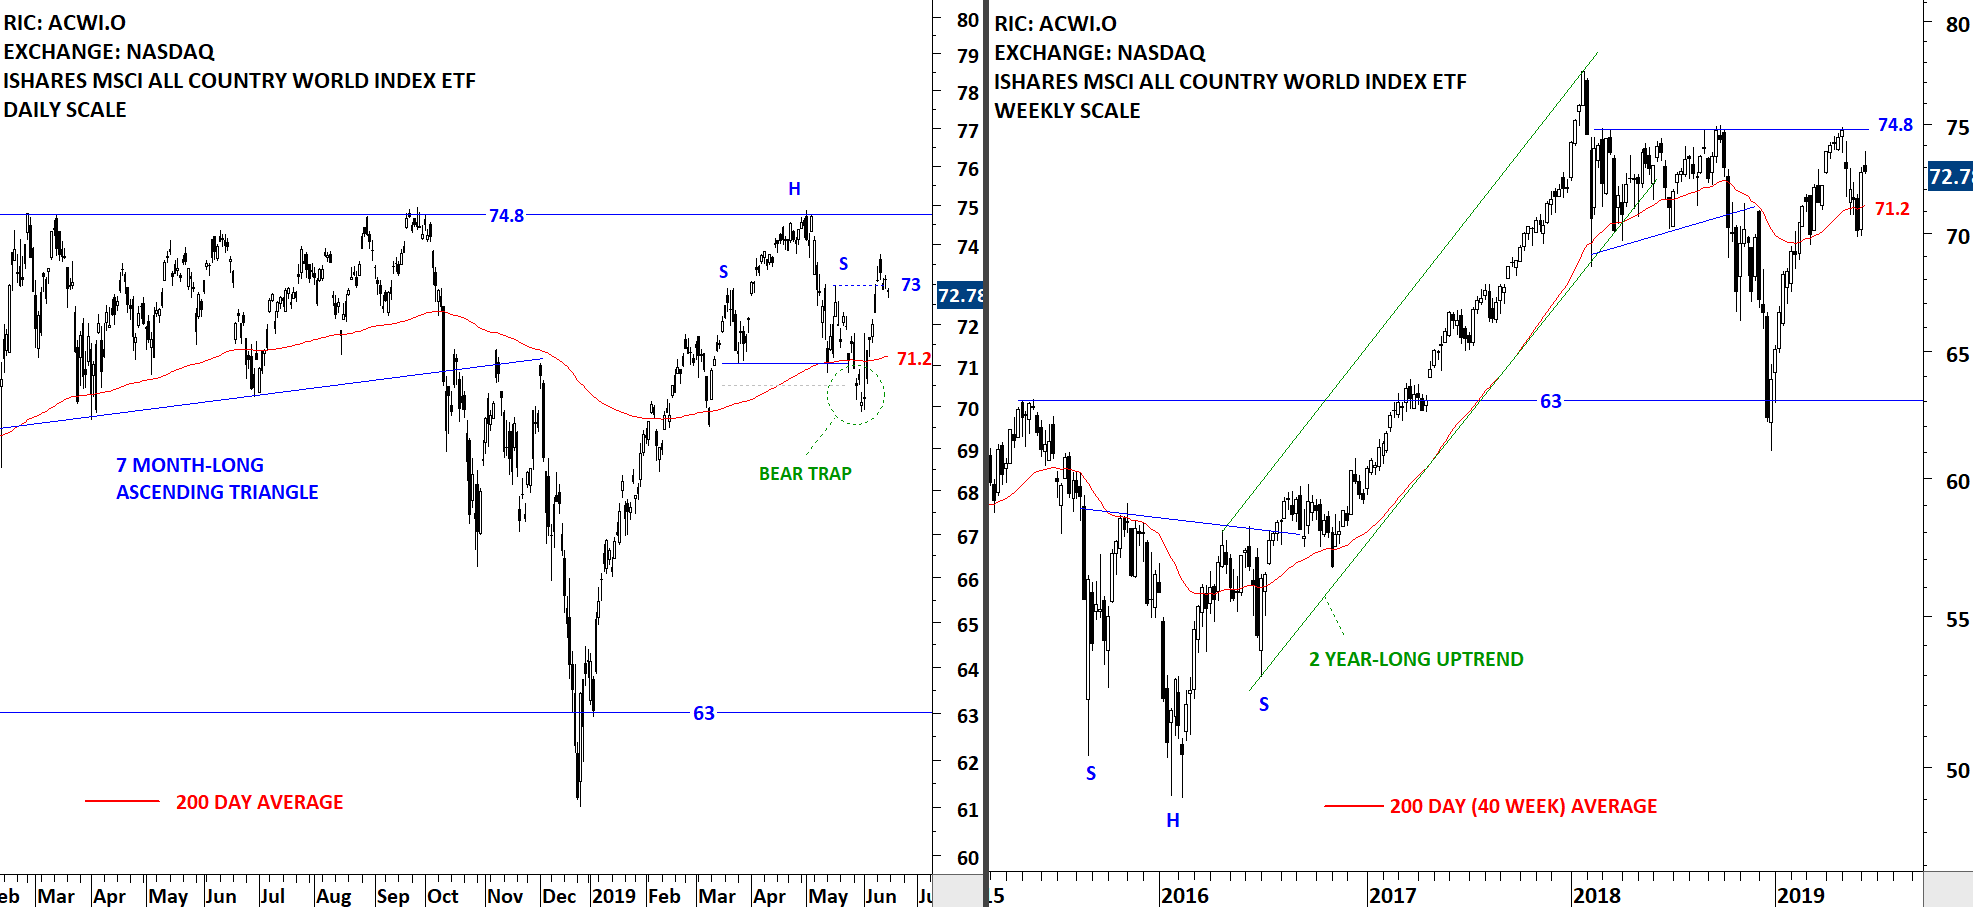
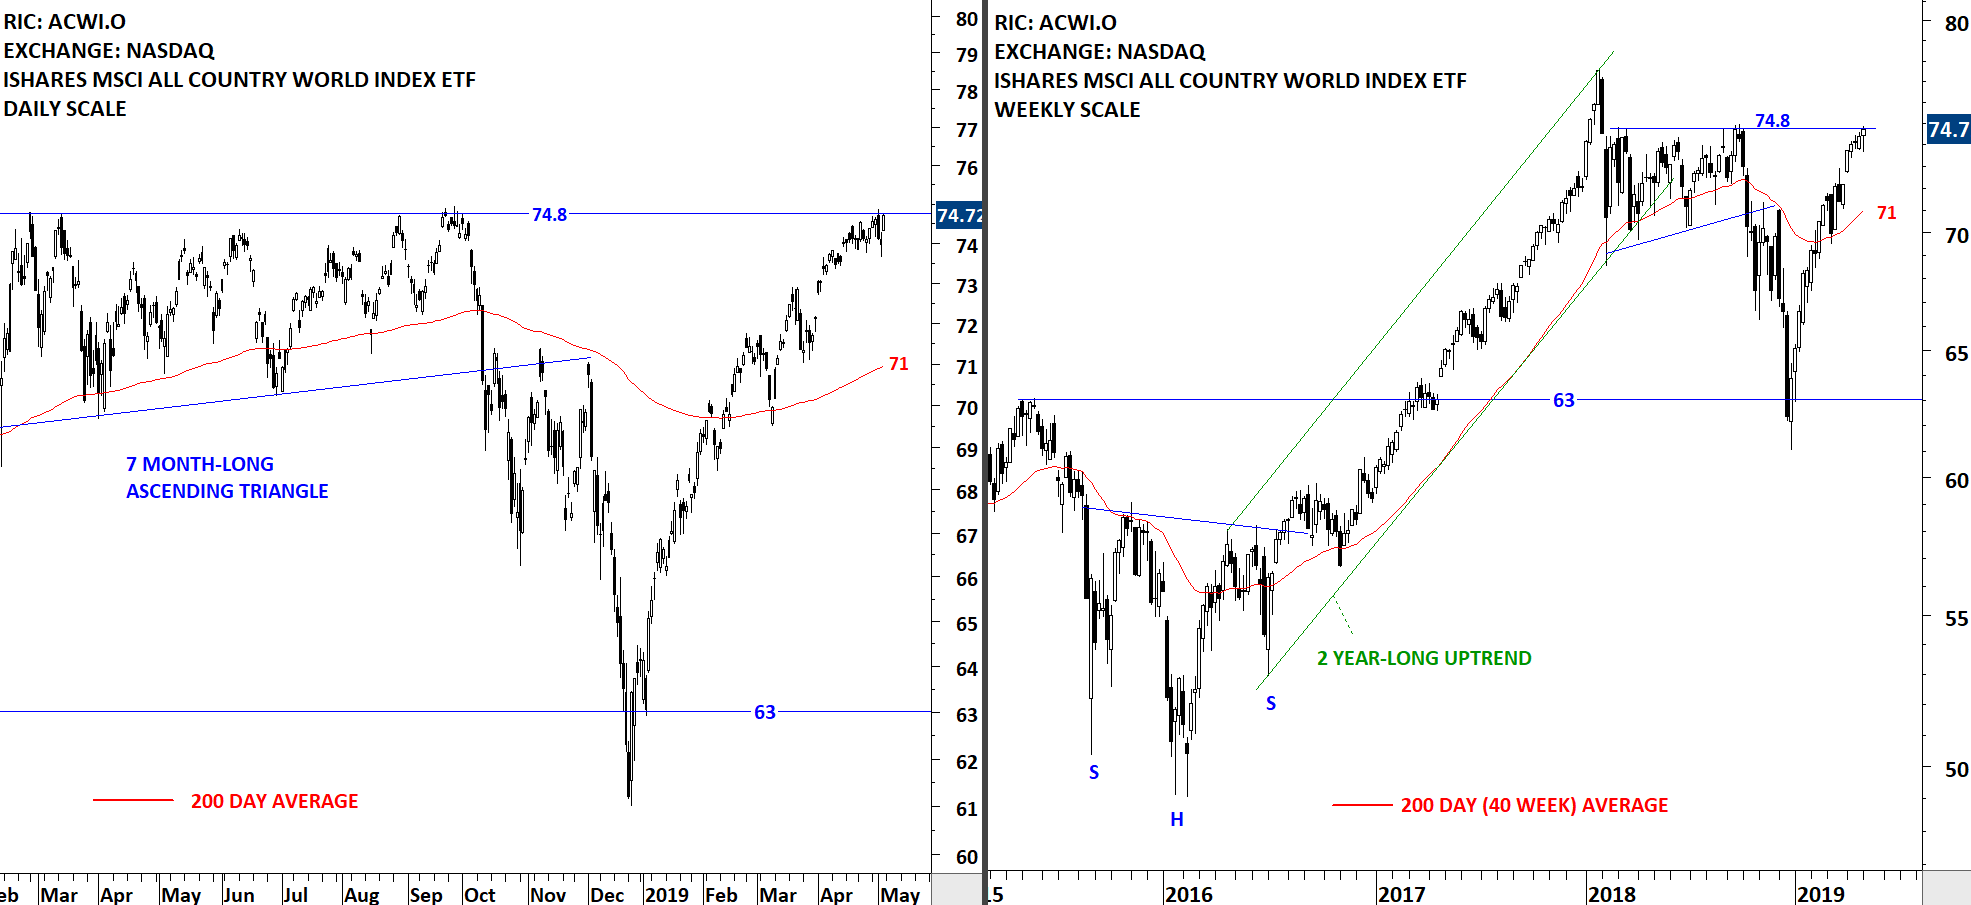
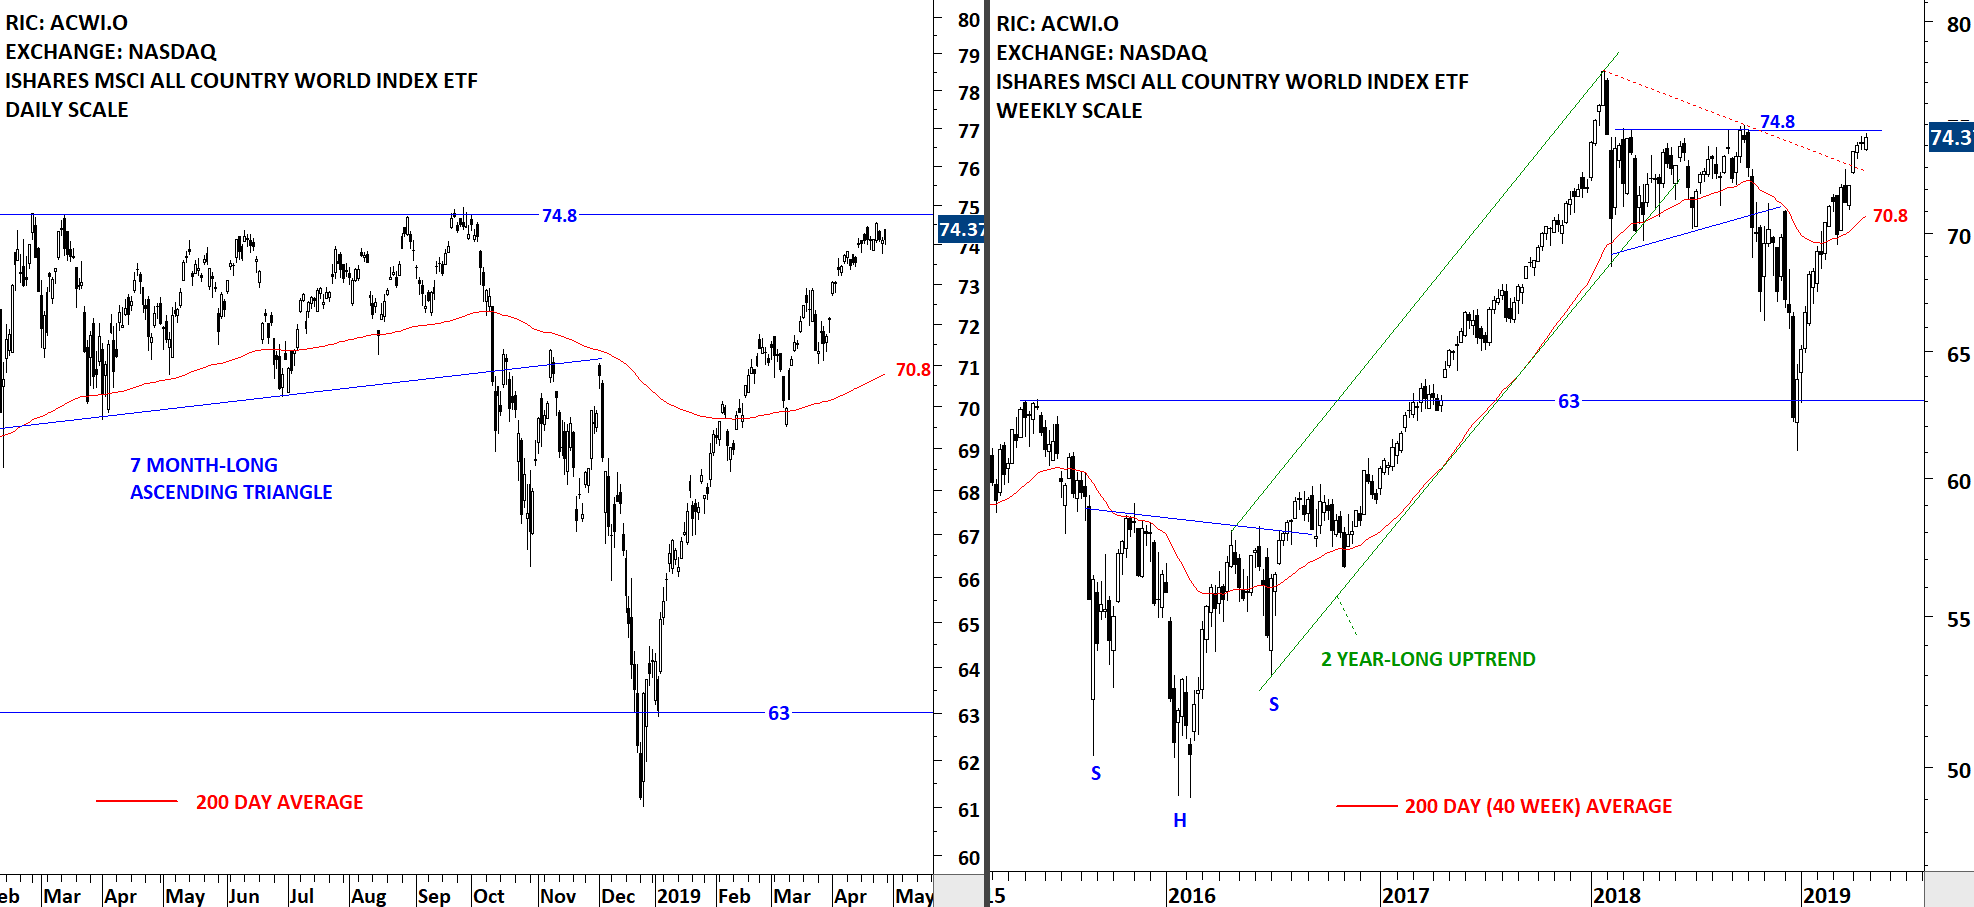
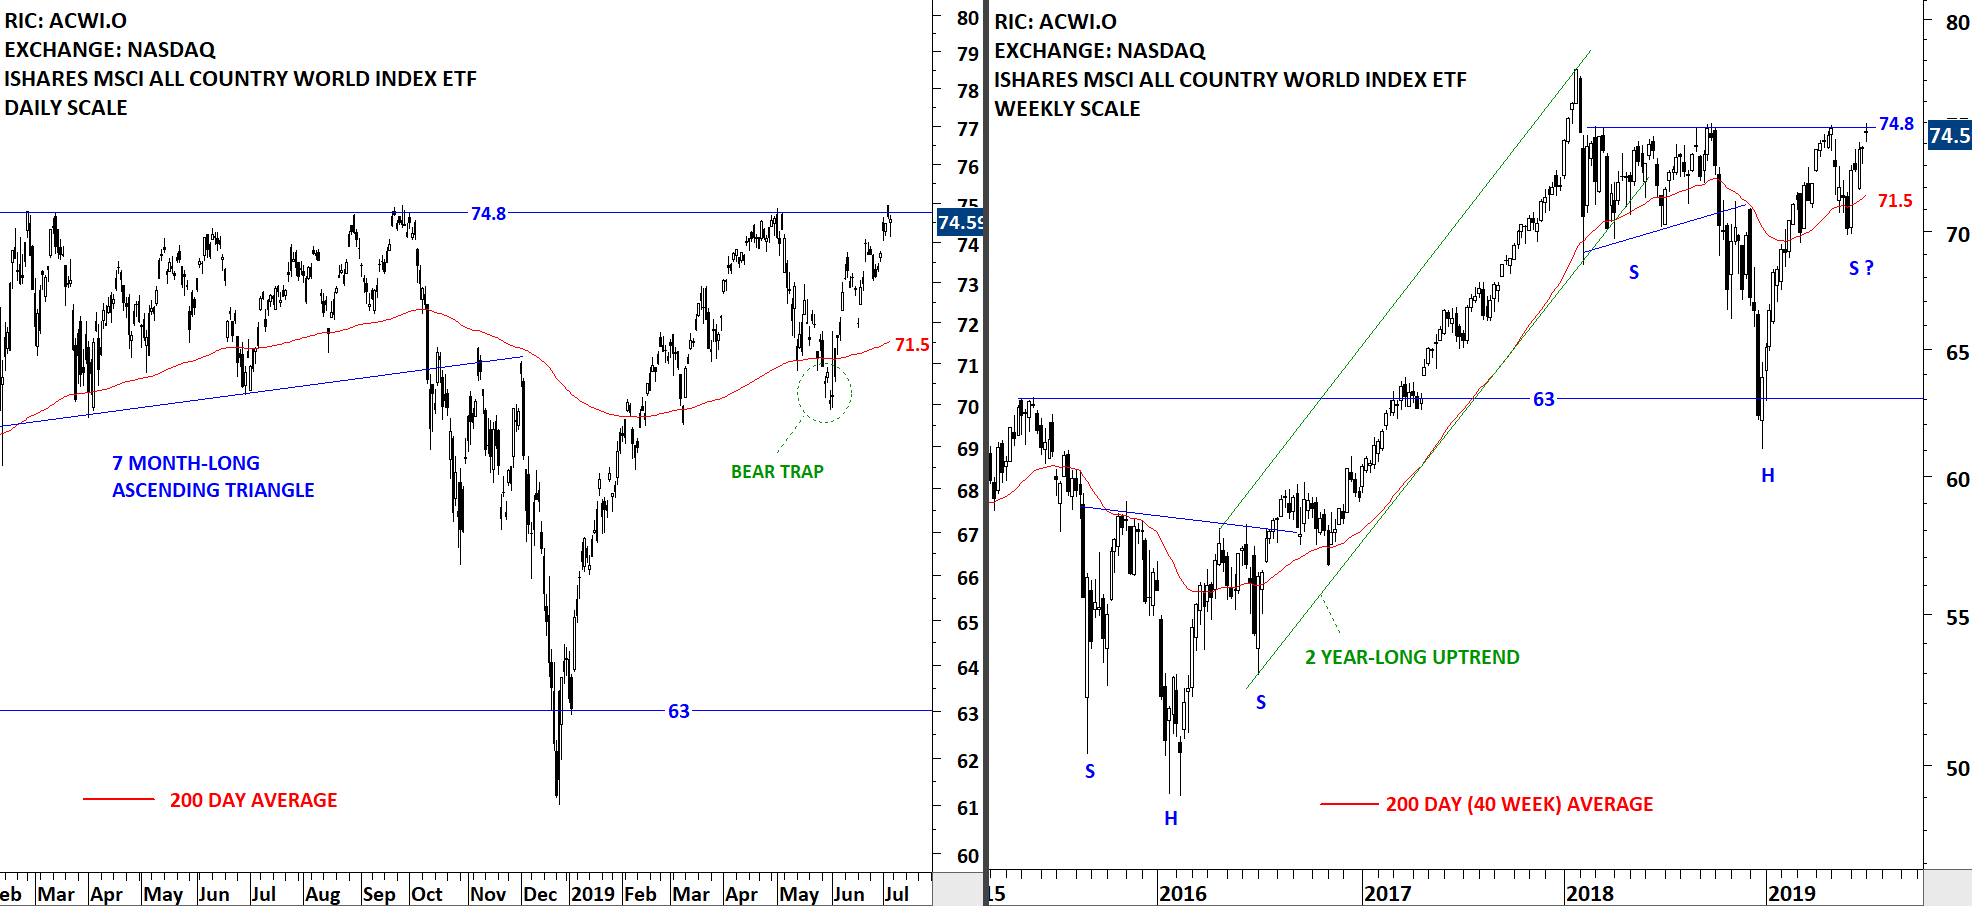
The benchmark for the Global equity markets performance, the iShares MSCI All Country World Index ETF (ACWI.O) is now testing the horizontal resistance at 74.8 levels. Breakout can be positive for Global equities. This week's candlestick shows that 74.8 levels remains a resistance. The 200-day moving average at 71.5 levels will act as support during any pullback.
 Read More