GLOBAL EQUITY MARKETS – August 10, 2019
REVIEW
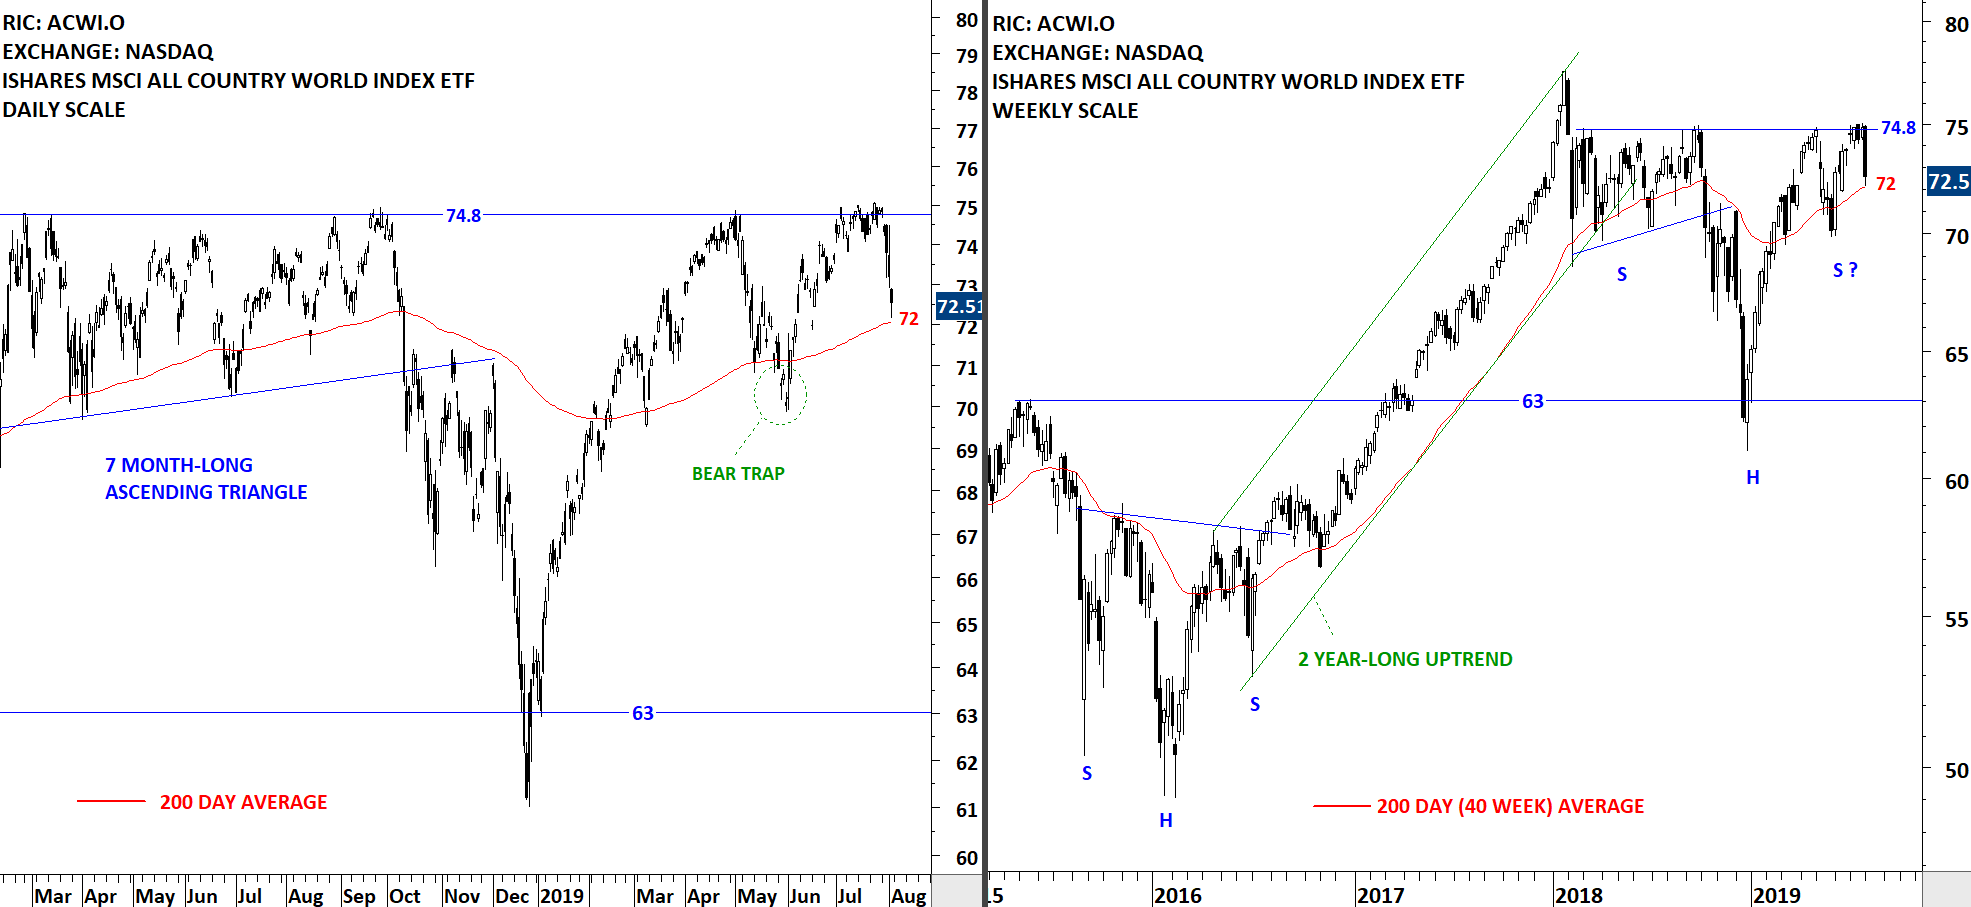
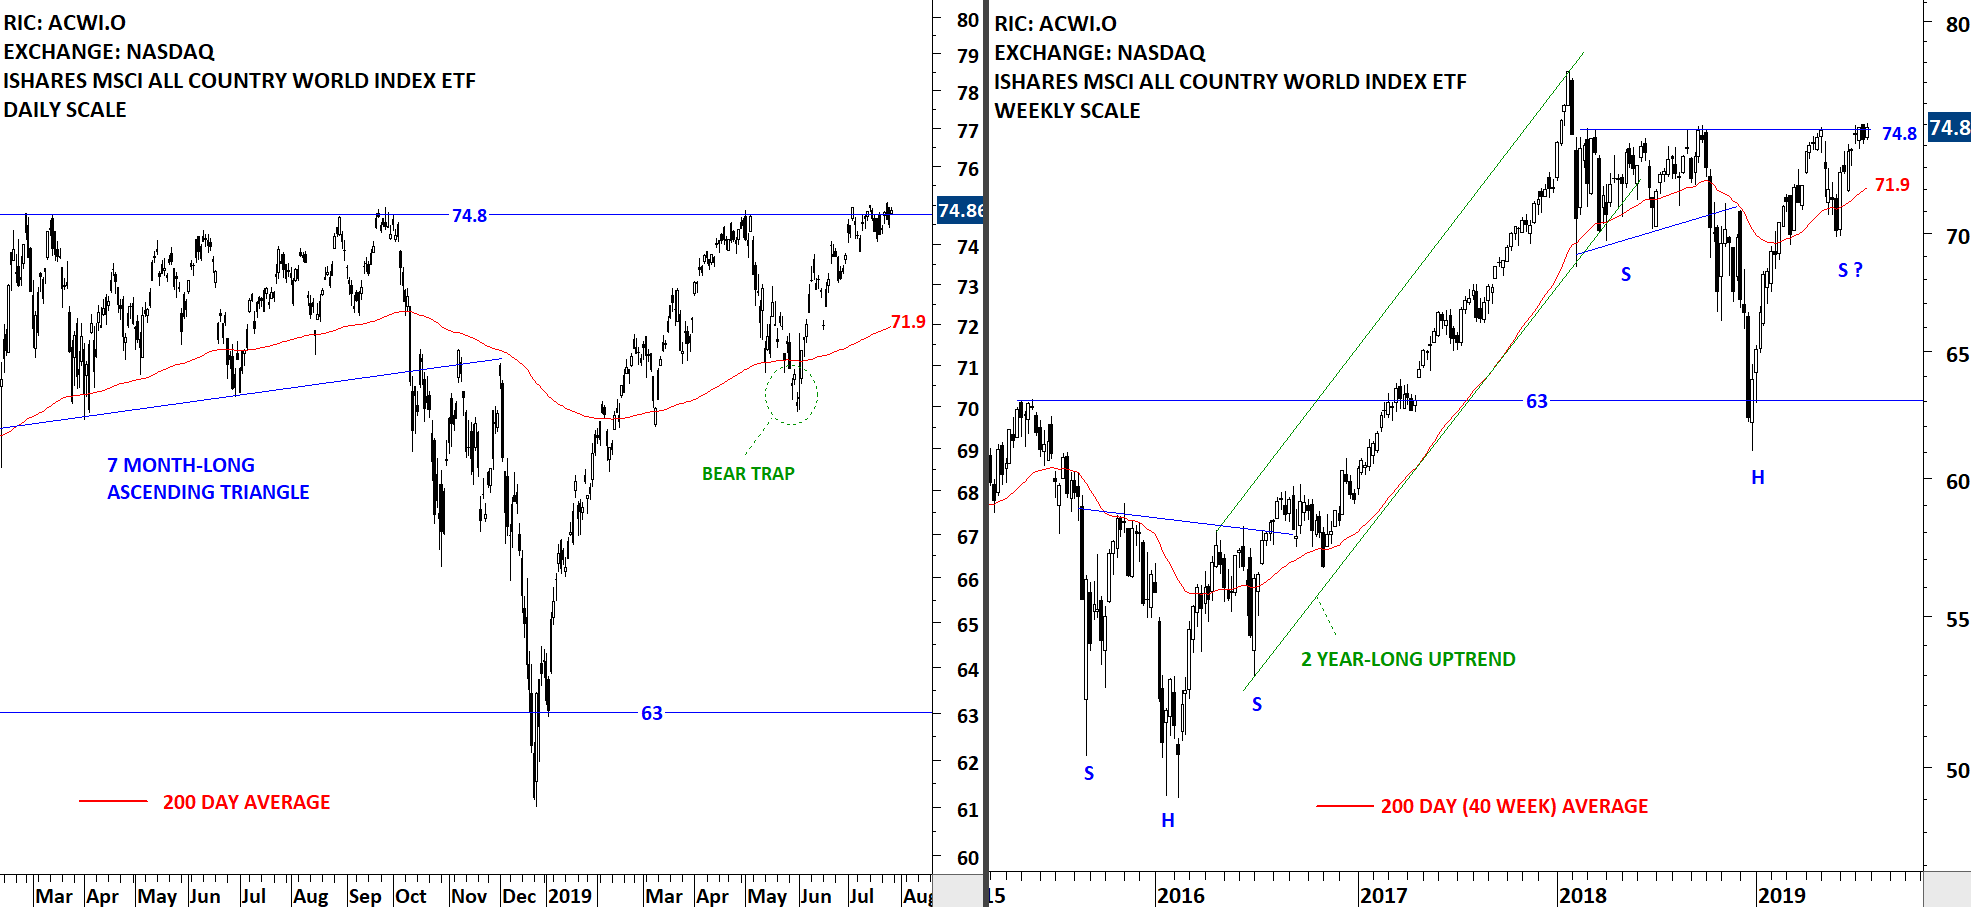
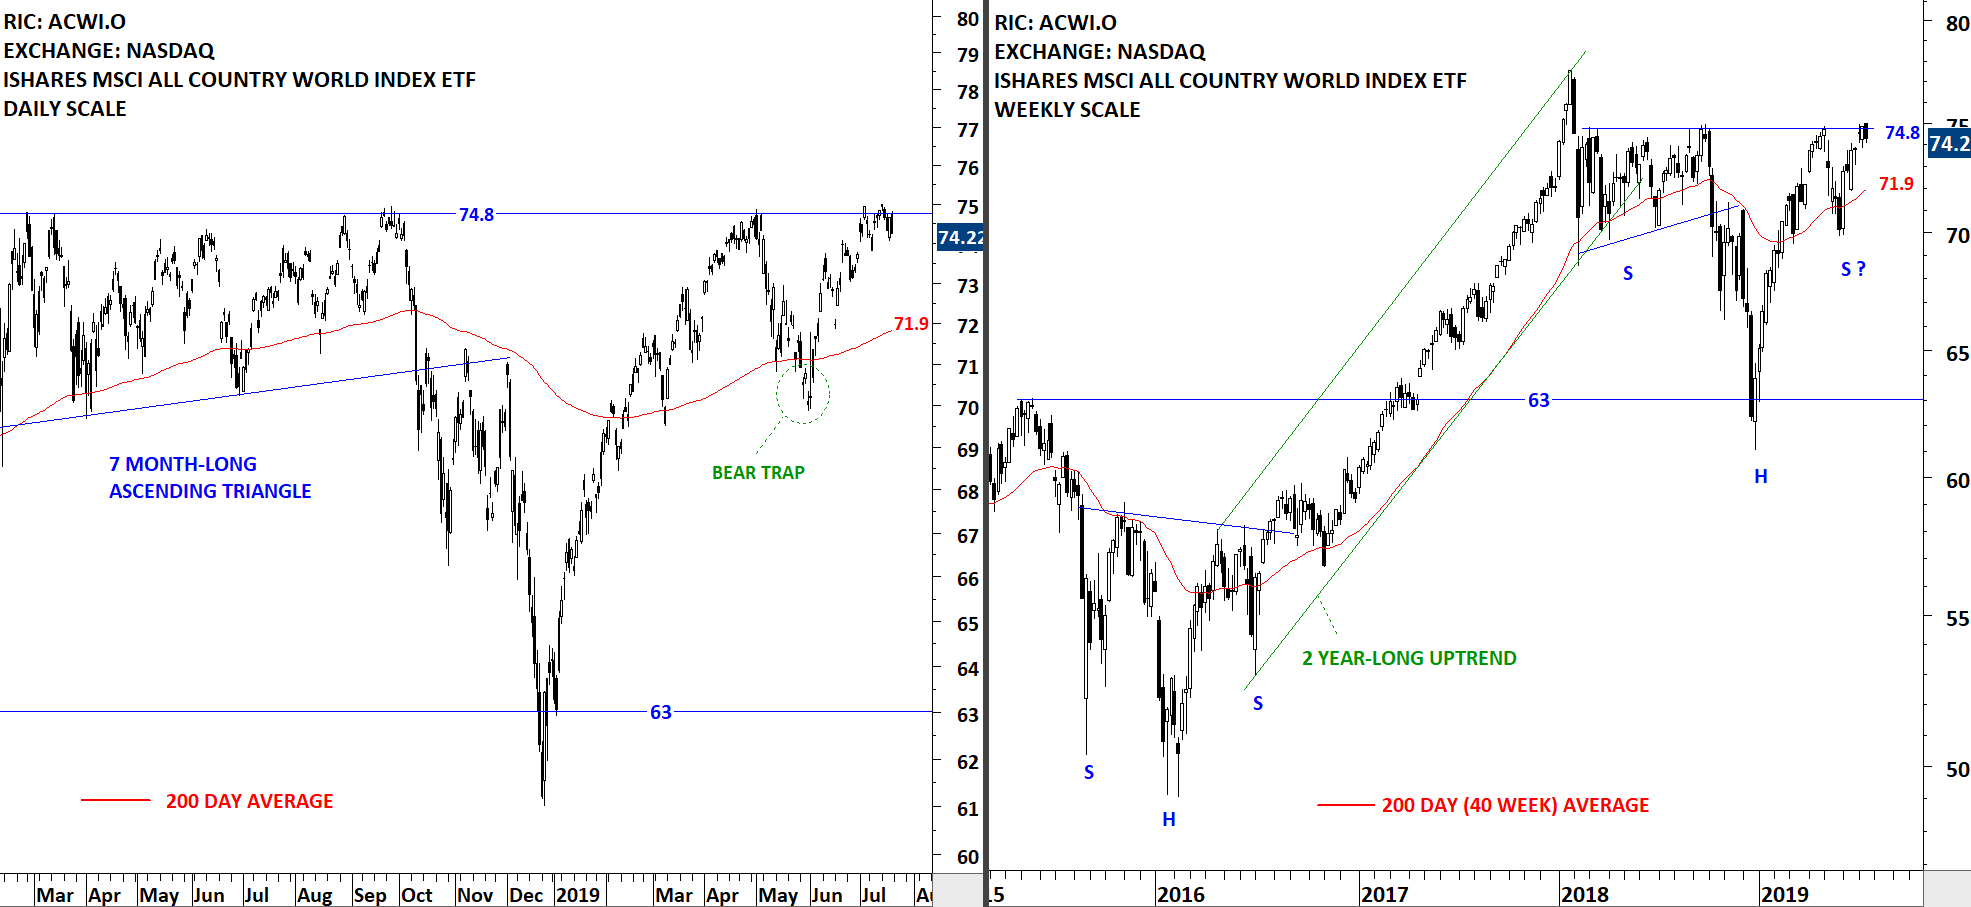
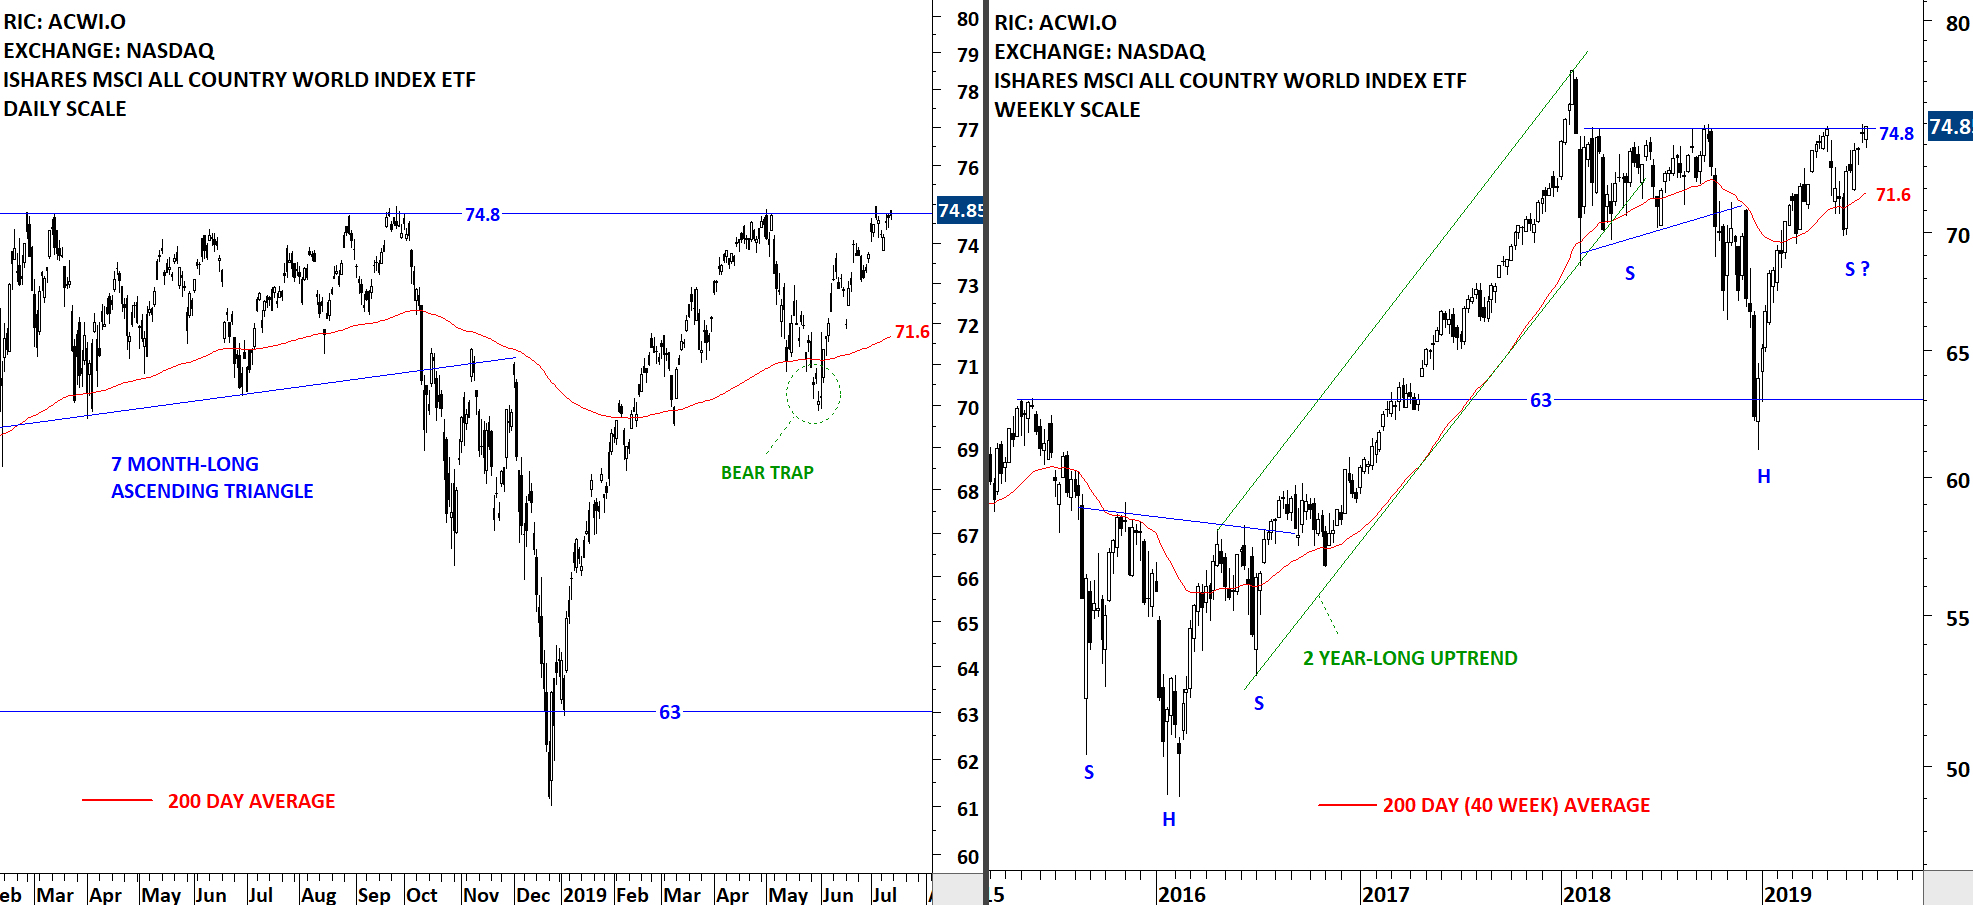
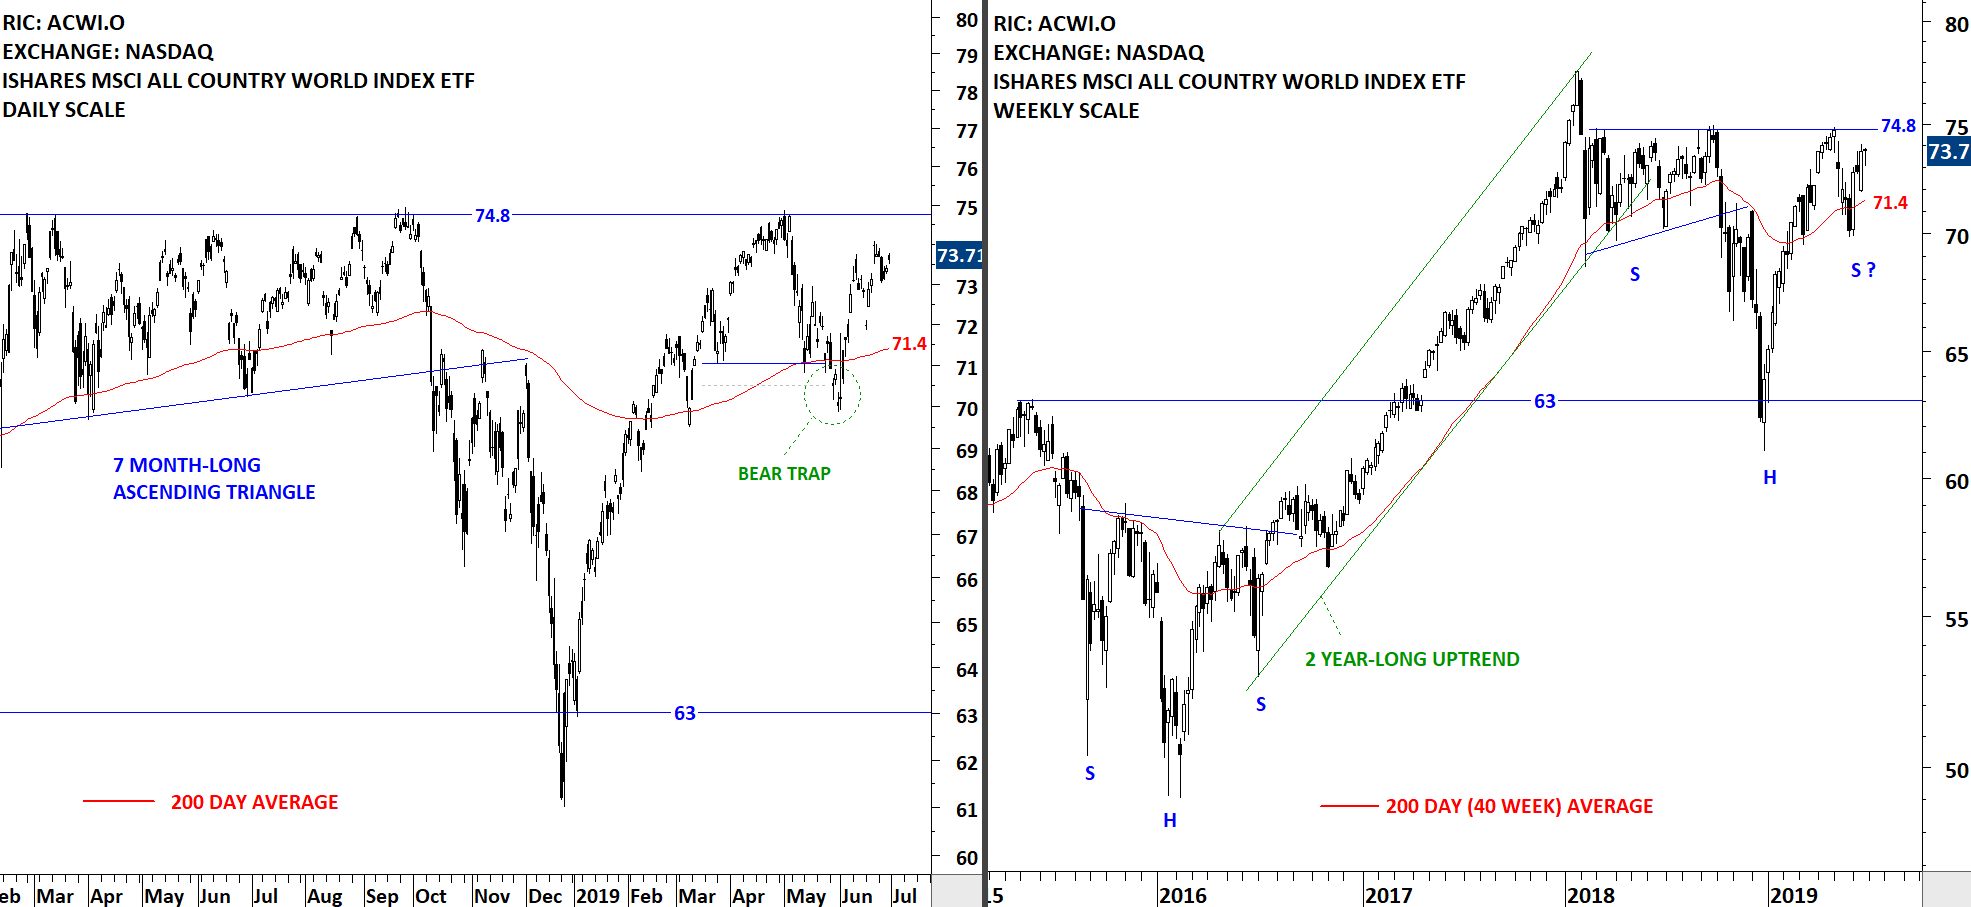
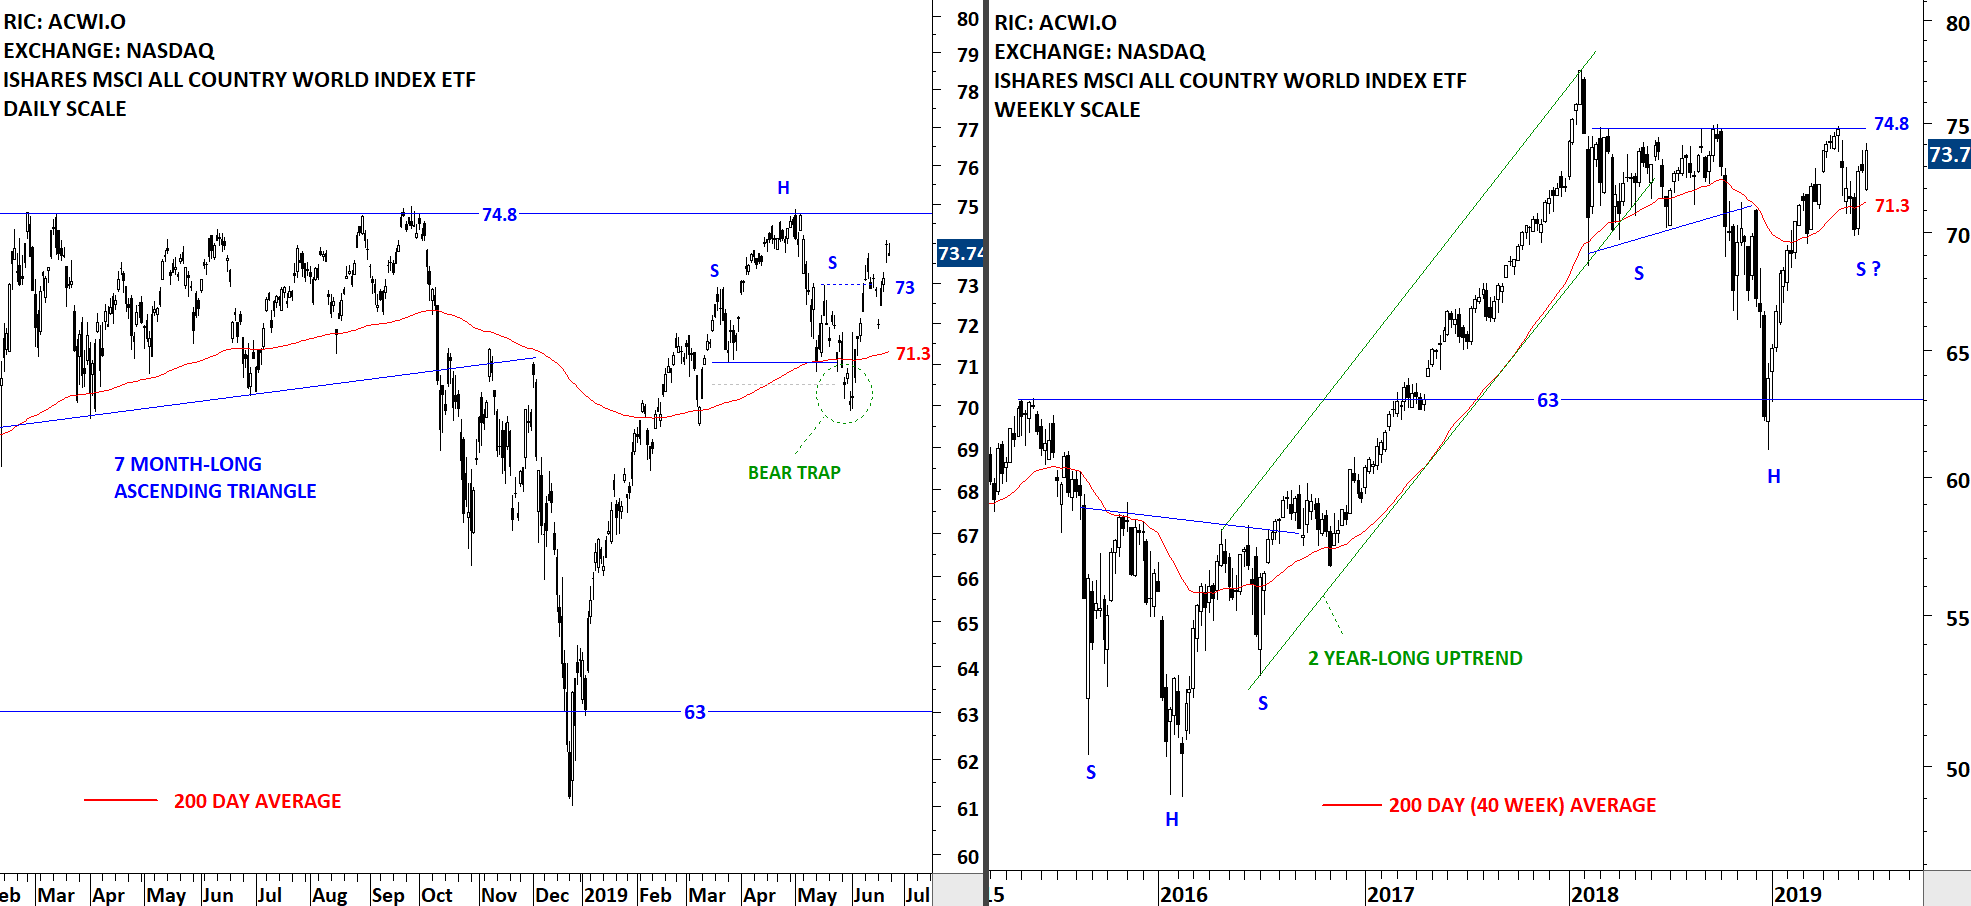
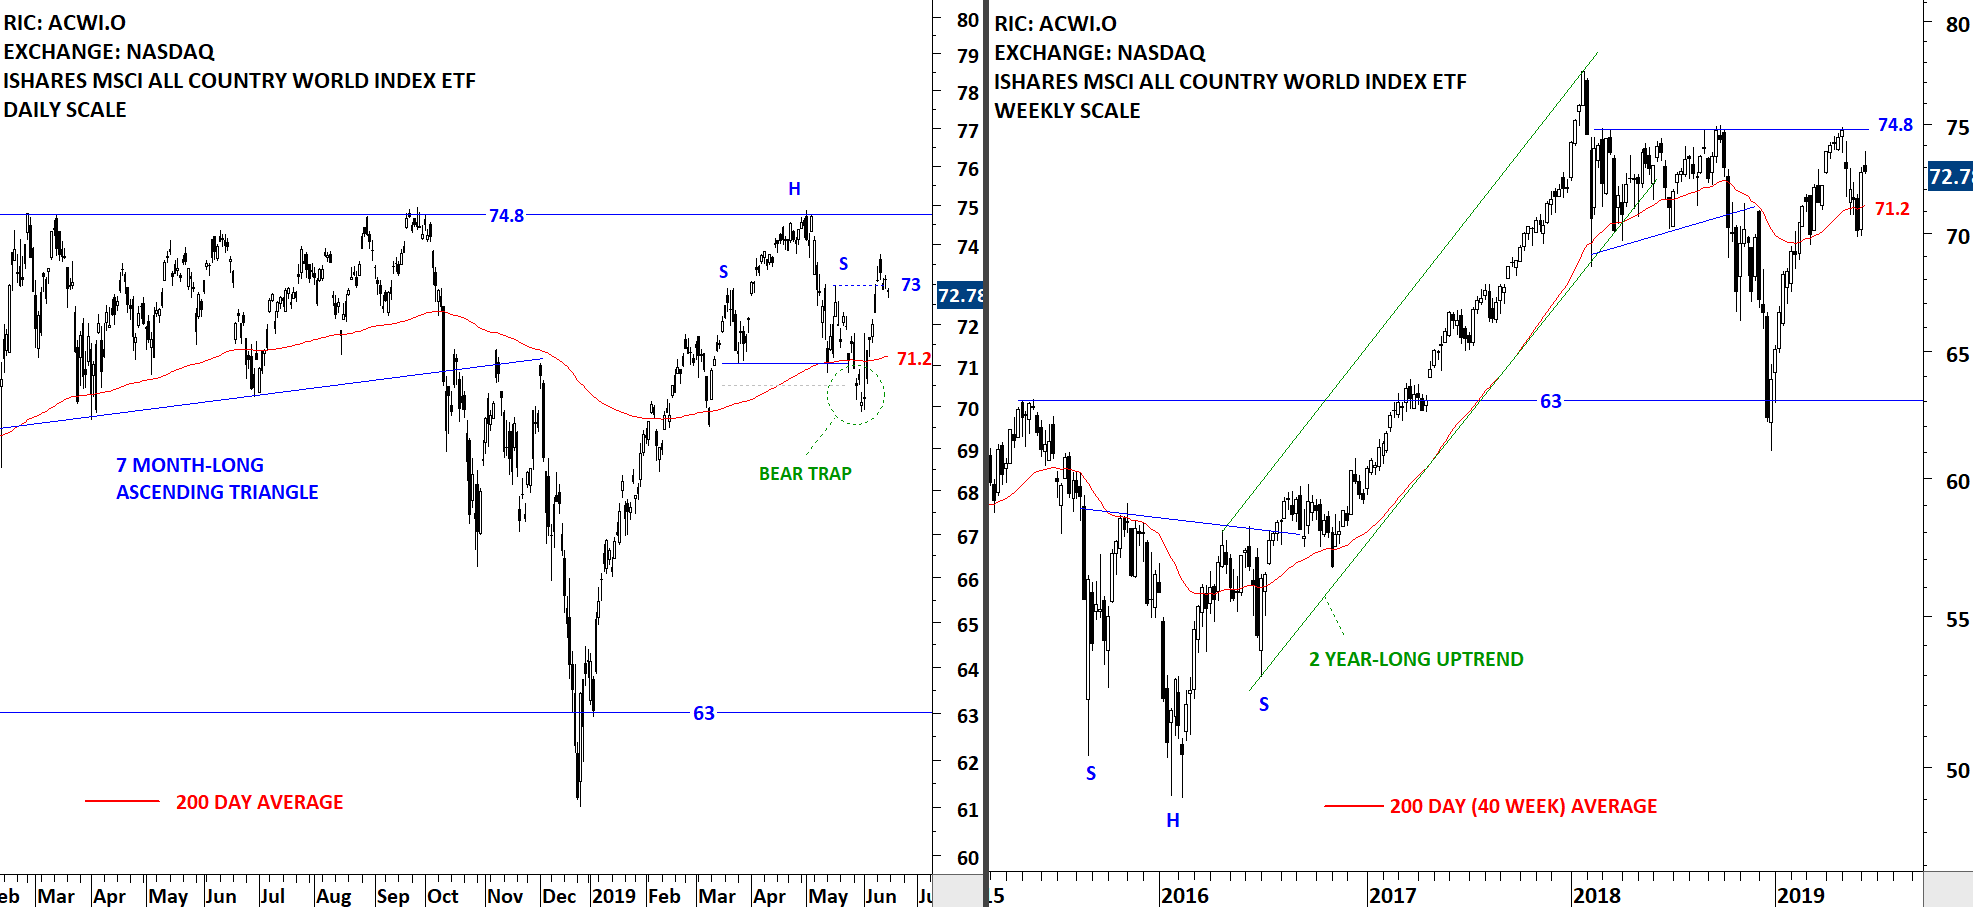
The benchmark for the Global equity markets performance, the iShares MSCI All Country World Index ETF (ACWI.O) found support at the minor low at 70 levels. Mid-week Interim Update discussed the possibility of a rebound. The reversal from 70 levels filled the gap. This week's close was at the 200-day average. The ETF is possibly forming a new trading range between 70 and 74.8 levels. Breakdown below 70 levels can result in further weakness.
Read More