U.S. DOLLAR/CHINESE YUAN
Once again emerging market currencies started weakening against the U.S. Dollar. Earlier update analyzed the Turkish Lira, South African Rand and Mexican Peso. In this blog post I review the existing uptrend on USD/CNY.
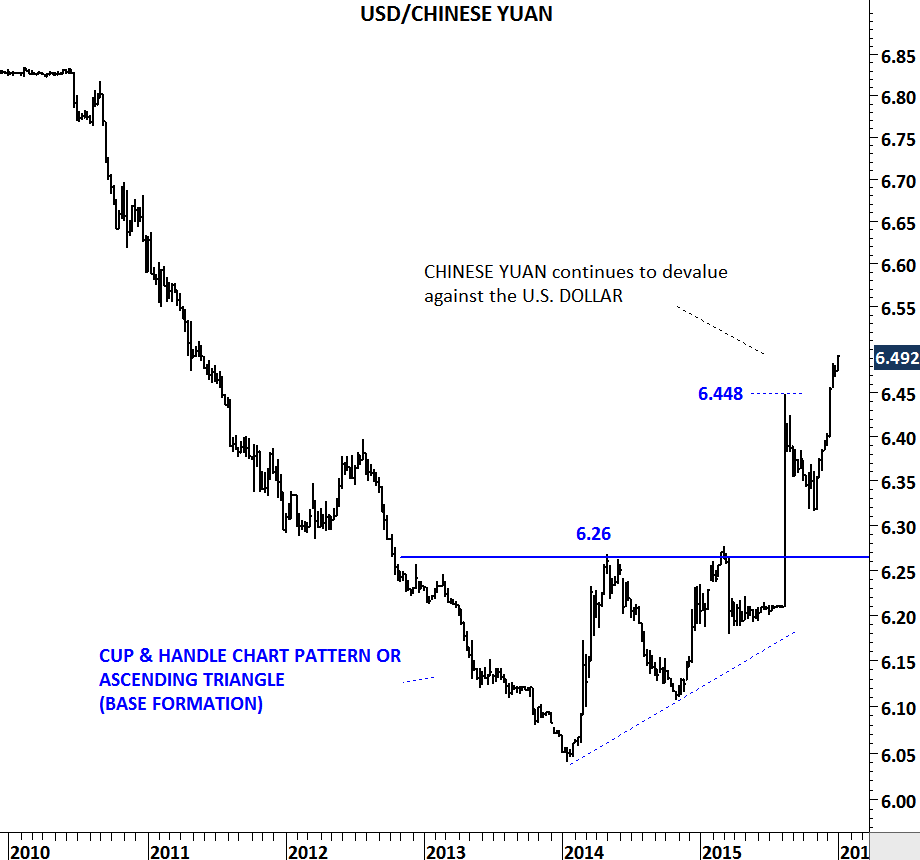
U.S. Dollar/Chinese Yuan is reversing from a critical support level. Since the second half of 2015, USD/CNY has been recording higher highs and higher lows. First, a breakout above 6.26 followed by another strong breakout above 6.448, clearly established the strong dollar weak yuan trend. Last 4 months price action was possibly a pullback to the previously broken resistance at 6.448 and it might be over. Reversal from strong support area can be followed by another upward spike towards 6.65-6.70 area.
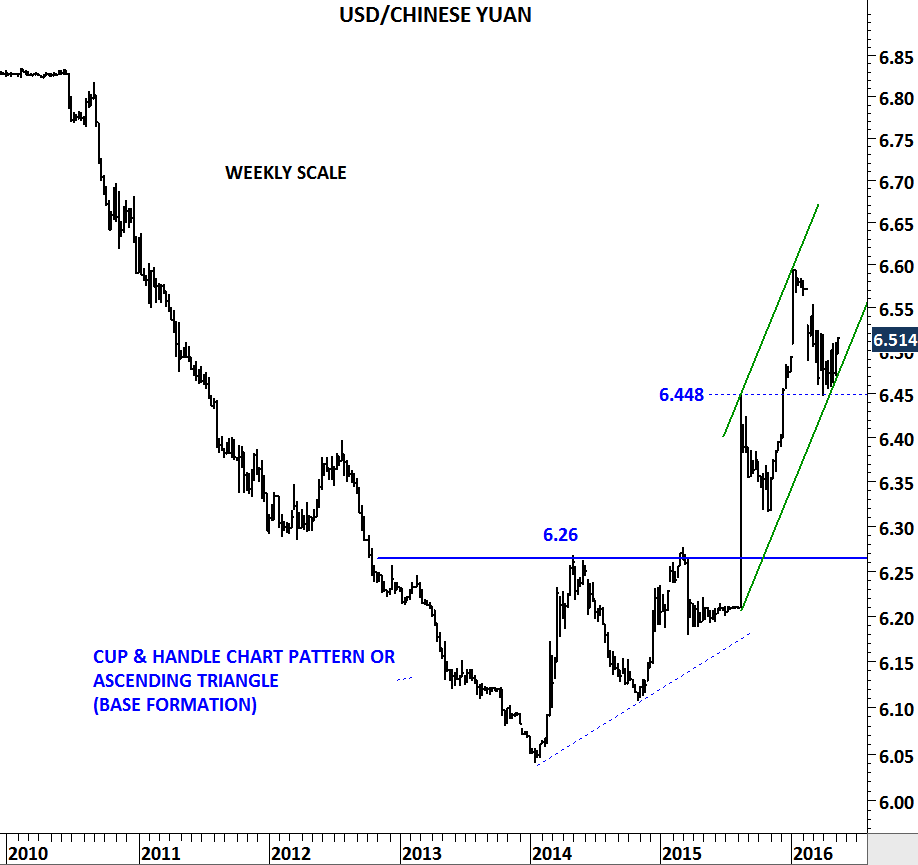
Weekly scale price chart of USD/CNY
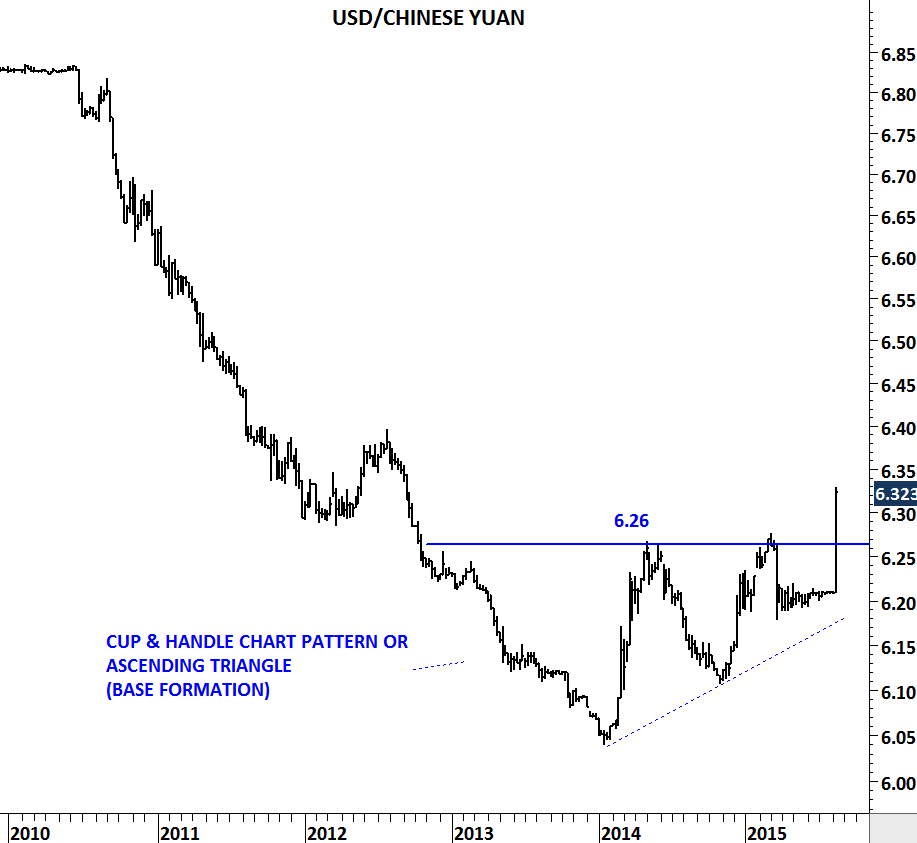
The daily scale chart shows the breakout from the last 4 months downward trend channel. As long as the USD/CNY remains above 6.45-6.50 area, strong USD weak CNY trend will remain intact in the second half of the year.
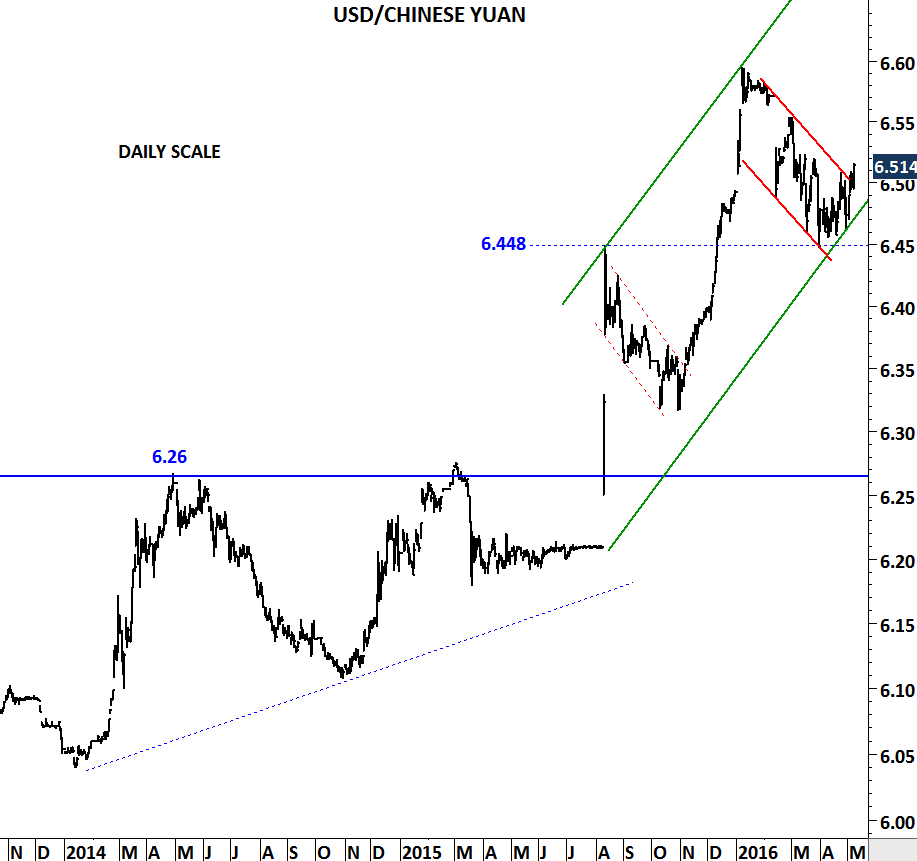
Daily scale price chart of USD/CNY