Rectangle – Daily & Weekly scale breakouts

GLOBAL EQUITY MARKETS – November 16, 2019
REVIEW
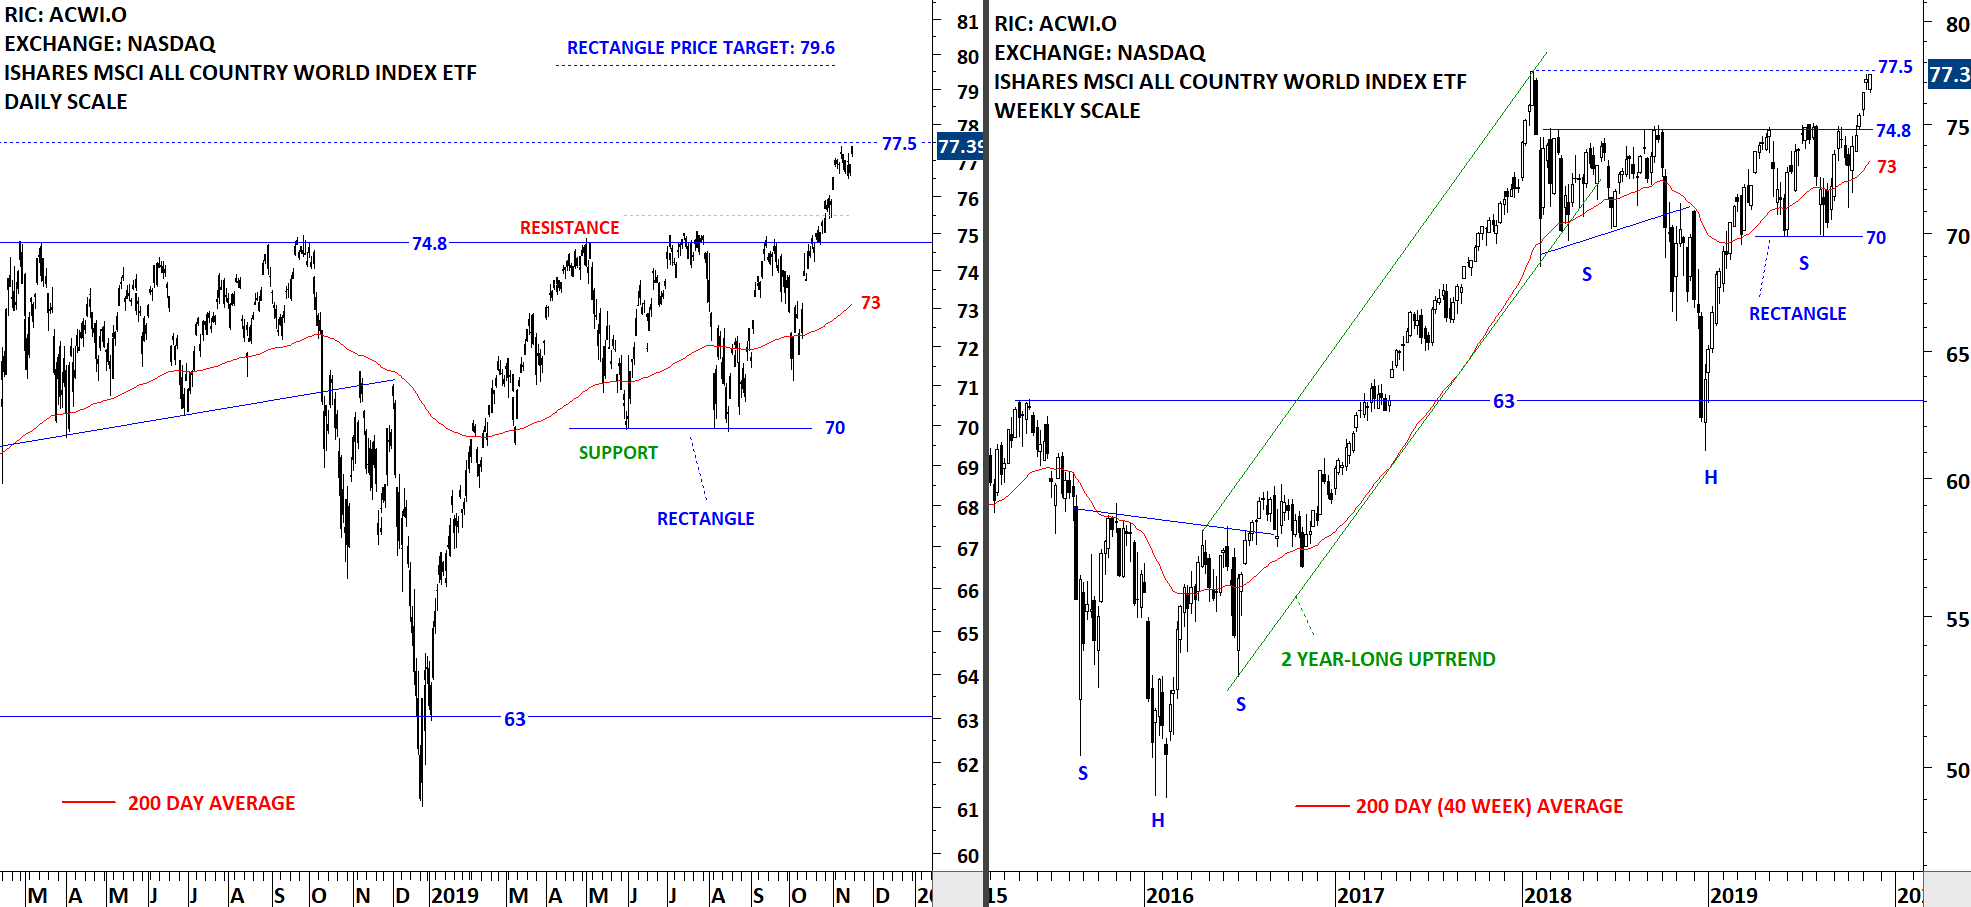
The benchmark for the Global equity markets performance, the iShares MSCI All Country World Index ETF (ACWI.O) remained strong and close to the resistance level at 77.5 levels. The ETF found short-term resistance around 77.5 levels. The 5 month-long rectangle price target stands at 79.6 levels. Breakout above the minor resistance can push the ETF towards the price target at 79.6. Both the daily and weekly price charts show a steady uptrend. 74.8 levels will act as support during any pullback.
 Read More
GLOBAL EQUITY MARKETS – November 9, 2019
REVIEW
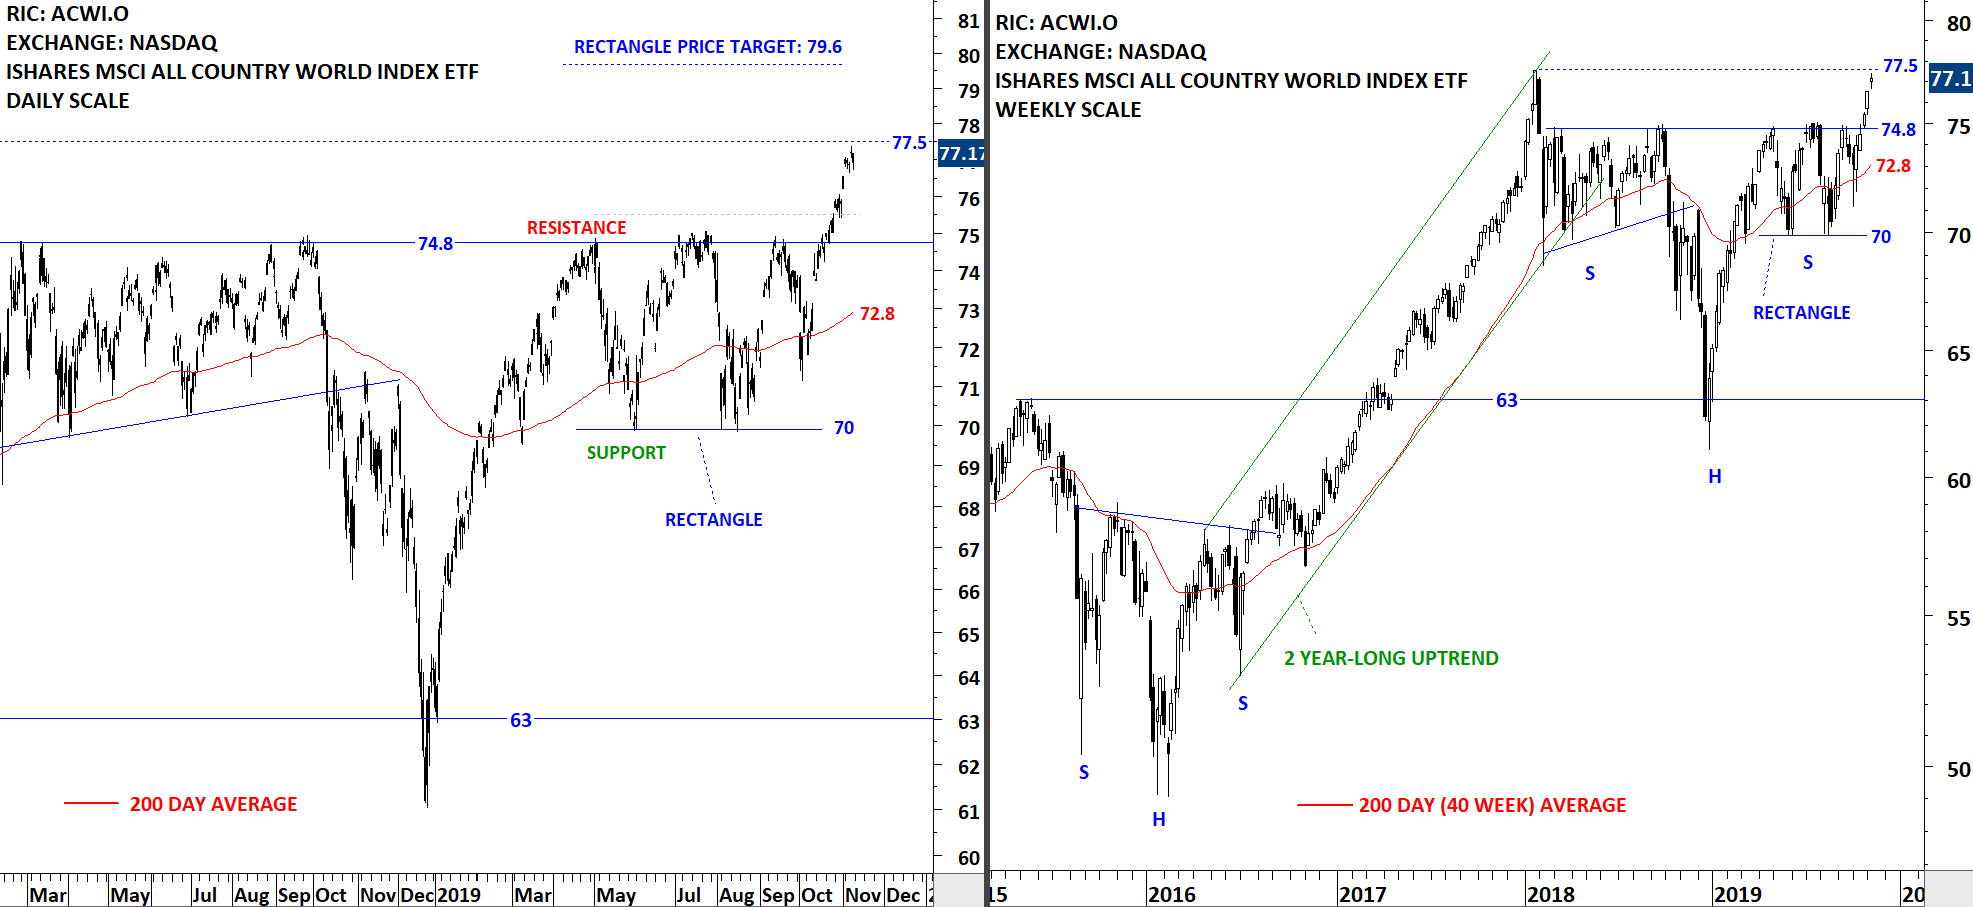
The benchmark for the Global equity markets performance, the iShares MSCI All Country World Index ETF (ACWI.O) continued higher after breaking out from the 5 month-long rectangle. While the long-term chart pattern can be identified as a H&S continuation and has a much higher price objective the short-term chart pattern is possibly a rectangle and the short-term price target stands at 79.6 levels. This week's price action found resistance at the minor high that stands at 77.5 levels. The ETF might find short-term resistance around 77.5 levels. 74.8 levels will act as support during any pullback.
 Read More
