
INTERIM UPDATE – April 28, 2020
After rebounding from the lows many indices continued to remain strong. While some individual equities re-tested and even moved to new lows, many formed higher lows and over the past month possible bullish short-term continuation chart patterns. There are several stocks with the same setups. One important thing to mention, those are short-term chart patterns and are more prone to failure than long-term chart pattern developments. Also many stocks that are forming those short-term consolidations are trading below their 200-day averages. So if we see continuations, at best I will treat them as swing trading opportunities and not for position trading. Below are some of those good looking setups.
Read More
Breakout with a pullback – Application of ATR trailing stop-loss

GLOBAL EQUITY MARKETS – April 25, 2020
REVIEW
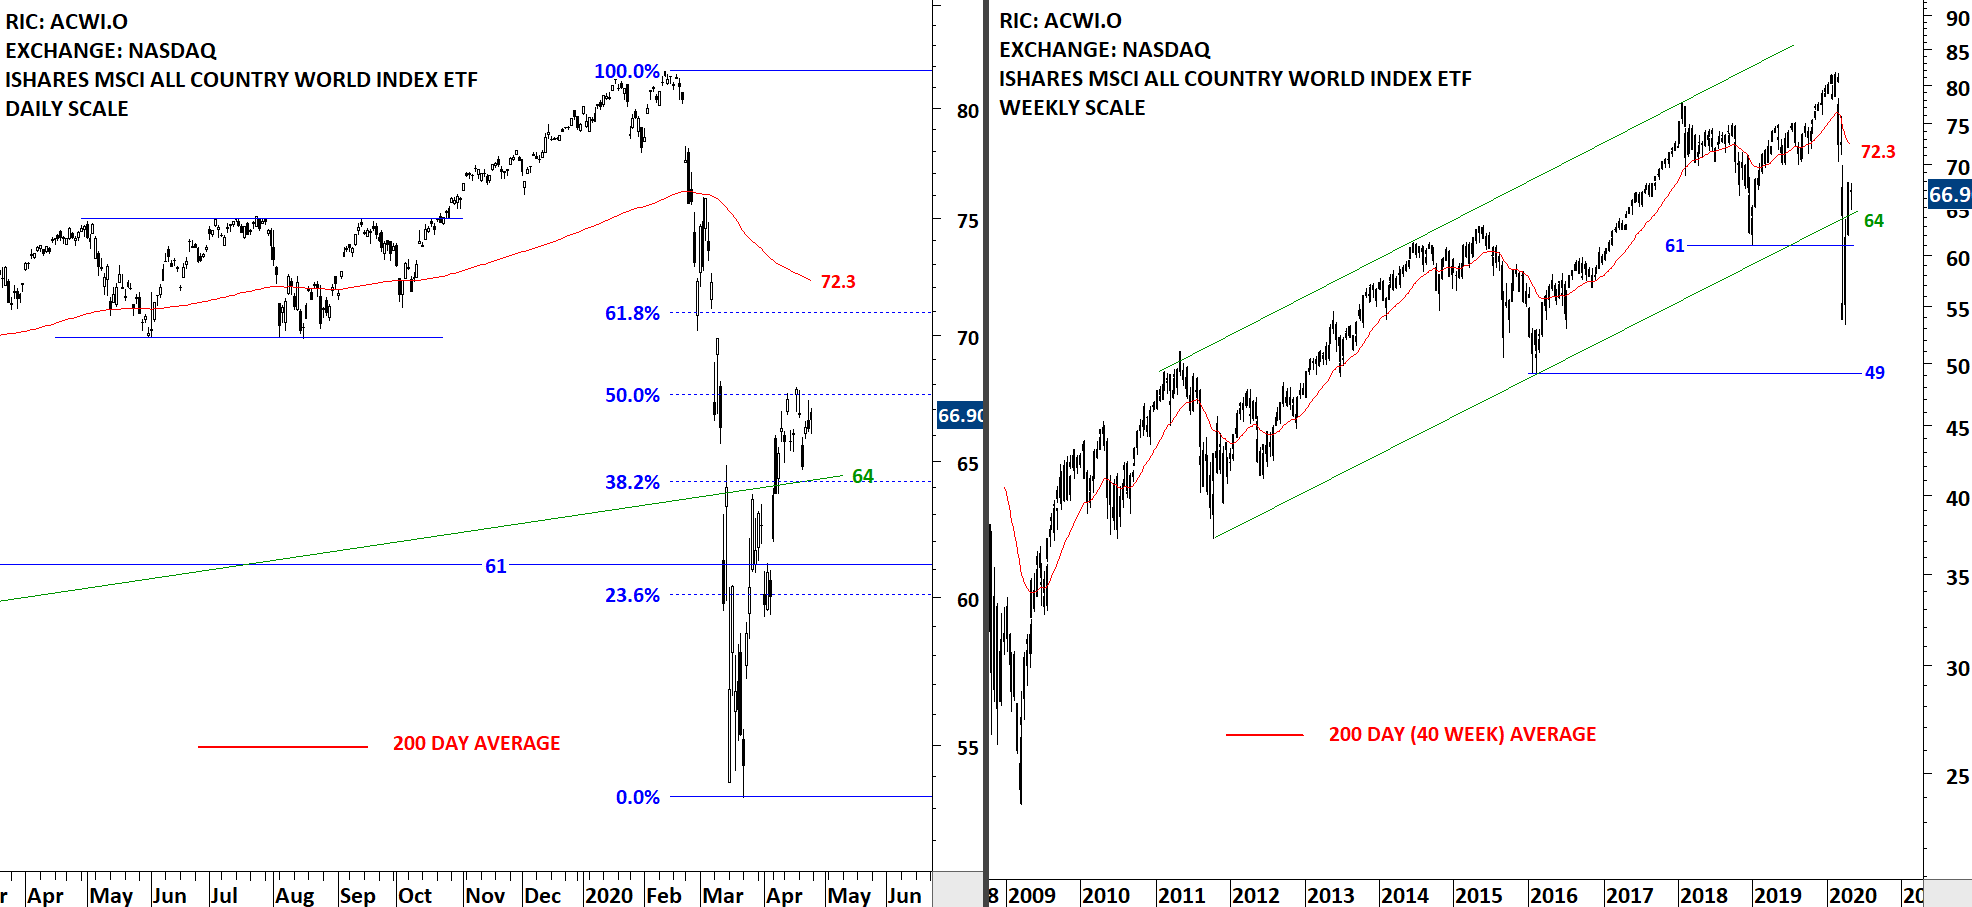
The benchmark for the Global equity markets performance, the iShares MSCI All Country World Index ETF (ACWI.O) continued to hold on to its gains after its rebound that started in Mid-March. From the lows, the ETF recovered 50% of the decline that started in February. The 200-day moving average is far from the price at 72.3 levels. There is no clear chart pattern development on daily and weekly scale price charts. The ETF is in a downtrend below the 200-day average.
 Read More
