Every week Tech Charts Global Equity Markets report features some of the well-defined, mature classical chart patterns under a lengthy watchlist and the chart pattern breakout signals that took place during that week. Global Equity Markets report covers single stocks from developed, emerging and frontier markets, ETF’s and global equity indices. The report starts with a review section that highlights the important chart developments on global equity benchmarks. This blog post features from the breakout alerts section a rectangle chart pattern that completed on the Nikkei Stock Exchange.
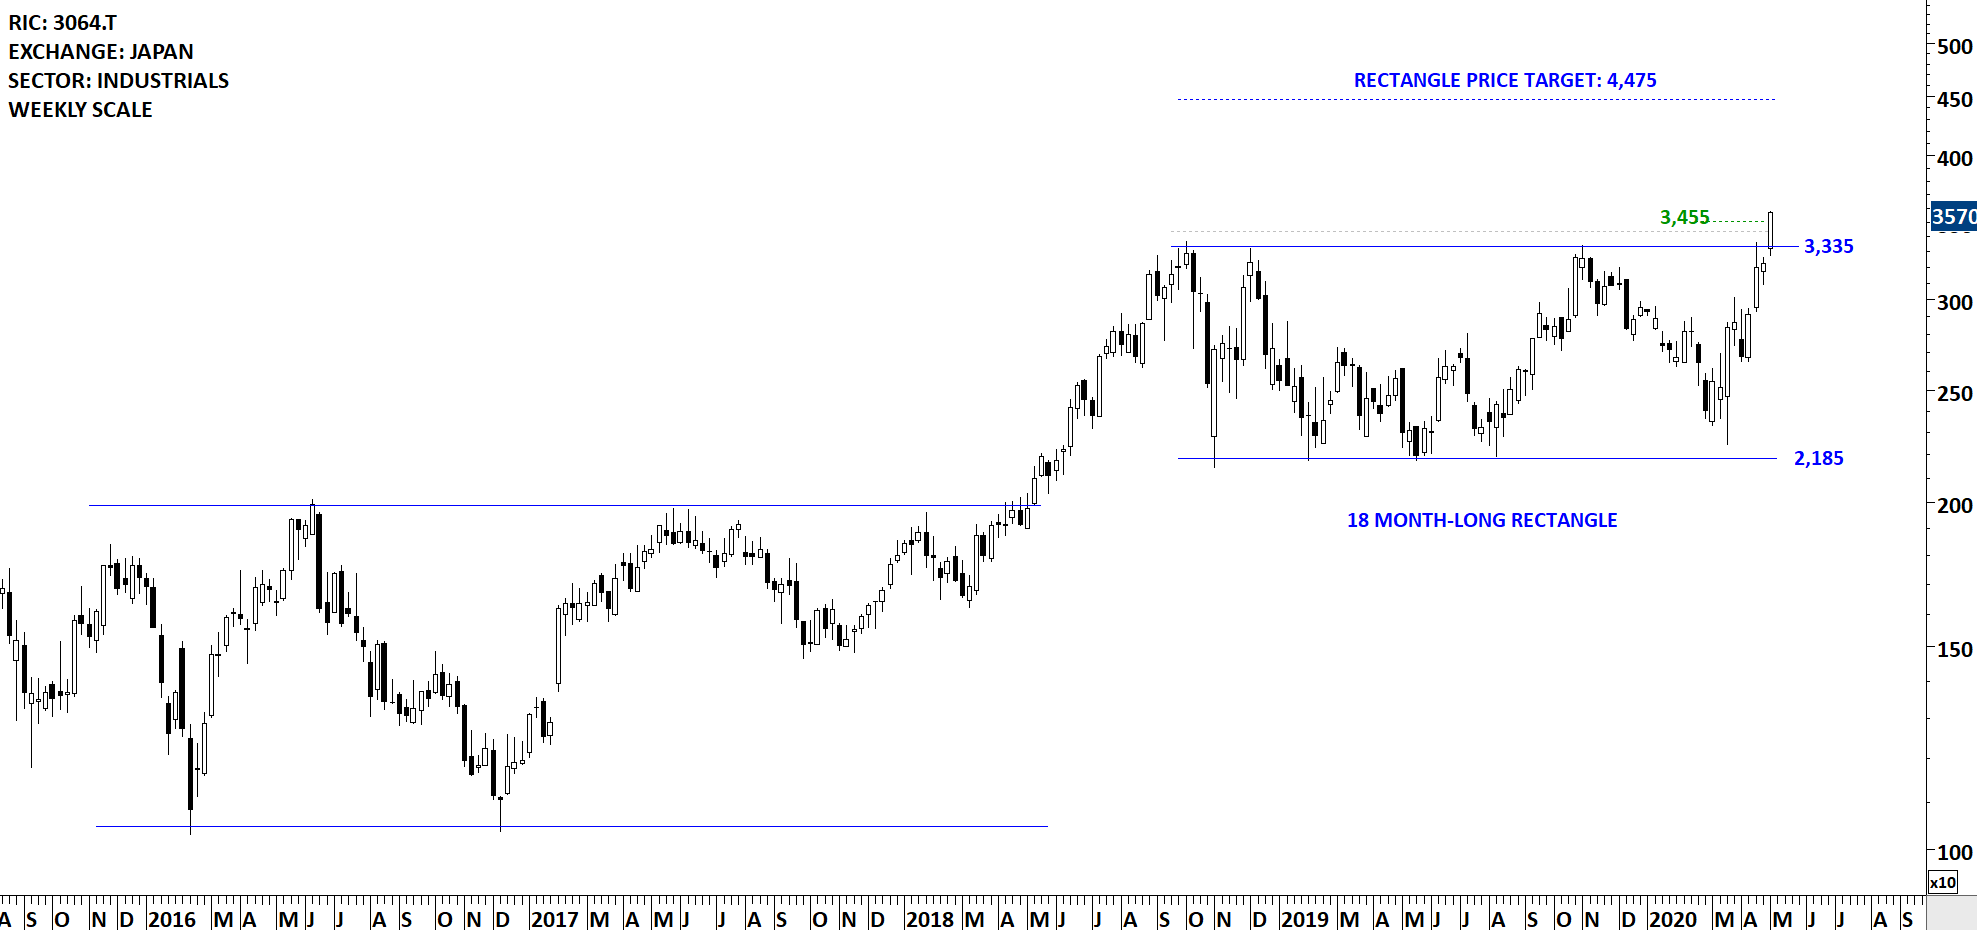
MONOTARO CO LTD (3064.T)
MonotaRO Co.,Ltd. is a Japan-based company principally engaged in the sale of factory indirect materials. The Company sells factory indirect materials to customers, mainly small and medium-sized manufacturing companies in Japan and overseas, by mail order using e-commerce (distribution based on the Internet). The stock is listed on the Tokyo Stock Exchange. Price chart formed an 18 month-long rectangle with the horizontal boundary acting as strong resistance at 3,335.0 levels. The horizontal boundary was tested several times over the course of the chart pattern. The daily close above 3,435.0 levels confirmed the breakout from the 18 month-long rectangle with the possible chart pattern price target of 4,475.0 levels.
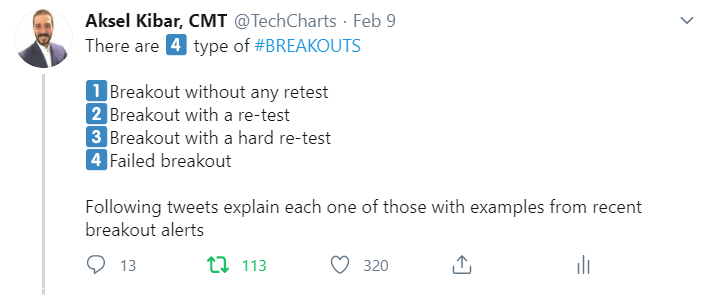
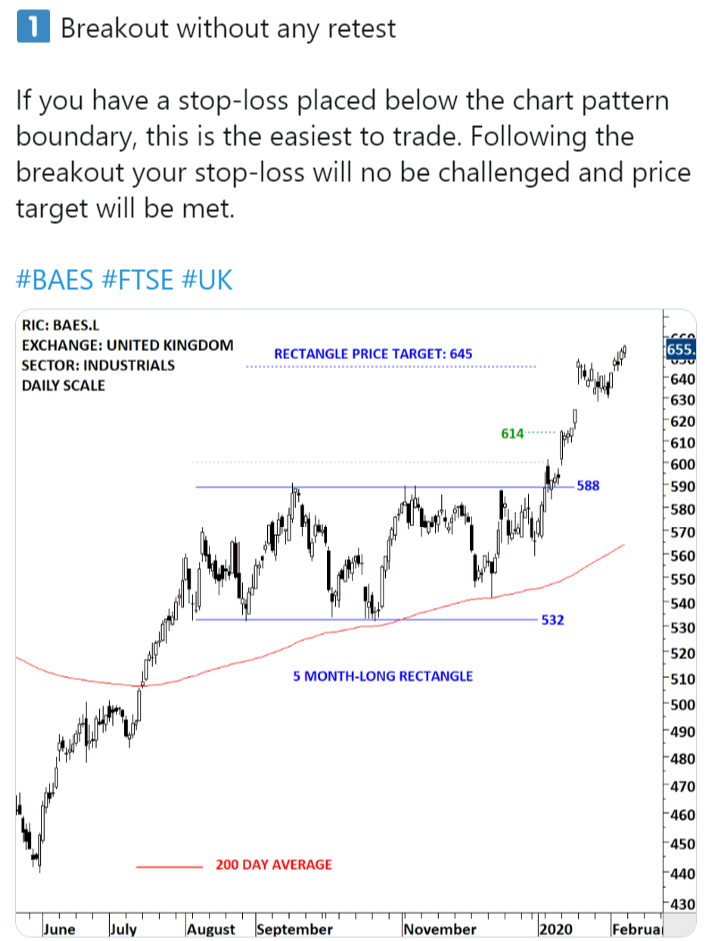
Depending on each trader/investor risk profile a stop-loss can be placed below the chart pattern boundary at 3,335 levels. There are different types of breakouts. I discussed 4 types of breakouts in a twitter thread. I also attached it below for your reference.
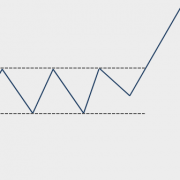
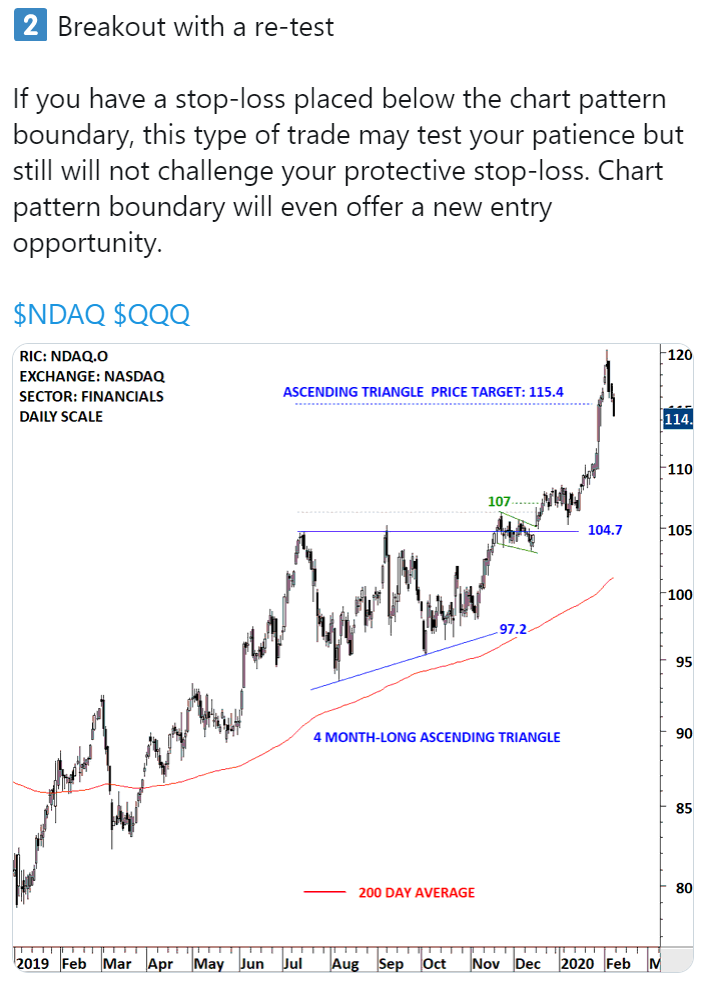
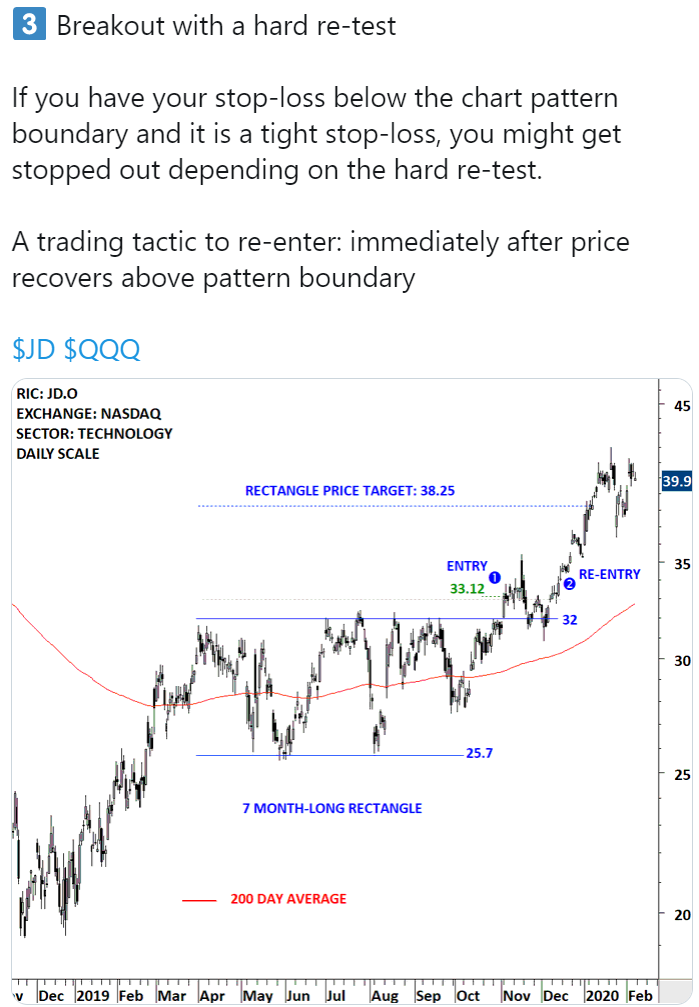
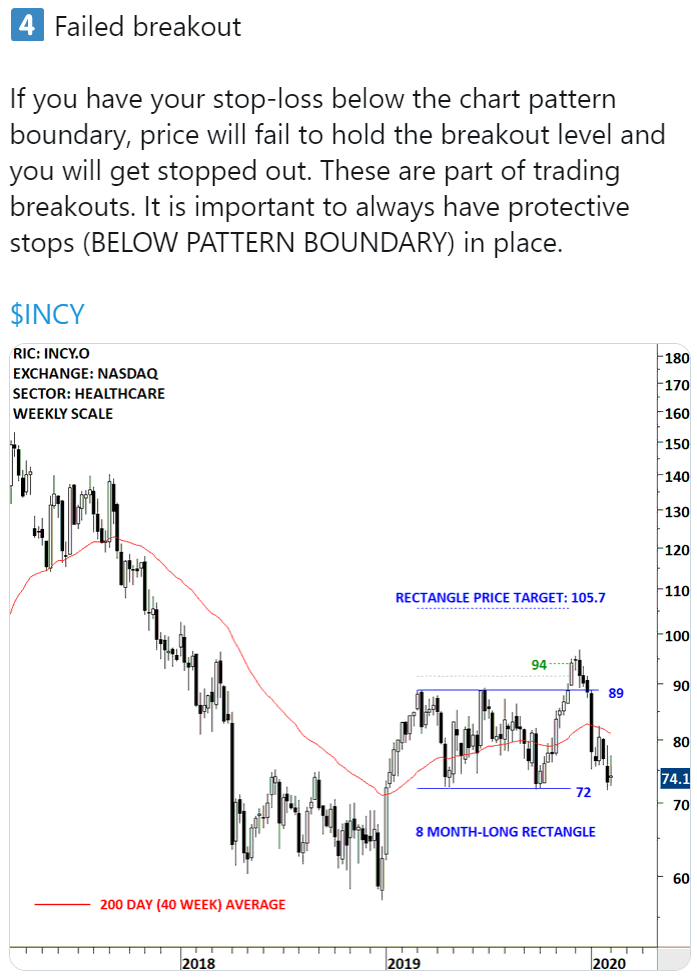
4 TYPES OF BREAKOUTS
Tech Charts Membership

By becoming a Premium Member, you’ll be able to improve your knowledge of the principles of classical charting.
With this knowledge, you can merge them with your investing system. In fact, some investors use my analyses to modify their existing style to invest more efficiently and successfully.
Get Access Now
As a Premium Member of Aksel Kibar’s Tech Charts,
You will receive:
-
Global Equities Report. Delivered weekly.
-
Classical charting principles. Learn patterns and setups.
-
Actionable information. Worldwide indices and stocks of interest.
-
Risk management advice. The important trading points of each chart.
-
Information on breakout opportunities. Identify the ones you want to take action on.
-
Video tutorials. How patterns form and why they succeed or fail.
-
Watch list alerts. As they become available so you can act quickly.
-
Breakout alerts. Usually once a week.
-
Access to everything (now and as it becomes available)
o Reports
o Videos and video series
-
Multi-part webinar course. You learn the 8 most common charting principles.
-
Webinars. Actionable and timely advice on breaking out chart patterns.
For your convenience your membership auto renews each year.
Get Access Now