GLOBAL EQUITY MARKETS – May 30, 2020

REVIEW


The benchmark for the Global equity markets performance, the iShares MSCI All Country World Index ETF (ACWI.O) is testing its 200-day moving average that is acting as resistance at 71.7 levels. Last two month’s price action can be identified as a rising channel. Price can remain inside the trend channel. There is a gap opening between 69.2 and 67.8 levels which can be filled during a possible pullback.

Read more

INTERIM UPDATE – May 29, 2020

I start my research on Mondays and finalize by end of day Thursday. Friday is dedicated to putting all ideas to the report format. During the week I come across good setups and those are featured in the weekly report. However, there are those that pop during the week and is worth bringing to your attention before the week finalizes. Below are 3 additions to Tech Charts watchlist that may experience breakouts. These charts will also be included in the weekly update.

Read more

Tech Charts Year in Review with Aksel – May 2020

Tech Charts Year in Review – Year Three

  • A study on Chart Pattern Reliability with the available sample data over the past year
  • Chart patterns with horizontal boundaries have been more reliable compared with breakouts from chart patterns with diagonal boundaries
  • Long-term trends impact the number of bullish and bearish chart pattern setups and breakout opportunities
  • H&S tops, H&S bottoms and descending triangles have been reliable with breakouts from well-defined horizontal boundaries
  • Developing breakout opportunities
  • Live Q&A

Member Questions

  1. When analyzing charts for possible trading opportunities, do you use good liquidity in the market as a trade filter, and what method do you use to determine good liquidity? 1:00:17
  2. It will be nice if the performance of chart alerts can be tracked in an excel sheet. 1:01:42
  3. How often do you trade personally? Did you trade all of the patterns summarized in the “Phases of market trends” slide? 1:02:19
  4. I understand you don’t like to use volume, however in technical-analysis-and-stock-market, Richard talks a lot about high volume on upward breakouts, can you explain why you don’t use this at least for breakouts? 1:03:15 (LINK: VOLUME AS A CONFIRMING INDICATOR)
  5. Can you talk about how you place stop losses after entering a position? 1:05:58 (LINKS: Breakout with a pullback – Application of ATR trailing stop-loss
    and ATR Trailing Stop-Loss – H&S Top)
  6. Do you ever look at charts adjusting for dividends? 1:06:32
  7. The statistics on page 7 – does Aksel include failure signals? Such as H&S failure, cup & handle failure, or even asc. des. triangle failures (breaking out of the diagonal line)? 1:07:11 (LINK: Head and Shoulders Top – Failure)
  8. Why do you ignore wedges? You mentioned this on slide 7; I just wanted to understand your reasons. 1:08:12 (LINK: DIAGONAL BOUNDARIES ARE LESS RELIABLE)
  9. Slide 9 – Can you repeat your MAs for weekly and daily timeframes? 1:10:22
  10. Slide 8 – Can you explain how you set your ‘pattern failure’ level? 1:10:35
  11. Your charts are mostly weekly – does it mean you disregard shorter timeframe formations? If yes, why? 1:11:35
  12. Your H&S examples are all with horizontal shoulders – what is your view of inclined H&S? 1:12:18
  13. Is it true some stocks follow classical patterns better than others over a long period of time? Hence if we find those names, we should follow them long term even if a chart finished this target/negation? 1:13:06
  14. It would be extremely useful to add to the statistics the average ratio between target and negation levels with respect to the breakout level (sort of profit/loss), per pattern type. 1:14:19
  15. Have you ever used a pullback strategy? It seems quite popular for some traders, what % of traders do you think are doing this? 1:14:34
  16. Do you recommend using different stop strategy in terms of the pattern length? i.e., weekly ATR stop if pattern > 12 month, daily ATR stop if the pattern is 4 – 26 weeks. 1:15:24
  17. Page 20, the symm. triangle, do you usually place negation level at the apex of the triangle because E&M book suggests that’s a strong support? 1:16:26
  18. Could you show us a breakdown of BreakOut success/failure statistics by Exchanges (or Countries, currencies)? It is relevant to those who do not trade signals in all exchanges/countries. 1:16:51
  19. Are there national markets that demonstrate less emphasis on chart patterns? i.e., heavier % of “fundamental investors”? 1:17:25
  20. Sometimes, you do not plot the 200MA, is there any particular reason? Besides 200d MA, do you use any other MA? 1:18:19
  21. Are you ever concerned with how extended the minor advance is in a stock prior to the breakout? FDN for example bounced straight from the lower boundary; do we have to be careful of profit-taking? 1:18:53
  22. How do you identify the price for horizontal and diagonal boundaries? 1:19:37
  23. I loved to see the slide of statistics – are there more studies available on the website? (Maybe also compared to different observed timeframes?) 1:19:58
  24. How do you treat spindles crossing the chart boundary during the weekly or daily chart development? Do you use a lower time frame to negate the false breakouts? 1:20:23
  25. In terms of timing, what is the time horizon you usually see breakouts playing out? 1:20:58
  26. How do you balance the initial stop loss positioning between chart pattern boundary and chart negation point to balance the position sizing and the risk as basis points in relation to the market volatility? 1:21:40
  27. Between log scale and linear scale, which one is better? 1:22:14
  28. For double tops-bottoms or H&Ss, is there a limit on the percentage (such as 3%) between highs and lows on double tops-bottoms or between right and left shoulders? 1:23:17

Read more

CUP & HANDLE CONTINUATION

Every week Tech Charts Global Equity Markets report features some of the well-defined, mature classical chart patterns under a lengthy watchlist and the chart pattern breakout signals that took place during that week. Global Equity Markets report covers single stocks from developed, emerging and frontier markets, ETF’s and global equity indices. The report starts with a review section that highlights the important chart developments on global equity benchmarks. This blog post features from the watchlist section a cup & handle continuation chart pattern listed on the Nasdaq Stock Exchange.

ADVANCED MICRO DEVICES INC (AMD.O)

Advanced Micro Devices, Inc. is a global semiconductor company. The Company is engaged in offering x86 microprocessors, as standalone devices or as incorporated into an accelerated processing unit (APU), chipsets, discrete graphics processing units (GPUs) and professional graphics, and server and embedded processors and semi-custom System-on-Chip (SoC) products and technology for game consoles. The stock is listed on the Nasdaq Stock Exchange. Price chart formed a 4 month-long cup & handle with the horizontal boundary acting as strong resistance at 58.5 levels. The horizontal boundary was tested several times over the course of the chart pattern. A daily close above 60.2 levels will confirm the breakout from the 4 month-long cup & handle with the possible chart pattern price target of 77.6 levels.


Tech Charts Membership

By becoming a Premium Member, you’ll be able to improve your knowledge of the principles of classical charting.

With this knowledge, you can merge them with your investing system. In fact, some investors use my analyses to modify their existing style to invest more efficiently and successfully.

Get Access Now

As a Premium Member of Aksel Kibar’s Tech Charts,

You will receive:

  • Global Equities Report. Delivered weekly.
  • Classical charting principles. Learn patterns and setups.
  • Actionable information. Worldwide indices and stocks of interest.
  • Risk management advice. The important trading points of each chart.
  • Information on breakout opportunities. Identify the ones you want to take action on.
  • Video tutorials. How patterns form and why they succeed or fail.
  • Watch list alerts. As they become available so you can act quickly.
  • Breakout alerts. Usually once a week.
  • Access to everything (now and as it becomes available)
    o Reports
    o Videos and video series
  • Multi-part webinar course. You learn the 8 most common charting principles.
  • Webinars. Actionable and timely advice on breaking out chart patterns.

For your convenience your membership auto renews each year.

Get Access Now

GLOBAL EQUITY MARKETS – May 23, 2020

REVIEW


The benchmark for the Global equity markets performance, the iShares MSCI All Country World Index ETF (ACWI.O) is trading below its 200-day moving average that is acting as resistance at 71.7 levels. The ETF recovered 62% of the decline that started in February. Last one month’s price action can be identified as a rising channel. Price can remain inside the trend channel. There is a gap opening between 69.2 and 67.8 levels which can be filled during a possible pullback.

Read more

Tech Charts Year in Review with Aksel – Thursday, May 21, 830 am mountain

Dear Tech Charts Members,

Tech Charts Year in Review. Aksel will compare the before and after of charts shared with Members over the last year. As always, we’ll end the webinar with a live Q&A. 

Scheduled for: Thursday, May 21, 2020, at 8:30 am mountain (register below)

Tech Charts Year in Review – Year Three

  • A study on Chart Pattern Reliability with the available sample data over the past year
  • Chart patterns with horizontal boundaries have been more reliable compared with breakouts from chart patterns with diagonal boundaries
  • Long-term trends impact the number of bullish and bearish chart pattern setups and breakout opportunities
  • H&S tops, H&S bottoms and descending triangles have been reliable with breakouts from well-defined horizontal boundaries
  • Developing breakout opportunities
  • Live Q&A

Read more

GLOBAL EQUITY MARKETS – May 16, 2020

REVIEW


The benchmark for the Global equity markets performance, the iShares MSCI All Country World Index ETF (ACWI.O) is possibly forming a short-term consolidation after its strong rebound from the March lows. The ETF recovered close to 62% of the decline that started in February. Price came close to its 200-day moving average which is now at 71.7 levels. The ETF is in a downtrend below the 200-day average.

Read more

H&S BOTTOM REVERSAL

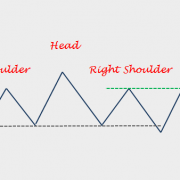
Every week Tech Charts Global Equity Markets report features some of the well-defined, mature classical chart patterns under a lengthy watchlist and the chart pattern breakout signals that took place during that week. Global Equity Markets report covers single stocks from developed, emerging and frontier markets, ETF’s and global equity indices. The report starts with a review section that highlights the important chart developments on global equity benchmarks. This blog post features from the watchlist section a head and shoulder bottom reversal chart pattern that is listed on the Paris Stock Exchange.

Over the past 3 years (2017-2020) Tech Charts Global Equity Markets report alerted members on 616 breakouts and breakdowns (long and short opportunities). The compiled statistics on those breakouts are as below. A chart pattern once completed with a confirmed breakout either reaches its chart pattern price target (successful) or it reaches chart pattern negation level (failed). It is interesting to note that H&S bottom reversal has been one of the best performing chart pattern followed by another H&S; the H&S top reversal. More detailed statistics will be shared during our members annual review which should take place by end of May.

REMY COINTREAU SA (RCOP.PA)

Remy Cointreau SA is a France-based company engaged in the production and distribution of wines and spirits. The stock is listed on the Paris Stock Exchange. Price chart formed a 4 month-long head and shoulder bottom with the horizontal boundary acting as strong resistance at 105.0 levels. The horizontal boundary was tested several times over the course of the chart pattern. A daily close above 107.0 levels will confirm the breakout from the 4 month-long head and shoulder bottom with the possible chart pattern price target of 126.0 levels. (Data as of May 12, 2020, CET 13:00)


Tech Charts Membership

By becoming a Premium Member, you’ll be able to improve your knowledge of the principles of classical charting.

With this knowledge, you can merge them with your investing system. In fact, some investors use my analyses to modify their existing style to invest more efficiently and successfully.

Get Access Now

As a Premium Member of Aksel Kibar’s Tech Charts,

You will receive:

  • Global Equities Report. Delivered weekly.
  • Classical charting principles. Learn patterns and setups.
  • Actionable information. Worldwide indices and stocks of interest.
  • Risk management advice. The important trading points of each chart.
  • Information on breakout opportunities. Identify the ones you want to take action on.
  • Video tutorials. How patterns form and why they succeed or fail.
  • Watch list alerts. As they become available so you can act quickly.
  • Breakout alerts. Usually once a week.
  • Access to everything (now and as it becomes available)
    o Reports
    o Videos and video series
  • Multi-part webinar course. You learn the 8 most common charting principles.
  • Webinars. Actionable and timely advice on breaking out chart patterns.

For your convenience your membership auto renews each year.

Get Access Now

GLOBAL EQUITY MARKETS – May 9, 2020

REVIEW


The benchmark for the Global equity markets performance, the iShares MSCI All Country World Index ETF (ACWI.O) continued to hold on to its gains after the ETF experienced a setback. The ETF recovered close to 62% of the decline that started in February. Price came close to its 200-day moving average which is now at 71.9 levels. The ETF is in a downtrend below the 200-day average. I continue to monitor this ETF for a possible short-term chart pattern development.

Read more

RECTANGLE BREAKOUT

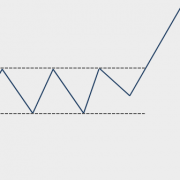
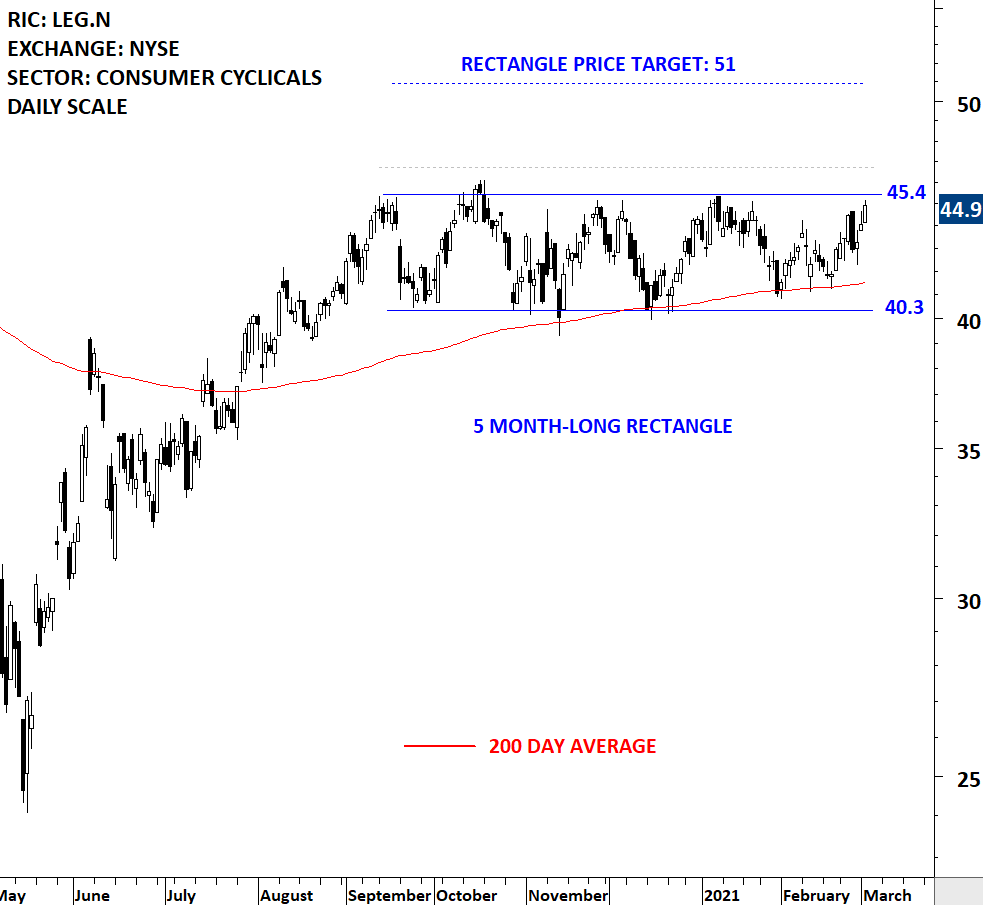
Every week Tech Charts Global Equity Markets report features some of the well-defined, mature classical chart patterns under a lengthy watchlist and the chart pattern breakout signals that took place during that week. Global Equity Markets report covers single stocks from developed, emerging and frontier markets, ETF’s and global equity indices. The report starts with a review section that highlights the important chart developments on global equity benchmarks. This blog post features from the breakout alerts section a rectangle chart pattern that completed on the Nikkei Stock Exchange.

MONOTARO CO LTD (3064.T)

MonotaRO Co.,Ltd. is a Japan-based company principally engaged in the sale of factory indirect materials. The Company sells factory indirect materials to customers, mainly small and medium-sized manufacturing companies in Japan and overseas, by mail order using e-commerce (distribution based on the Internet). The stock is listed on the Tokyo Stock Exchange. Price chart formed an 18 month-long rectangle with the horizontal boundary acting as strong resistance at 3,335.0 levels. The horizontal boundary was tested several times over the course of the chart pattern. The daily close above 3,435.0 levels confirmed the breakout from the 18 month-long rectangle with the possible chart pattern price target of 4,475.0 levels.

Depending on each trader/investor risk profile a stop-loss can be placed below the chart pattern boundary at 3,335 levels. There are different types of breakouts. I discussed 4 types of breakouts in a twitter thread. I also attached it below for your reference.

4 TYPES OF BREAKOUTS


Tech Charts Membership

By becoming a Premium Member, you’ll be able to improve your knowledge of the principles of classical charting.

With this knowledge, you can merge them with your investing system. In fact, some investors use my analyses to modify their existing style to invest more efficiently and successfully.

Get Access Now

As a Premium Member of Aksel Kibar’s Tech Charts,

You will receive:

  • Global Equities Report. Delivered weekly.
  • Classical charting principles. Learn patterns and setups.
  • Actionable information. Worldwide indices and stocks of interest.
  • Risk management advice. The important trading points of each chart.
  • Information on breakout opportunities. Identify the ones you want to take action on.
  • Video tutorials. How patterns form and why they succeed or fail.
  • Watch list alerts. As they become available so you can act quickly.
  • Breakout alerts. Usually once a week.
  • Access to everything (now and as it becomes available)
    o Reports
    o Videos and video series
  • Multi-part webinar course. You learn the 8 most common charting principles.
  • Webinars. Actionable and timely advice on breaking out chart patterns.

For your convenience your membership auto renews each year.

Get Access Now