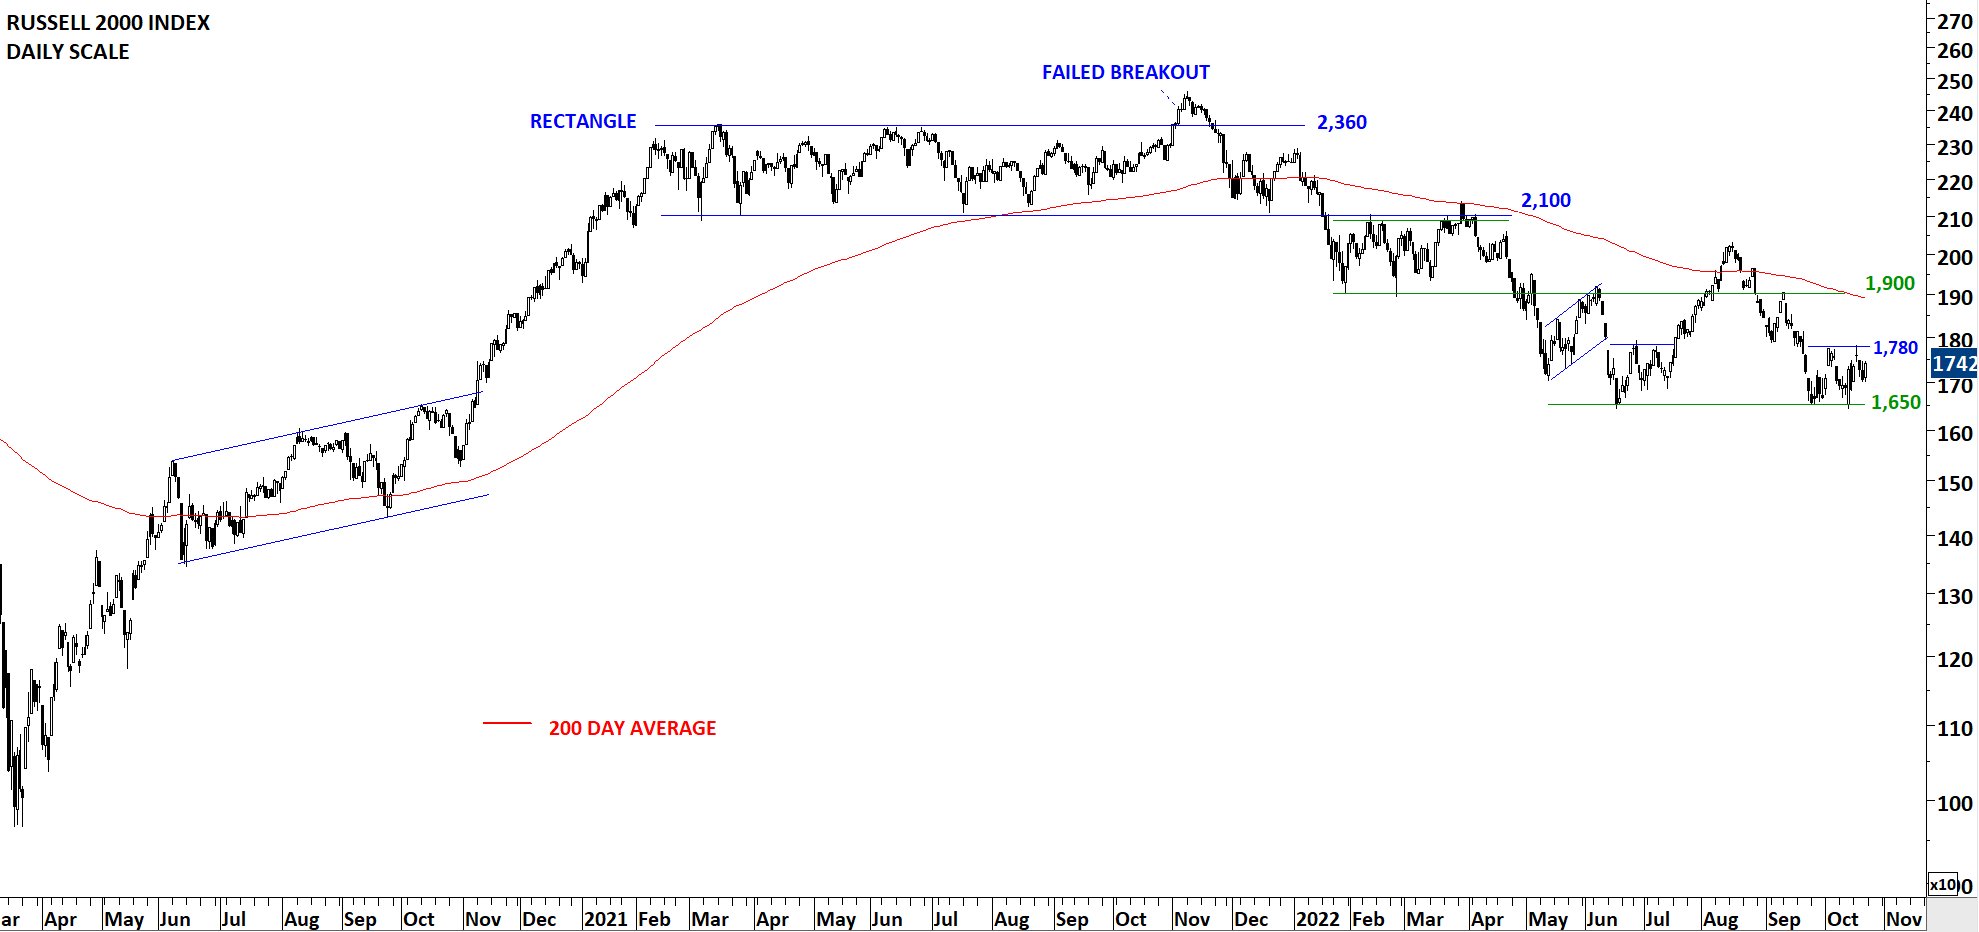
Live Webinar and Q&A with Aksel – Thursday, December 16, 8:30 am mountain

Dear Tech Charts Members,

We are continuing our Member webinar series with chart pattern reliability and how the latest market conditions have impacted success rates on different chart patterns. 

Scheduled for: Thursday, December 16, 8:30 am mountain (register below)

Read more

EUROPE ETFs

Every week Tech Charts Global Equity Markets report features some of the well-defined, mature classical chart patterns under a lengthy watchlist and the chart pattern breakout signals that took place during that week. Global Equity Markets report covers single stocks from developed, emerging and frontier markets, ETF’s, select commodities, cryptocurrencies and global equity indices. Below charts are from the review section of the weekly report. It is featuring IEV and EFA ETFs listed on the New York Stock Exchange. If you are trading range bound price action between well-defined boundaries, these opportunities might be valuable. I see both charts at inflection points. A rebound from the lower boundaries can put these ETFs back into positive territory. A breakdown will act as bearish reversal.

EUROPEAN EQUITY BENCHMARKS

ISHARE EUROPE ETF (IEV) formed 6 month-long rectangle with the lower boundary acting as support at 51.5 and the upper boundary as resistance at 55.7 levels. Breakdown below the lower boundary can confirm the rectangle as a top reversal with the possible price target of 48 levels.

ISHARE MSCI EAFE ETF (EFA) formed a 6 month-long rectangle with the upper boundary acting as resistance at 82 and the lower boundary as support at 76.4 levels. Price is consolidating right below the 200-day average. Breakdown below the horizontal support can result in a top reversal with the price target at 71 levels.

Here is a breakdown of the ISHARES MSCI EAFE ETF for those of you who are not familiar with MSCI benchmarked funds.

Data as of Oct 29, 2021. Source: msci.com


Tech Charts Membership

By becoming a Premium Member, you’ll be able to improve your knowledge of the principles of classical charting.

With this knowledge, you can merge them with your investing system. In fact, some investors use my analyses to modify their existing style to invest more efficiently and successfully.

Get Access Now

As a Premium Member of Aksel Kibar’s Tech Charts,

You will receive:

  • Global Equities Report. Delivered weekly.
  • Classical charting principles. Learn patterns and setups.
  • Actionable information. Worldwide indices and stocks of interest.
  • Risk management advice. The important trading points of each chart.
  • Information on breakout opportunities. Identify the ones you want to take action on.
  • Video tutorials. How patterns form and why they succeed or fail.
  • Watch list alerts. As they become available so you can act quickly.
  • Breakout alerts. Usually once a week.
  • Access to everything (now and as it becomes available)
    o Reports
    o Videos and video series
  • Multi-part webinar course. You learn the 8 most common charting principles.
  • Webinars. Actionable and timely advice on breaking out chart patterns.

For your convenience your membership auto renews each year.

Get Access Now

CRYPTOCURRENCIES – December 5, 2021

The sharp correction in cryptocurrencies put more pressure on BTC than many other pairs. After a sell-off like this our attention should be on the price charts that managed to remain strong and close to their resistance levels. Usually those that hold well will be the ones to recover to new highs when momentum returns.

Read more

GLOBAL EQUITY MARKETS – December 4, 2021

REVIEW


The benchmark for the Global equity markets performance, the iShares MSCI All Country World Index ETF (ACWI.O) is in an uptrend. Failure to hold above 105.5 levels resulted in a failed breakout and is now pulling the price towards the long-term average at 100 levels. Another horizontal support is standing at 99 levels, making the range 99-100; the next possible strong support area. 105.5 becomes resistance again. So far, price action looks like a reversion to the mean.

Read more

GLOBAL EQUITY MARKETS – November 27, 2021

REVIEW


The benchmark for the Global equity markets performance, the iShares MSCI All Country World Index ETF (ACWI.O) is in an uptrend. Failure to hold above 105.5 levels resulted in a failed breakout and is now pull the price towards the long-term average at 100 levels. Another horizontal support is standing at 99 levels, making the range 99-100 the next possible strong support area. 105.5 becomes resistance again.


Read more

CRYPTOCURRENCIES – November 21, 2021

Some of the exciting chart patterns that have completed are cup & handle continuation on ETHUSD, H&S continuation on EGLDUSD and CHRUSD. I’ve added more exciting setups and also pairs that can outperform BTC in the following months.

Read more

GLOBAL EQUITY MARKETS – November 20, 2021

REVIEW


The benchmark for the Global equity markets performance, the iShares MSCI All Country World Index ETF (ACWI.O) is in an uptrend. There is no reversal chart pattern on the daily scale price chart. This week’s price consolidated and remained above the short-term support level at 105.5. Breakout above 105.5 levels resumed the existing uptrend. Previous resistance becomes the new support at 105.5 levels. Long-term average is also acting as support at 99.7 levels. Failure to hold above 105.5 levels can result in a failed breakout and pull the price towards the long-term average.


Read more

SILVER

Every week Tech Charts Global Equity Markets report features some of the well-defined, mature classical chart patterns under a lengthy watchlist and the chart pattern breakout signals that took place during that week. Global Equity Markets report covers single stocks from developed, emerging and frontier markets, ETF’s, select commodities, cryptocurrencies and global equity indices. Below chart is from the review section of the weekly report. It is featuring SILVER prices on different time frames.

SILVER (CASH PRICE)

Silver remains range bound between 21.8 and 30 levels. A great text-book opportunity might be developing as price pulled back for couple of weeks to form the right shoulder of a possible H&S bottom. Breakout above the 200-day average changed the outlook to positive. A possible H&S bottom reversal might be completing (as can be seen on daily scale) with the neckline at 24.7 levels. Price target for the H&S bottom reversal stands at 27.7 levels.

The daily scale price chart of Silver shows much better the developing possible H&S bottom with the neckline that was acting as resistance at 24.7 levels. This was also the 200-day average. Breakout cleared both technical hurdles and now suggests higher prices. Price objective for the H&S bottom stands at 27.7 levels. The low of the right shoulder at 23 levels will act as the chart pattern negation level for the H&S bottom reversal.


Tech Charts Membership

By becoming a Premium Member, you’ll be able to improve your knowledge of the principles of classical charting.

With this knowledge, you can merge them with your investing system. In fact, some investors use my analyses to modify their existing style to invest more efficiently and successfully.

Get Access Now

As a Premium Member of Aksel Kibar’s Tech Charts,

You will receive:

  • Global Equities Report. Delivered weekly.
  • Classical charting principles. Learn patterns and setups.
  • Actionable information. Worldwide indices and stocks of interest.
  • Risk management advice. The important trading points of each chart.
  • Information on breakout opportunities. Identify the ones you want to take action on.
  • Video tutorials. How patterns form and why they succeed or fail.
  • Watch list alerts. As they become available so you can act quickly.
  • Breakout alerts. Usually once a week.
  • Access to everything (now and as it becomes available)
    o Reports
    o Videos and video series
  • Multi-part webinar course. You learn the 8 most common charting principles.
  • Webinars. Actionable and timely advice on breaking out chart patterns.

For your convenience your membership auto renews each year.

Get Access Now

GLOBAL EQUITY MARKETS – November 13, 2021

REVIEW


The benchmark for the Global equity markets performance, the iShares MSCI All Country World Index ETF (ACWI.O) is in an uptrend. There is no reversal chart pattern on the daily scale price chart. This week’s price action pulled back and rebounded from the short-term support level at 105.5. Breakout above 105.5 levels resumed the existing uptrend. Previous resistance becomes the new support at 105.5 levels. Long-term average is also acting as support at 99.4 levels.


Read more