Tech Charts Year in Review – Year Six, May 2023 Webinar
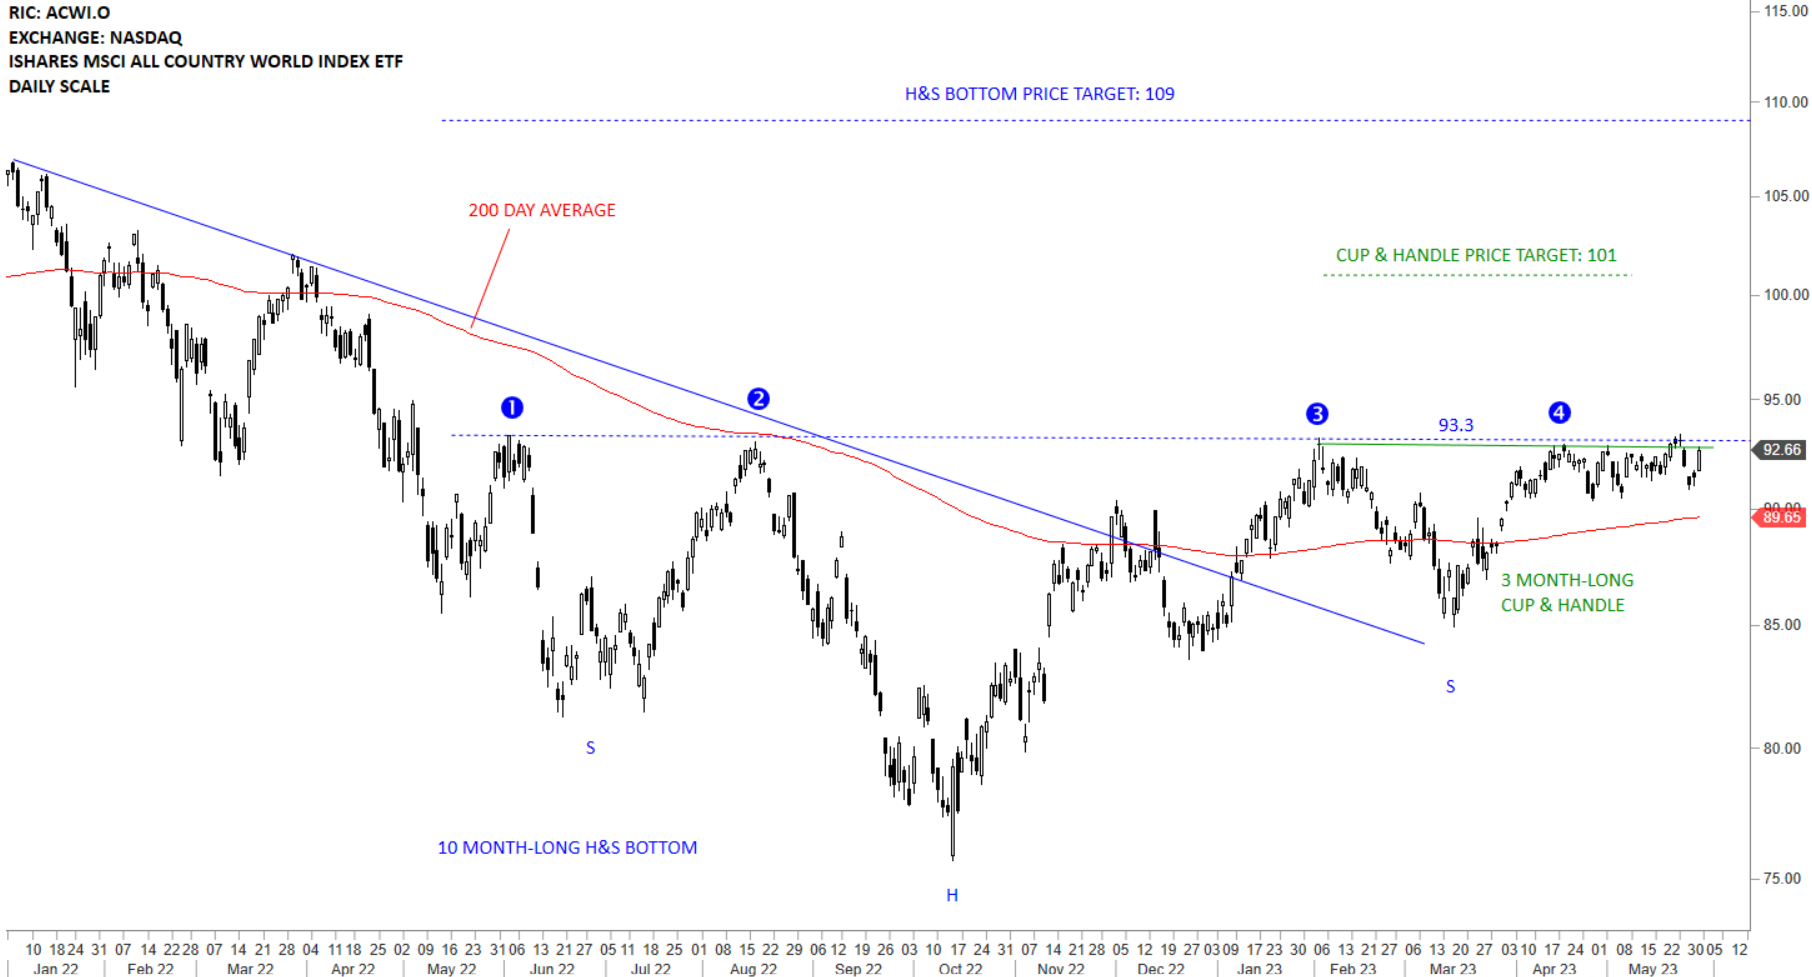
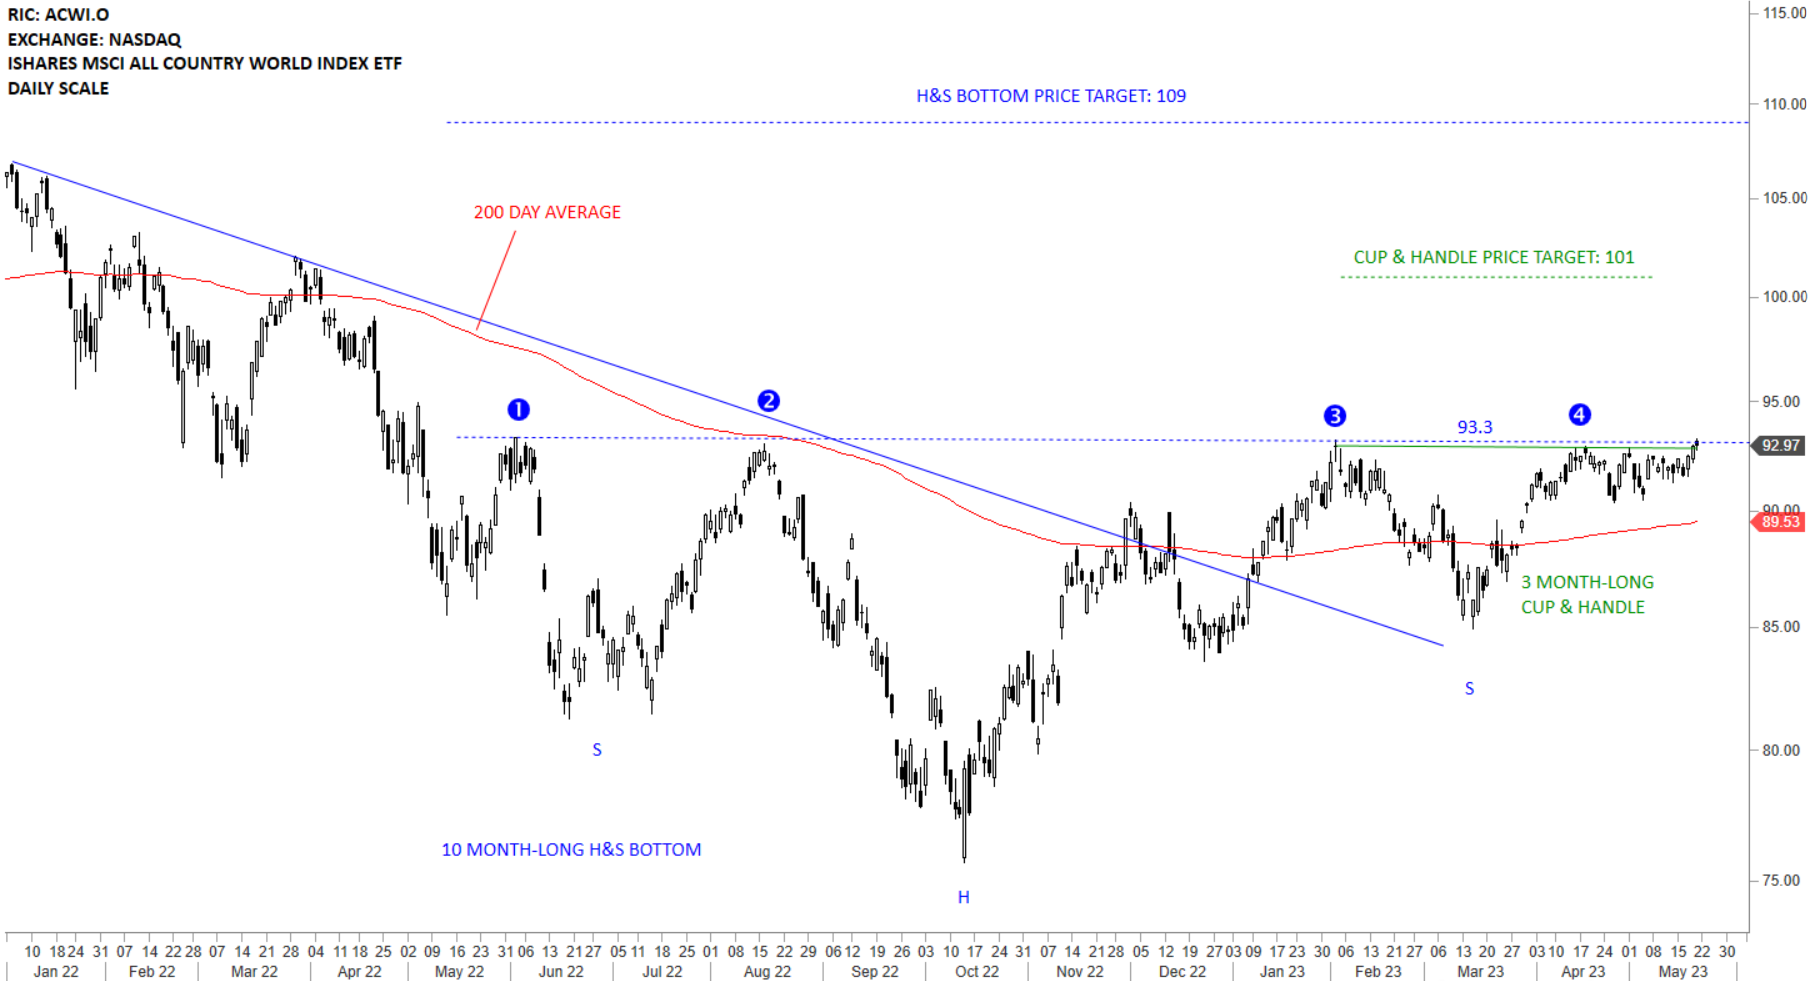
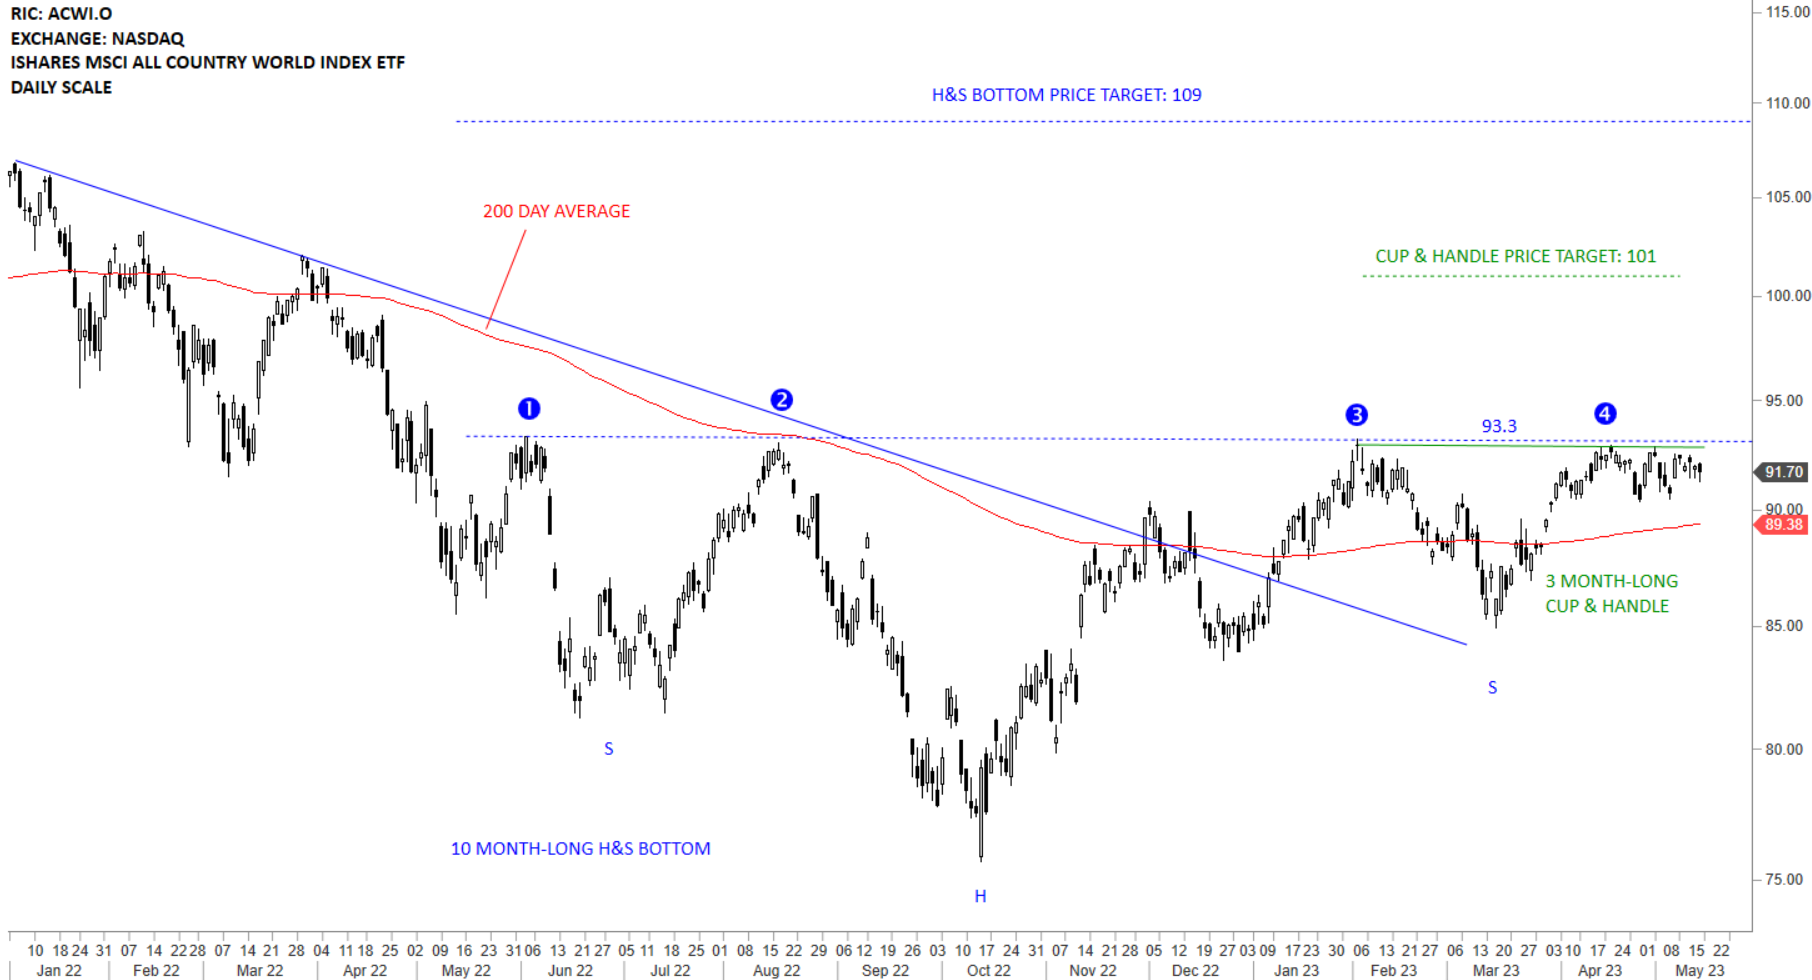
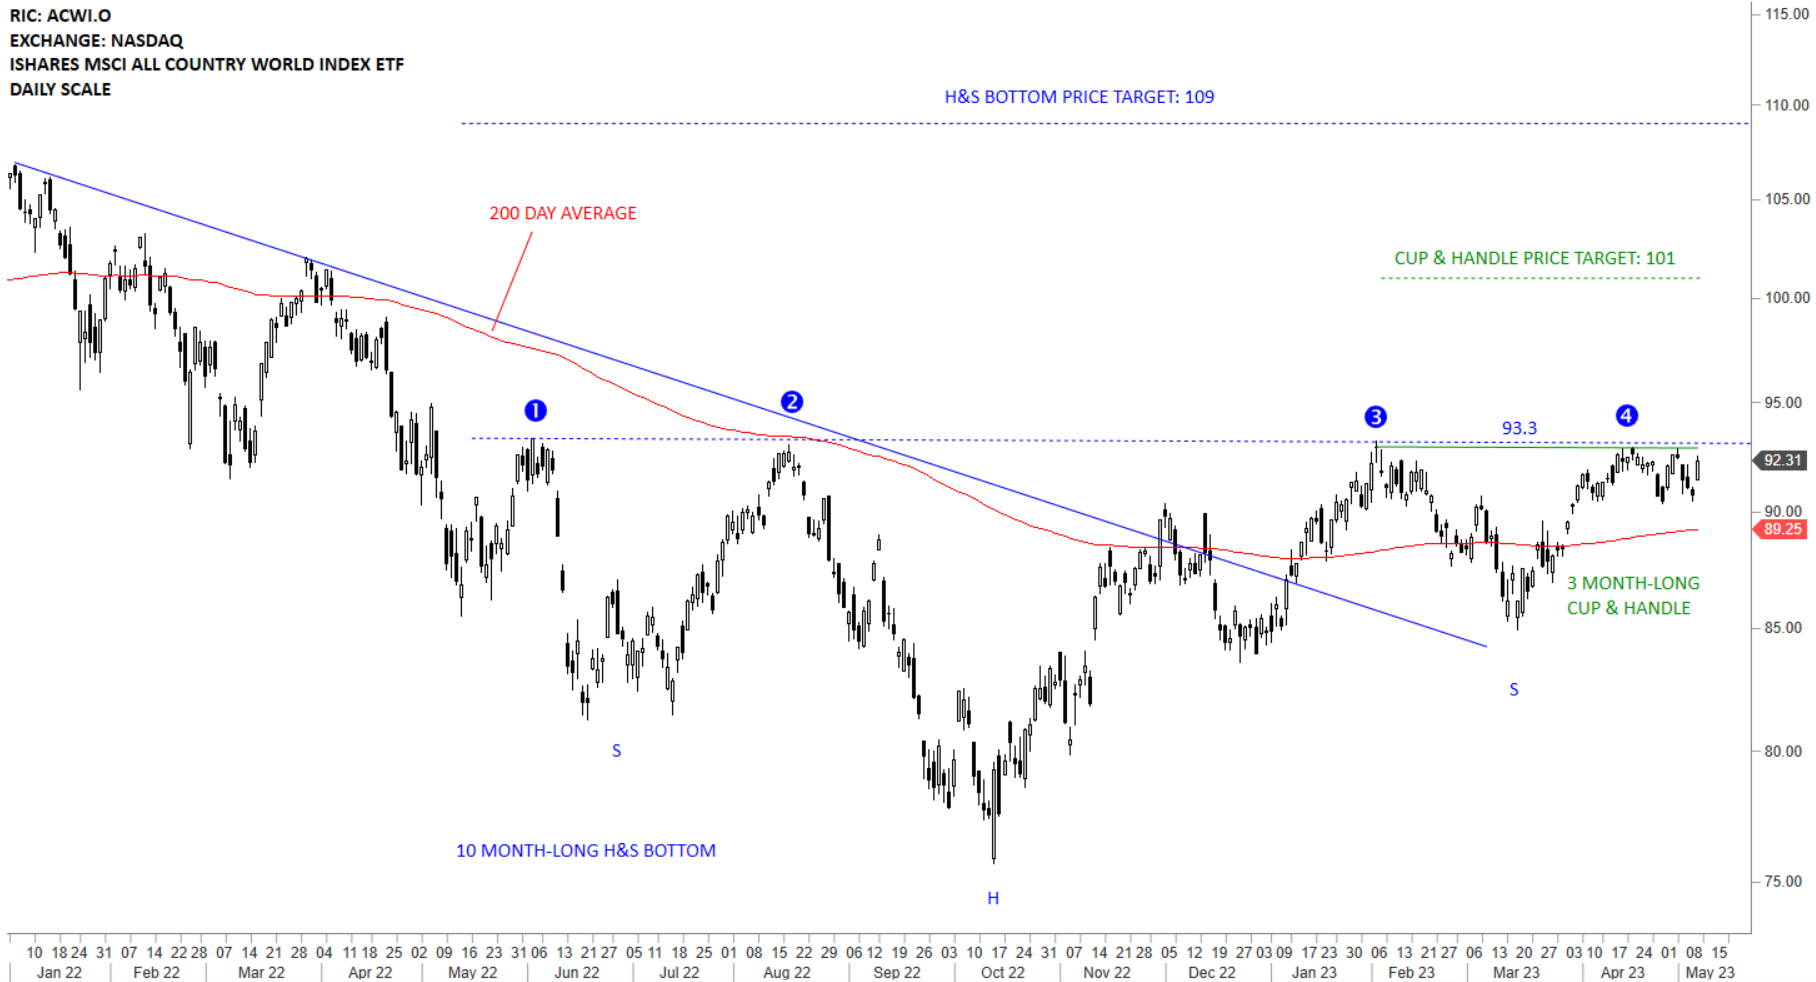
Tech Charts Year in Review. Aksel compares the before and after of charts shared with Members over the last year followed by a live Q&A.
Tech Charts Year in Review – Year Six
- A study on Chart Pattern Reliability with the available sample data over the past year.
- H&S continuation has been the most reliable chart pattern over the past year. Rectangle continued to be in the top 3 reliable chart patterns.
- Detailed statistics on different types of breakouts.
- The impact of different market cycles on chart pattern opportunities.
- Live Q&A
Live questions from Members
- Last year, you said 2022 was the most difficult period for breakout trading of the last six years. Many breakout traders implement “sit out” periods where they stop trading in adverse market environments. Others use Progressive Exposure to size up or size down based on how well breakouts are performing. Do you use either of these tactics? 46:42
- On type 3 breakouts, are you getting stopped out and then reentering? 48:19
- It seems like some of your setups are based on the profit target and where your stop or pattern negation level are placed, that your risk-reward ratio is less than 1. Can you clarify some of those charts and if you’re taking these trades or if you’re charting what you see on the chart? 49:02
- Do you use a trailing stop once price action has moved toward your price target favorably to avoid a loss on something that has moved so much in the favorable direction 50:04
- Where are you placing your stops on the chart patterns you use? Like Head and shoulders, rectangles, Cup and handles, triangles, etc? 50:50
- What are your thoughts on the current formation of the Gold futures chart? I see a confirmed double top on the daily, but the pattern is small. Would you think it’s too small of a pattern to trade? Thoughts on the position of gold’s price? 51:52
Educational videos mentioned in this webinar
- ATR Trailing Stop-Loss – H&S Top
- Stop-limit order and early entry
- Breakout with a pullback – Application of ATR trailing stop-loss
Recorded live 05.24.2023


