GLOBAL EQUITY MARKETS – January 27, 2024
REVIEW
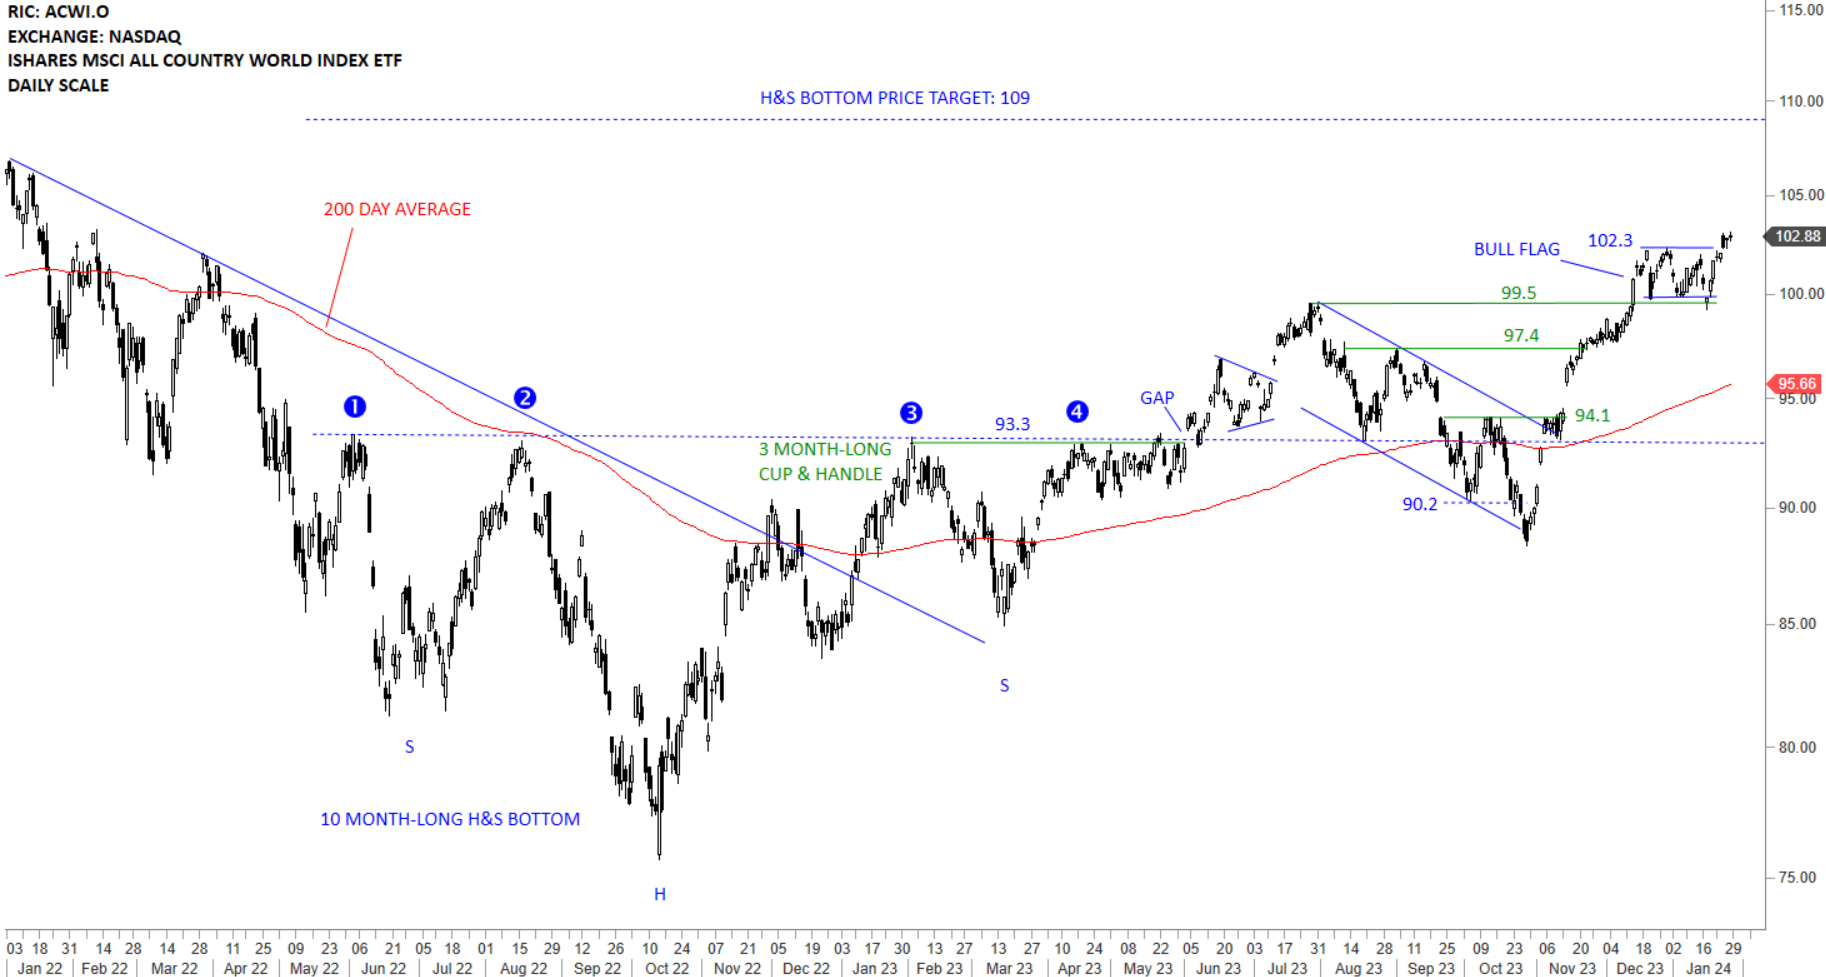
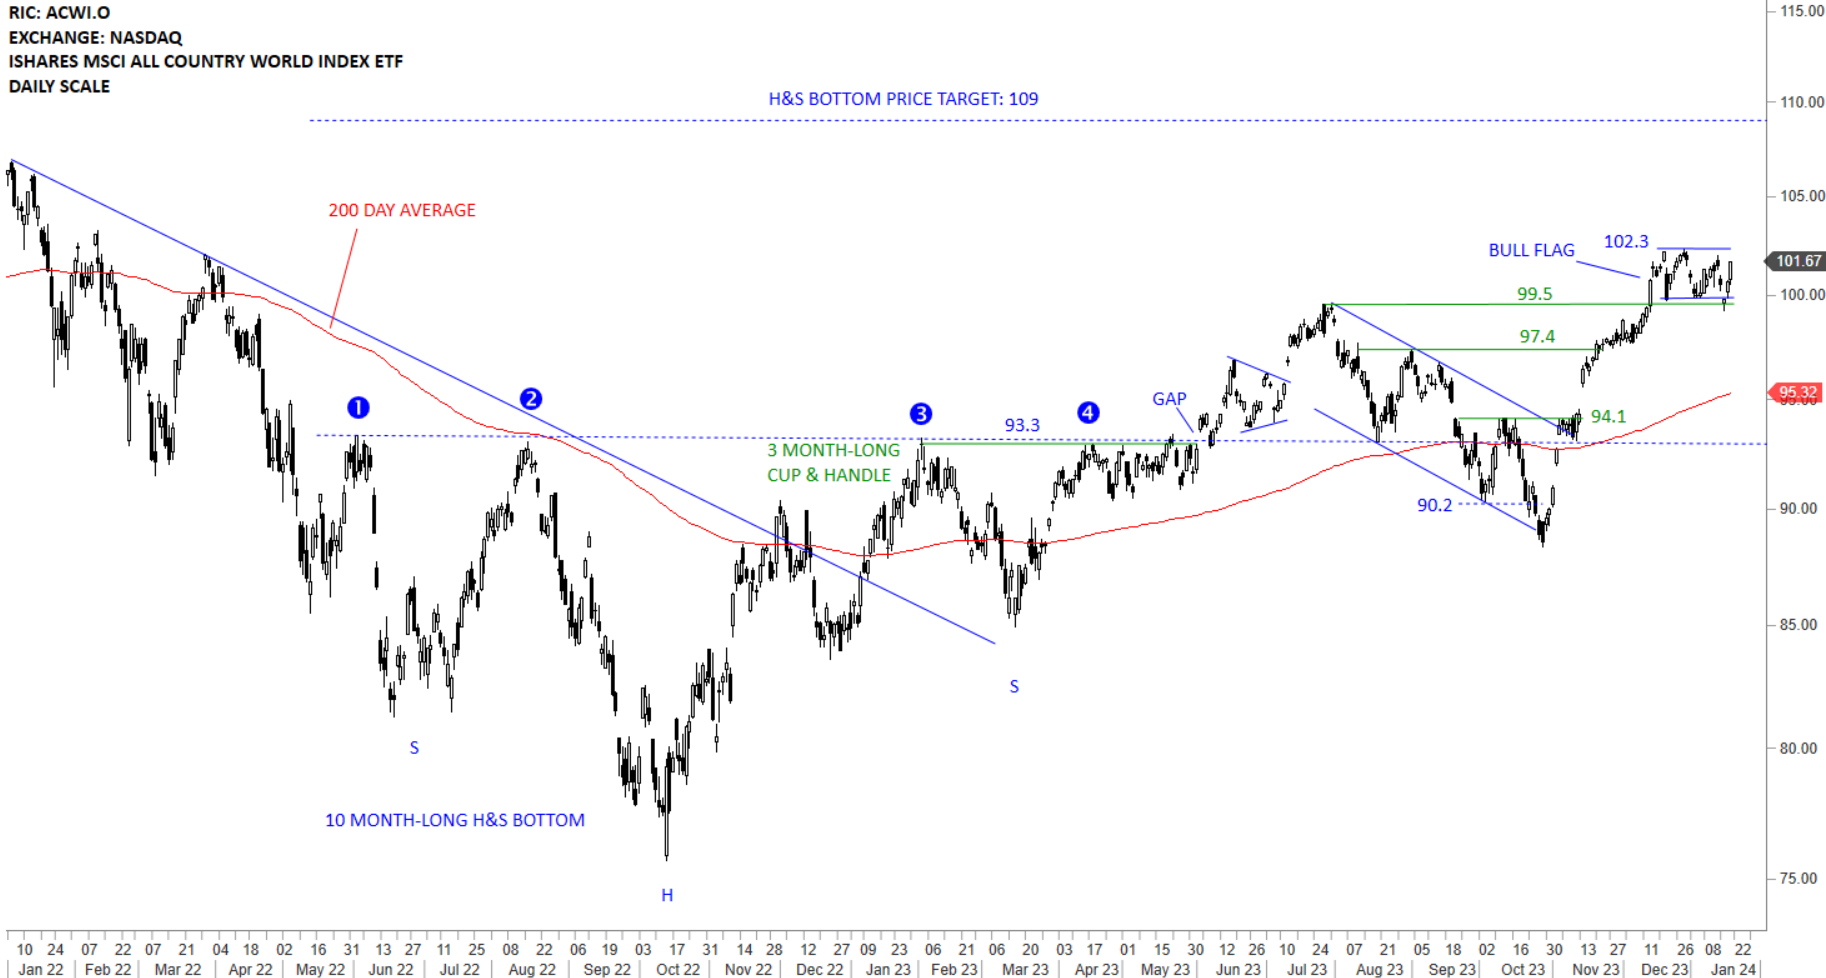
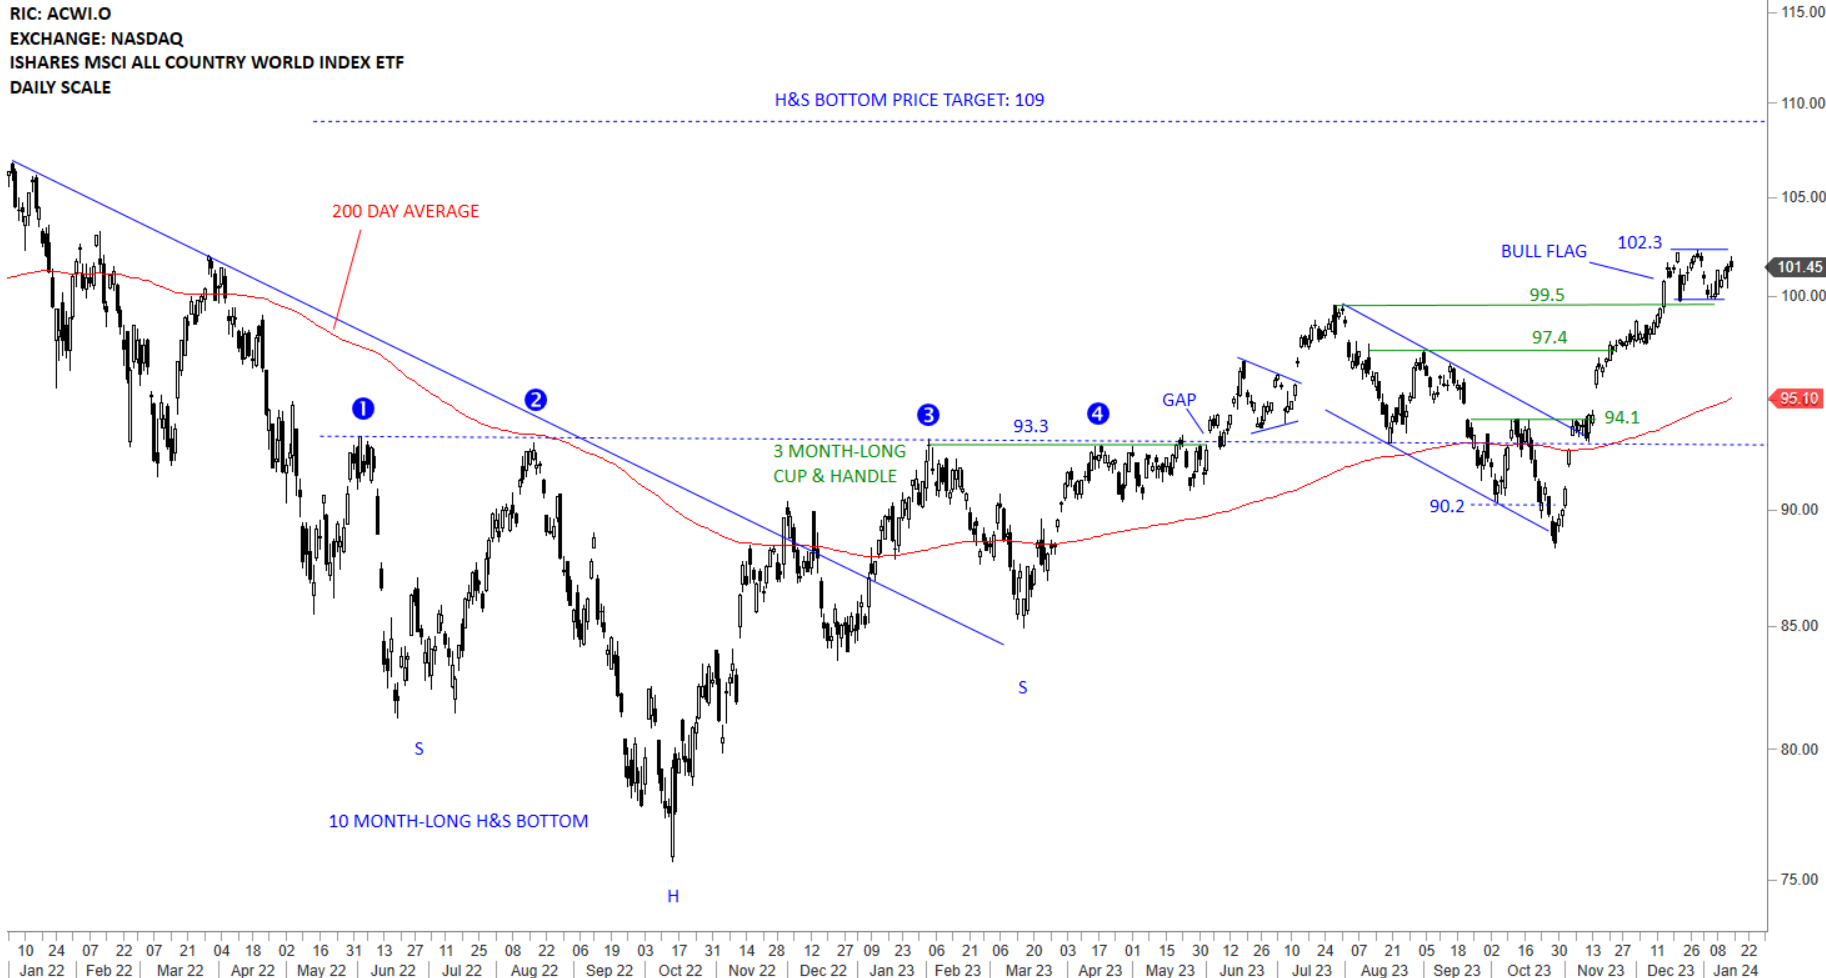
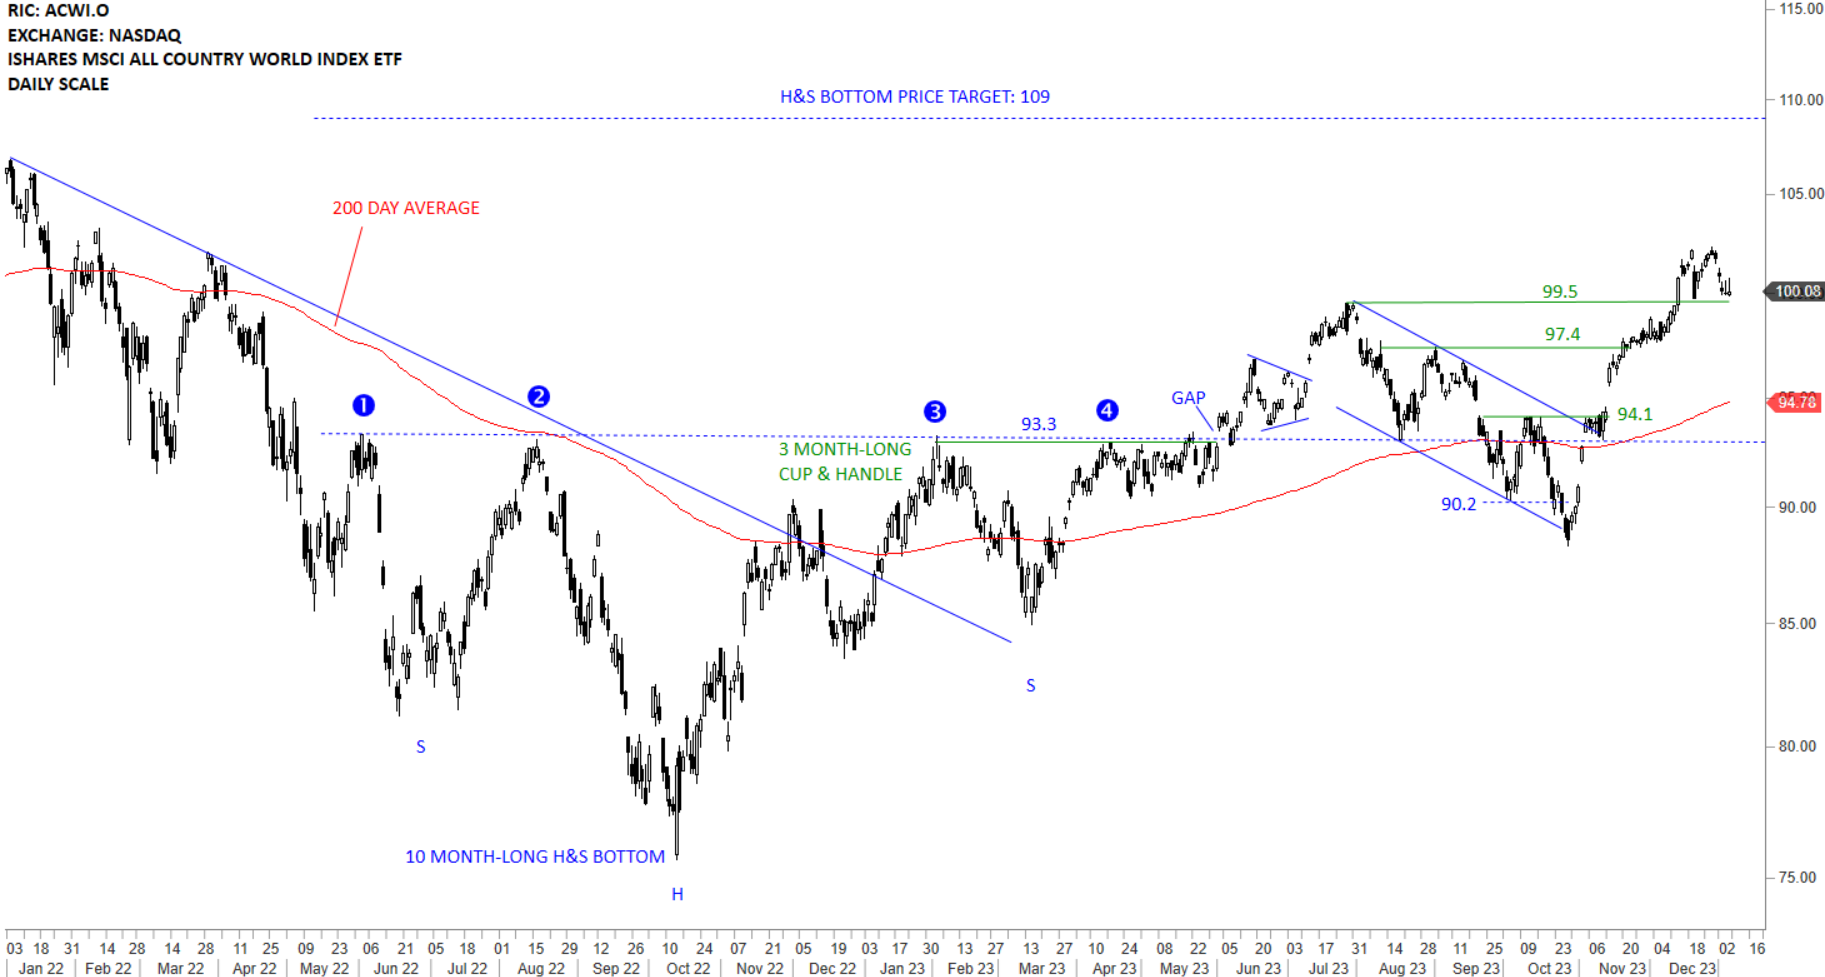
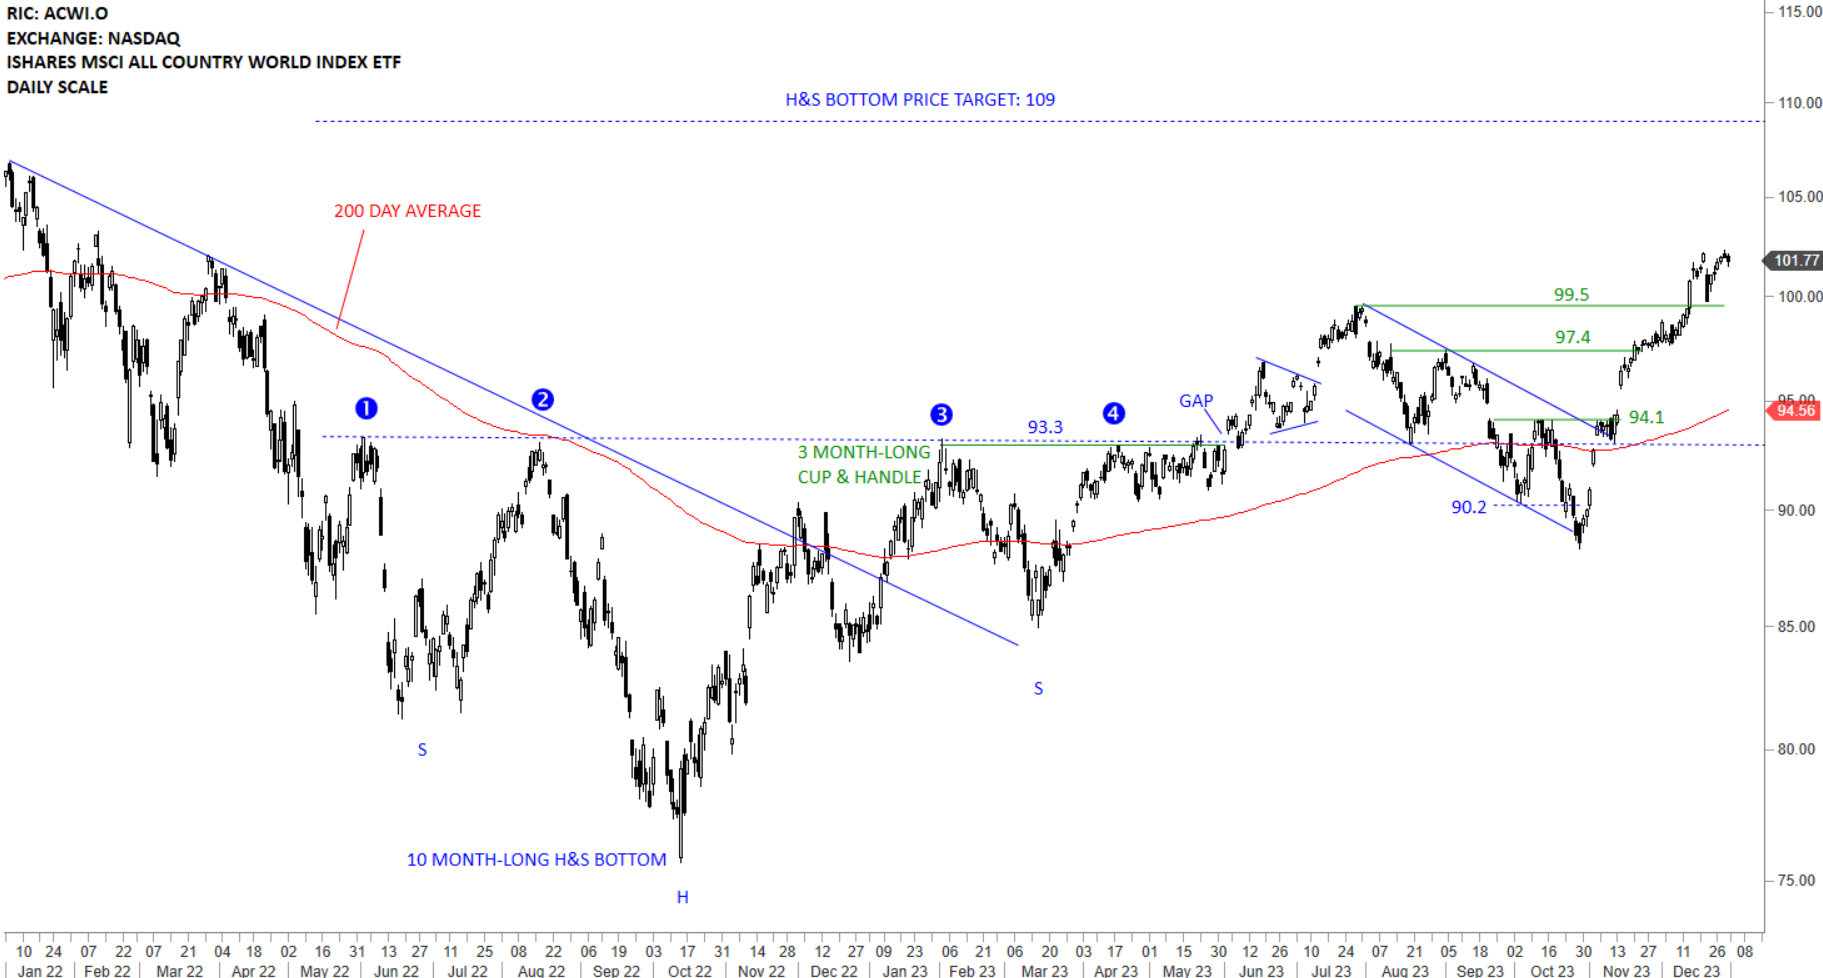
The benchmark for the Global equity markets performance, the iShares MSCI All Country World Index ETF (ACWI.O) cleared both minor resistances at 97.4 and 99.5 levels. The ETF is clearly above its 200-day average and in a steady uptrend. Long-term H&S bottom price target stands at 109 levels. Breakout above 99.5 levels is now followed completion of a possible bullish flag. Breakout above 102.3 levels can push the ETF higher towards 109 levels. Short-term support area is between 99.5 and 102.3.