BUND FUTURES 1ST MONTH CONT.
Every week Tech Charts Global Equity Markets report features some of the well-defined, mature classical chart patterns under a lengthy watchlist and the chart pattern breakout signals that took place during that week. Global Equity Markets report covers single stocks from developed, emerging and frontier markets, ETF’s, select commodities, cryptocurrencies and global equity indices. Below weekly and daily scale charts on European Bund Futures are from the review section of the weekly report. It is featuring a possible bearish chart pattern setup that can act as a continuation of the existing downtrend.
BUND FUTURES 1ST MONTH CONT.
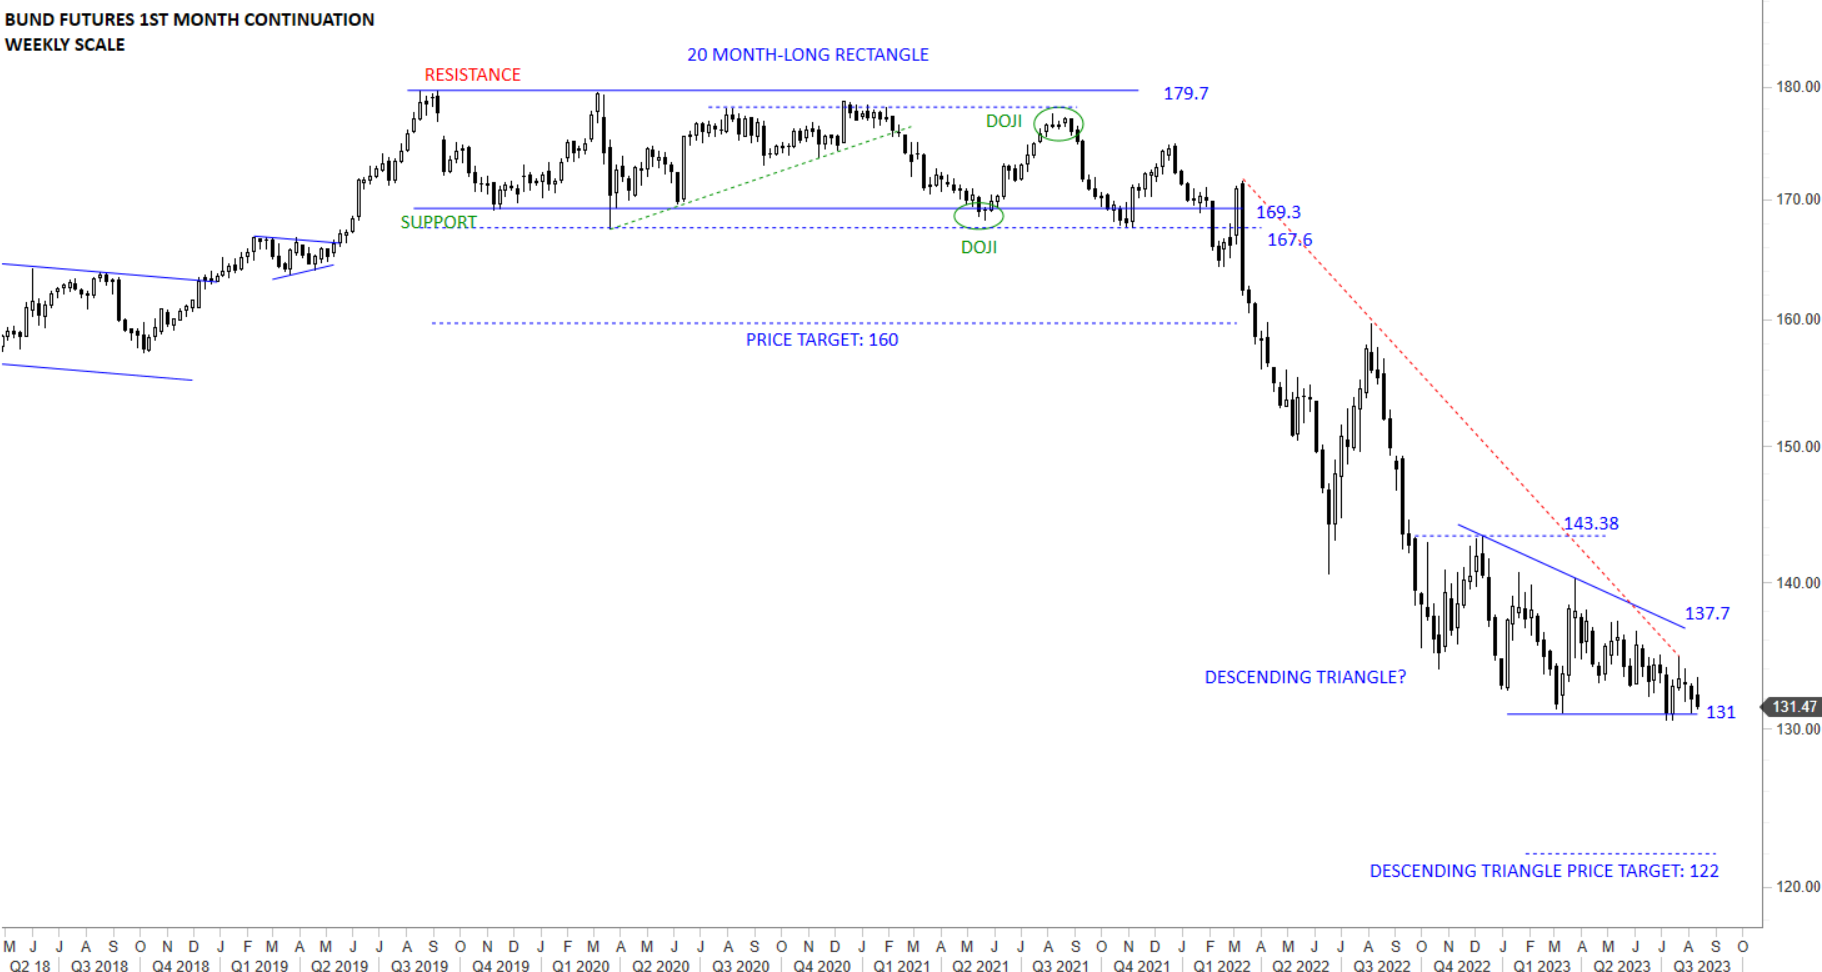
I closely monitored the BUND chart for a possible bottom reversal. Earlier I analyzed the pattern as a possible wedge. The chart pattern is possibly morphing into another configuration (a descending triangle that can resume the existing downtrend?). The long-term trend is down. Breakdown below the support at 131 levels can resume the downtrend. Incase of a breakdown below 131 levels, I will identify the pattern as a possible descending triangle with the price target of 122 levels. Lack of rebound from the horizontal support is showing possible weakness.
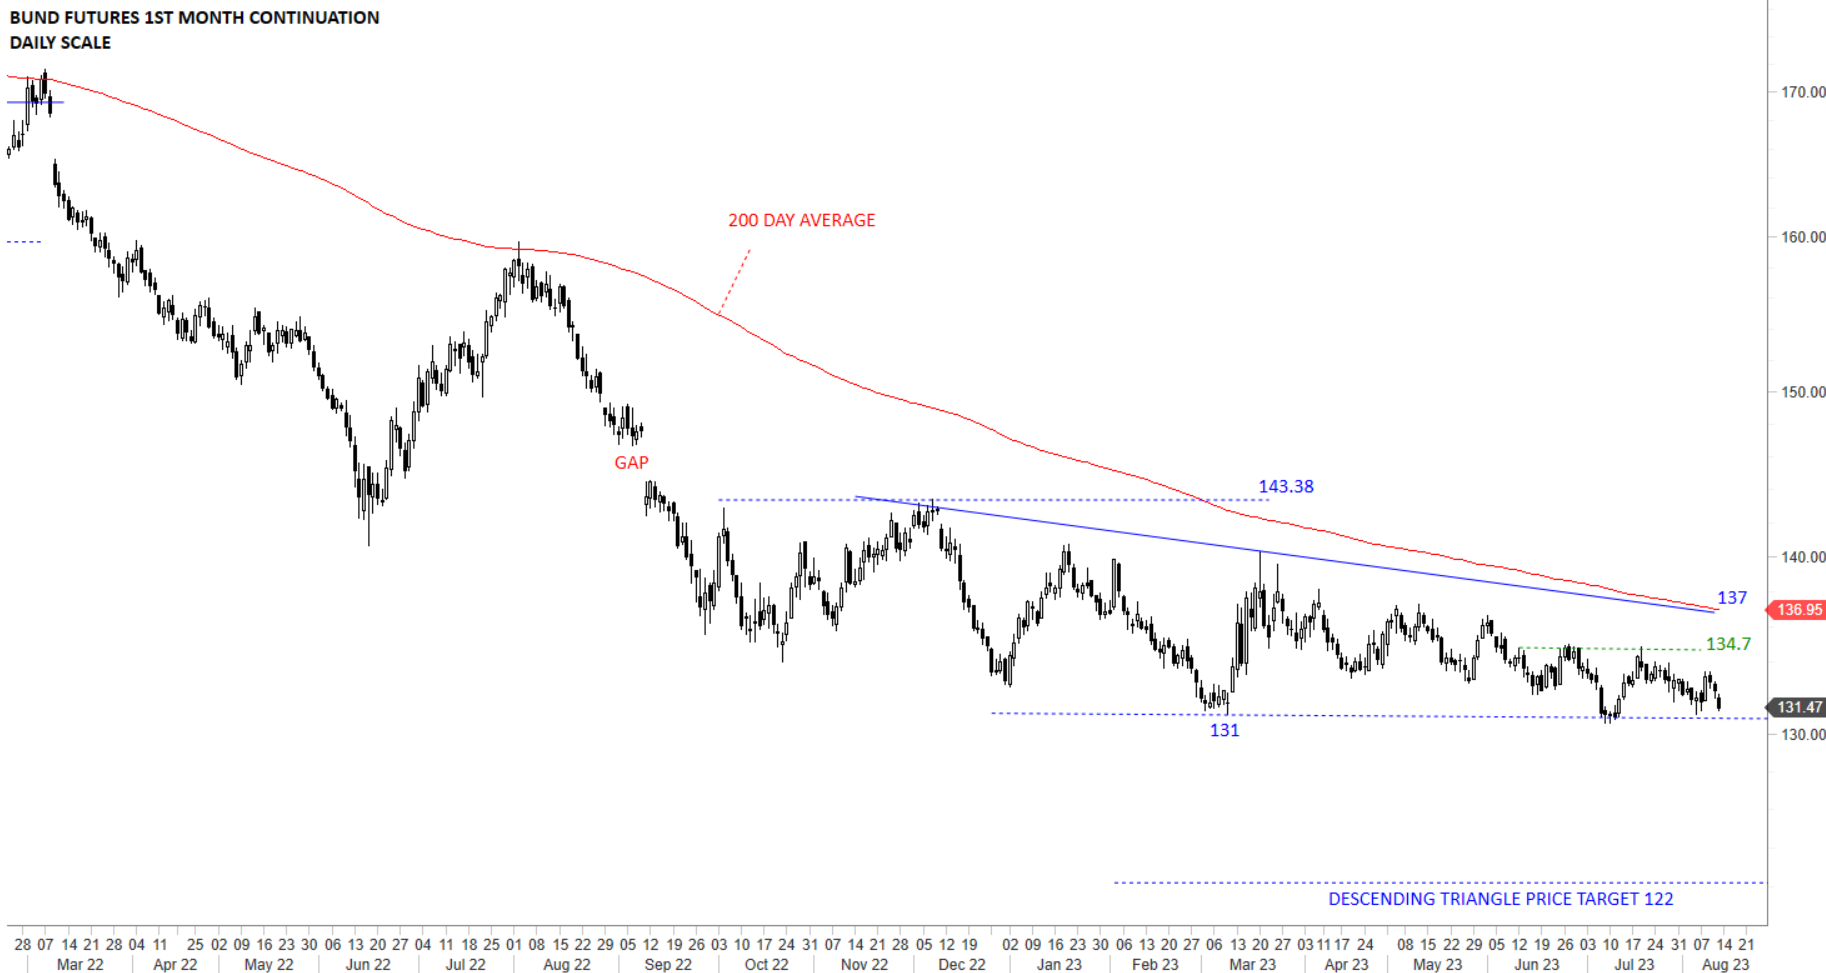
The chart below shows the daily price action and the possible descending triangle that is developing. Price continues to remain in a downtrend, below the 200-day average. A recovery above the 200-day average (136.95) will change the outlook to positive. Resistance area is between 137 and 143.38. Breakdown below 131 levels can come after its 4th tests of the horizontal support, increasing the conviction of the bearish signal.
Tech Charts Membership

By becoming a Premium Member, you’ll be able to improve your knowledge of the principles of classical charting.
With this knowledge, you can merge them with your investing system. In fact, some investors use my analyses to modify their existing style to invest more efficiently and successfully.

As a Premium Member of Aksel Kibar’s Tech Charts,
You will receive:
-
Global Equities Report. Delivered weekly.
-
Classical charting principles. Learn patterns and setups.
-
Actionable information. Worldwide indices and stocks of interest.
-
Risk management advice. The important trading points of each chart.
-
Information on breakout opportunities. Identify the ones you want to take action on.
-
Video tutorials. How patterns form and why they succeed or fail.
-
Watch list alerts. As they become available so you can act quickly.
-
Breakout alerts. Usually once a week.
-
Access to everything (now and as it becomes available)o Reports
o Videos and video series -
Multi-part webinar course. You learn the 8 most common charting principles.
-
Webinars. Actionable and timely advice on breaking out chart patterns.
For your convenience your membership auto renews each year.


