
INTERIM UPDATE – February 2, 2018
Germany's DAX Index experienced a sharp sell-off after reaching all-time highs. Last one week's price action pulled the index back to strong support level at 12,800 levels. Read More
Germany's DAX Index experienced a sharp sell-off after reaching all-time highs. Last one week's price action pulled the index back to strong support level at 12,800 levels. Read More

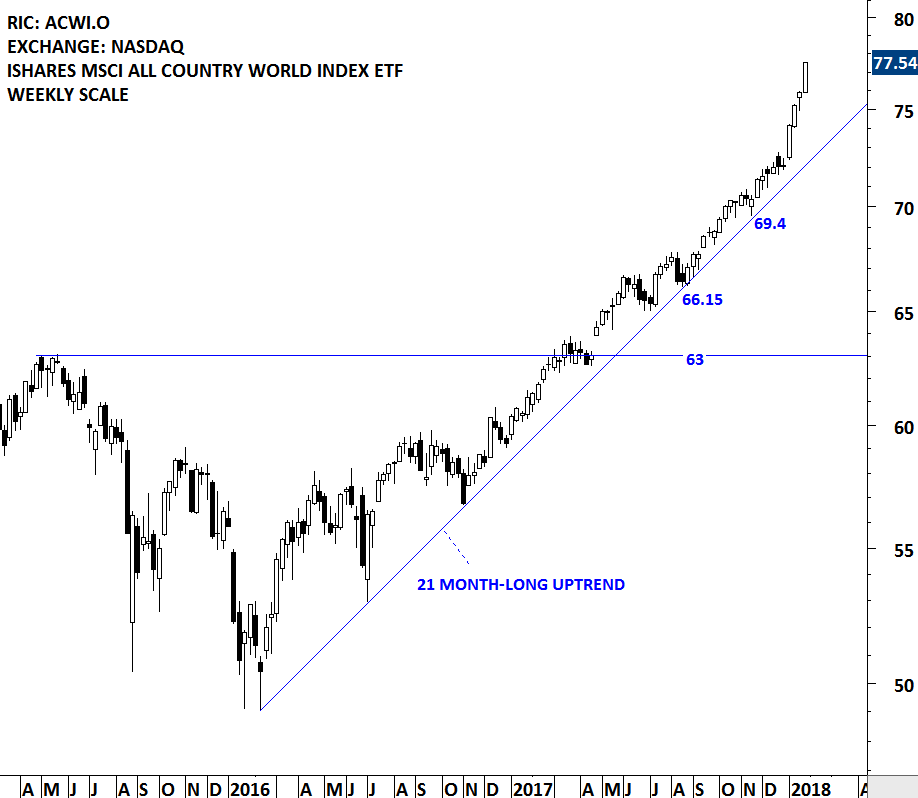
This was another strong week for the Global Equity Markets. The iShares MSCI All Country World Index ETF, a benchmark for global equity markets performance, continued to resume its strong uptrend above the 21 month-long upward trend. The uptrend has taken a parabolic shape. Parabolic price action is not sustainable. Short-term pullback and reversion to the mean is a possibility. At this point there is no clear chart pattern that would suggest a trend reversal.
 Read More
Strength in the Chinese equities started with a breakout on the China Large Caps. However, over the past year the performance for the broad market in China as shown by the China SSE Composite Index was not impressive when compared with China Large Cap ETF (FXI). In the second half of 2017, the SSE Composite index completed an 8 month-long rectangle. Following the breakout the index lacked follow through. SSE Composite Index spent the second half of 2017 by pulling back to the chart pattern boundary at 3,300 levels and to the long-term 200 day (40 week) moving average. Since the beginning of the year we have seen a strong performance on the SSE Composite Index with strong back to back weekly gains. Initial price target for the 8 month-long rectangle stands at 3,560 levels. More important than the short-term price target, current technical outlook might be signaling a new multi-month long uptrend developing for the Chinese equities.
Read More
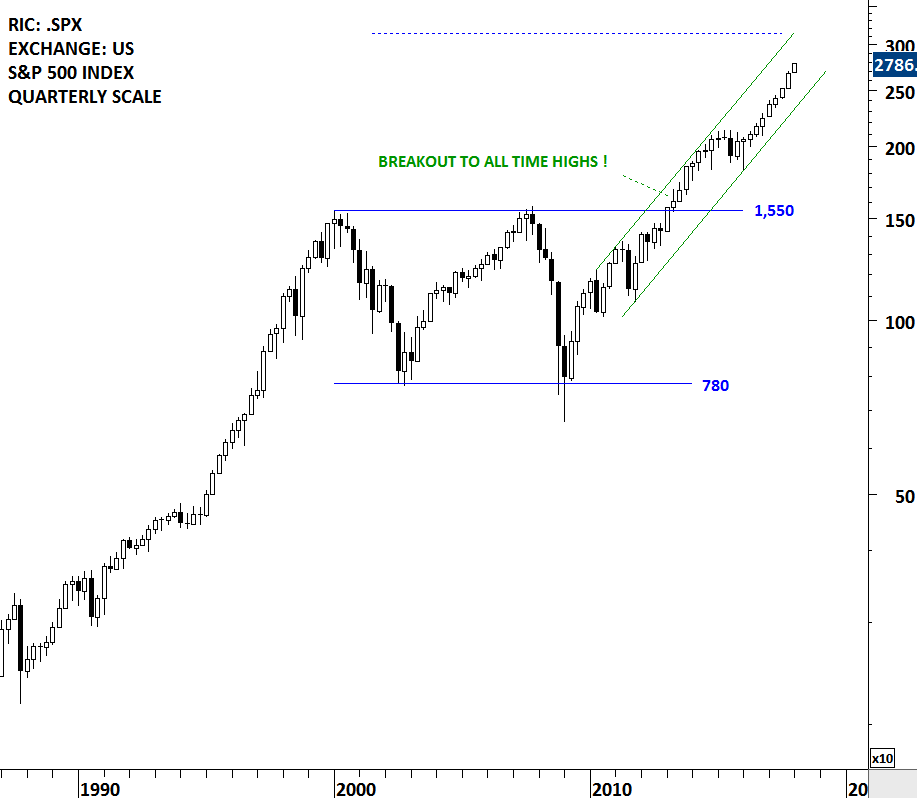
Reviewing long-term charts usually helps us to be focused on the big picture. Due to day to day volatility we might lose sight of the forest for the trees. Every now and then I feature these long-term charts to check the status of the bull market in global equities. U.S. equities have been a leader in the bull market. S&P 500 Index was one of the first widely followed U.S. equity benchmark that completed the decade-long consolidation and broke out to all-time highs in 2013. Since then the index has been in a steady uptrend reaching new high ground. Taking the width of the decade long-consolidation and adding it to the breakout level in percentage terms, gives us a price target in the range of 3,000-3,150.
 Read More
Several Basic Materials stocks are performing well with strong breakouts from lengthy consolidation ranges. January 6, 2018 Global Equity Markets report featured Metalurgica Gerdau SA that is listed in Brasil. The stock is dual listed via depository receipt on the New York Stock Exchange. This week's strong price action is completing the multi-month long bullish continuation chart patterns on both listings. This interim update added the NYSE listing.
Read More
Announcement: I will be speaking at the Dubai Traders Summit organized by MetaStock on April 26th. Over the past decade I worked for institutions in the region, managing funds & portfolios as well as analyzing Emerging and Frontier markets. At this one day event I hope to connect with Tech Charts members & followers, ex-colleagues and fellow traders to discuss some of the best classical chart patterns that helped me in making trading and investment decisions. Registration is free. You can follow this link to register >> DUBAI TRADERS SUMMIT APRIL 26th.
Global Equity Markets started the new year on a high note. Back to back gains pushed the iShares MSCI All Country World Index towards the upper boundary of its upward trend channel. Strong uptrend remains intact. If the year-long upward trend channel is valid, the upper boundary can act as a short-term resistance. There is no chart pattern that would suggest a trend reversal at this point.
Read More
Over the past few months Tech Charts Global Equity Markets report analyzed the Europe's EURO STOXX BANKING INDEX and discussed the possibility of a sideways consolidation that can be identified as a 7 month-long symmetrical triangle. The index remained in a tight range for the past months. 2017 ended with the Euro Stoxx Banking index testing the lower boundary of its multi-month consolidation and the 200-day (40 week) moving average at 129 levels.
Read More

Dear Tech Charts members,
2017 has been a special year for me. I made several decisions; the most important ones were moving to a new country with my family and launching the Tech Charts membership service. Like with our decisions with trading opportunities, life decisions require the leap of faith. Good or bad, we need to step to the line and take the next opportunity in our life. Without God's blessing and Tech Charts members support this wouldn't have come to fruition. I've taken this challenge and enjoyed every part of it and I look forward continuing to add value to your decision making and learning experience in the field of classical charting principles and technical analysis.
In the beginning of every year I wish health for family members, friends and their loved ones. Tech Charts community has become a family. I wish all of you a healthy New Year.
Kind regards,
![]()
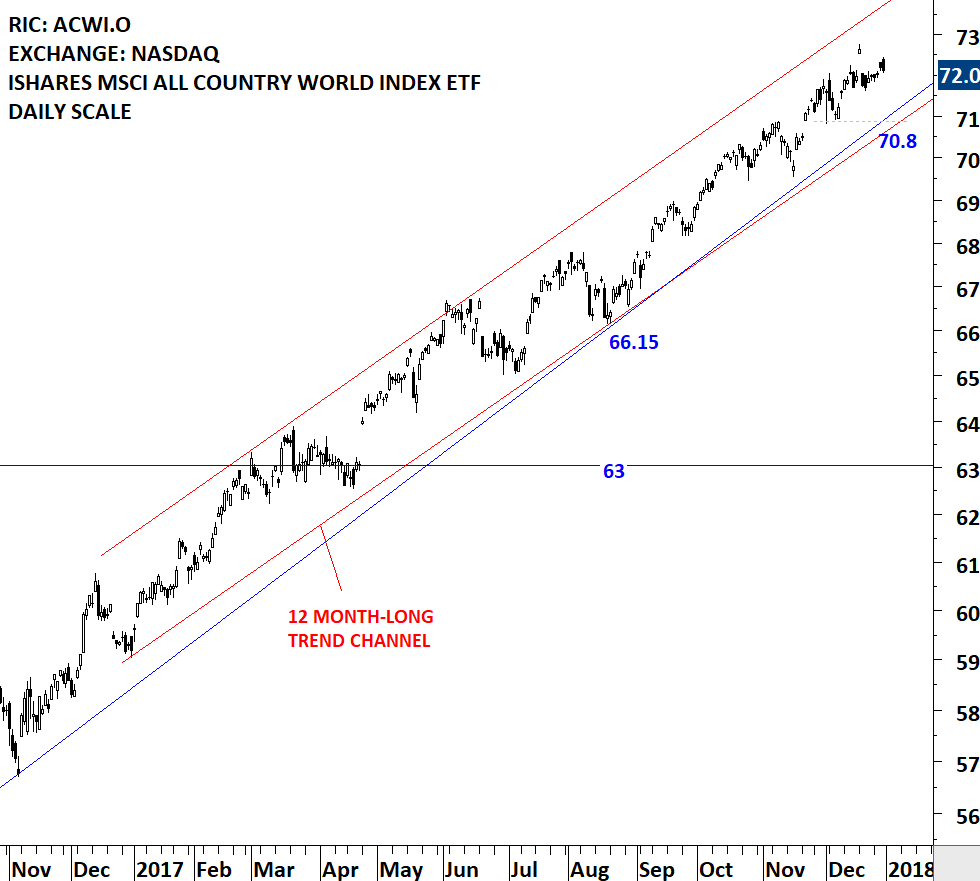
2017 was a strong year for Global Equity Markets. In the second quarter of 2017, iShares MSCI All Country World Index ETF broke out to all-time highs. The daily price chart formed a year-long upward trend channel and the steady uptrend resumed between the boundaries of the steep trend channel. Over the past month the ACWI ETF formed a minor low which now acts as a short-term support at 70.80 levels. Both the 20 month-long uptrend and the year-long trend channel are still intact.
 Read More
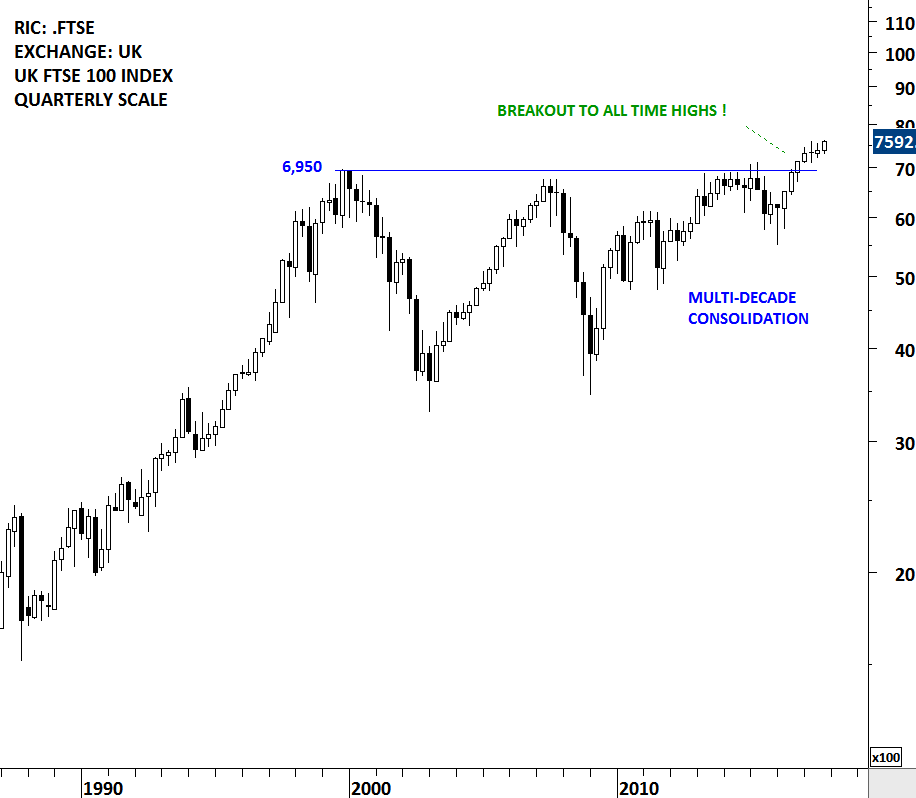
Over the past few weeks I reviewed the UK FTSE 100 index. I believe it is one of the most important long-term opportunity for global equity investors. There are couple of technical developments that I really like about the UK FTSE 100 index chart. First one is that the index cleared its multi-decade long horizontal resistance and reached all-time highs. Stocks or indices that clear long-term resistances and reach all-time highs enter "uncharted territory". Uncharted territory is the path of least resistance. In other words there is no previous price level that the index would find resistance.
 Read More
