GLOBAL EQUITY MARKETS – February 6, 2021
REVIEW
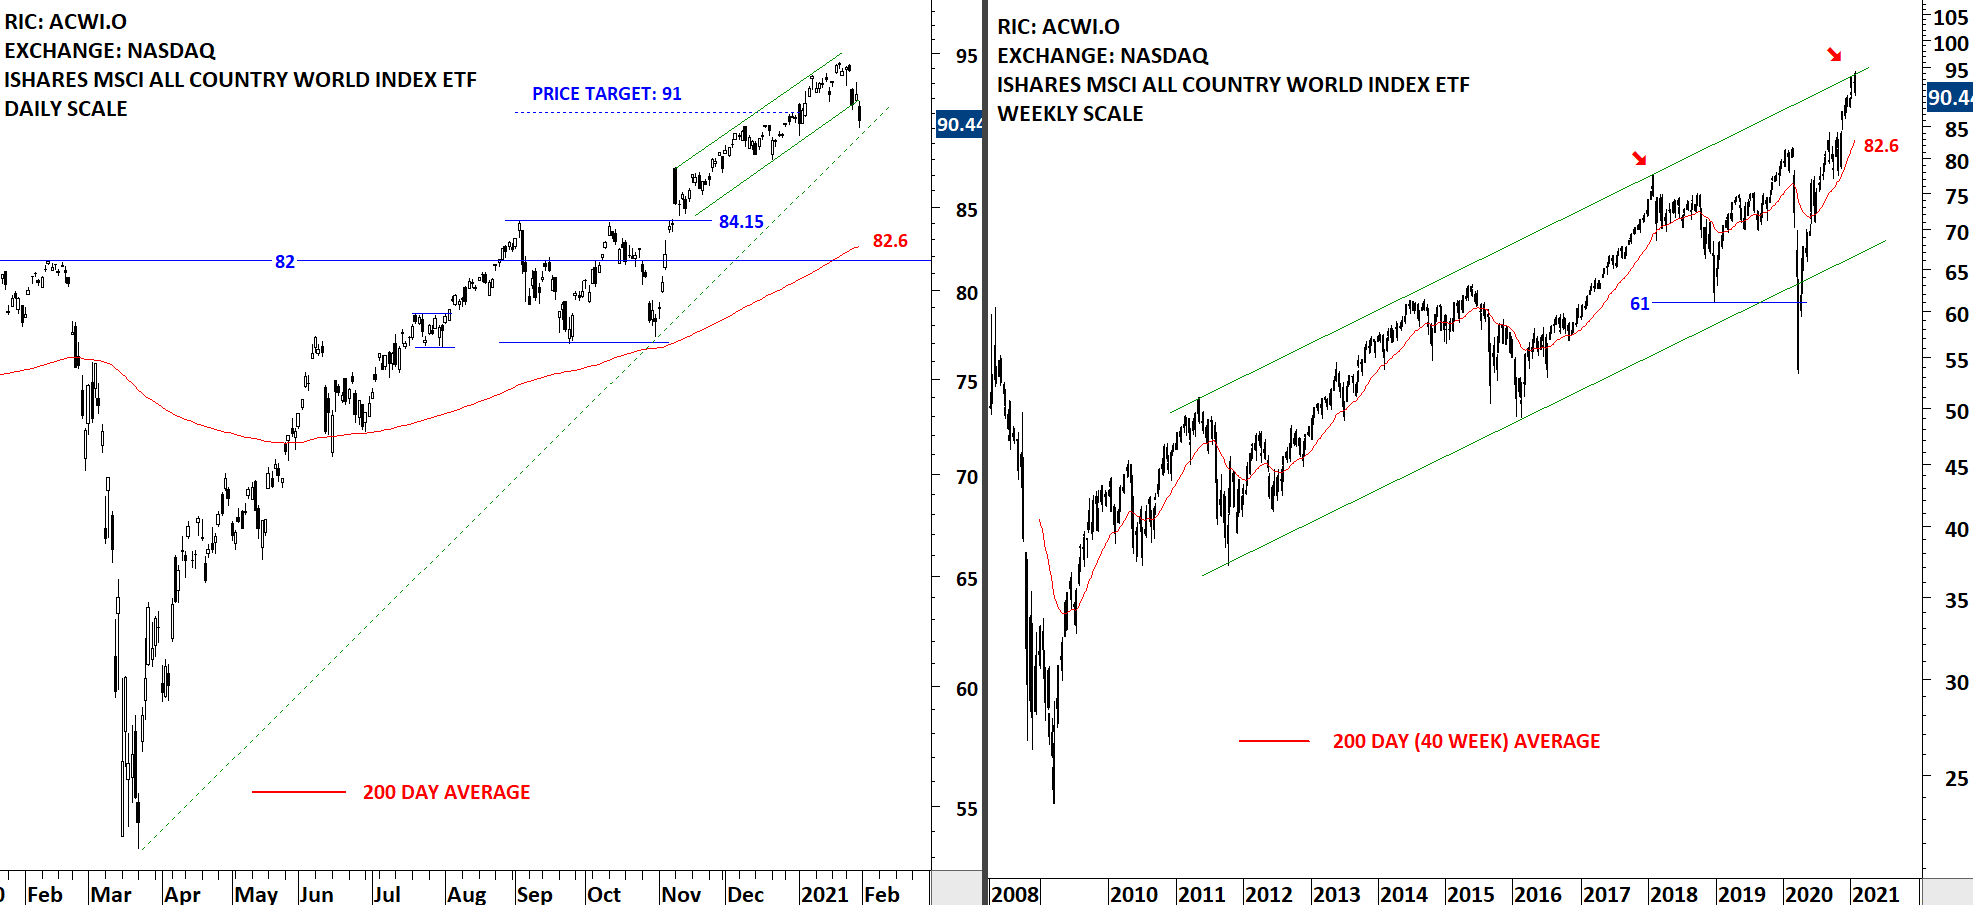
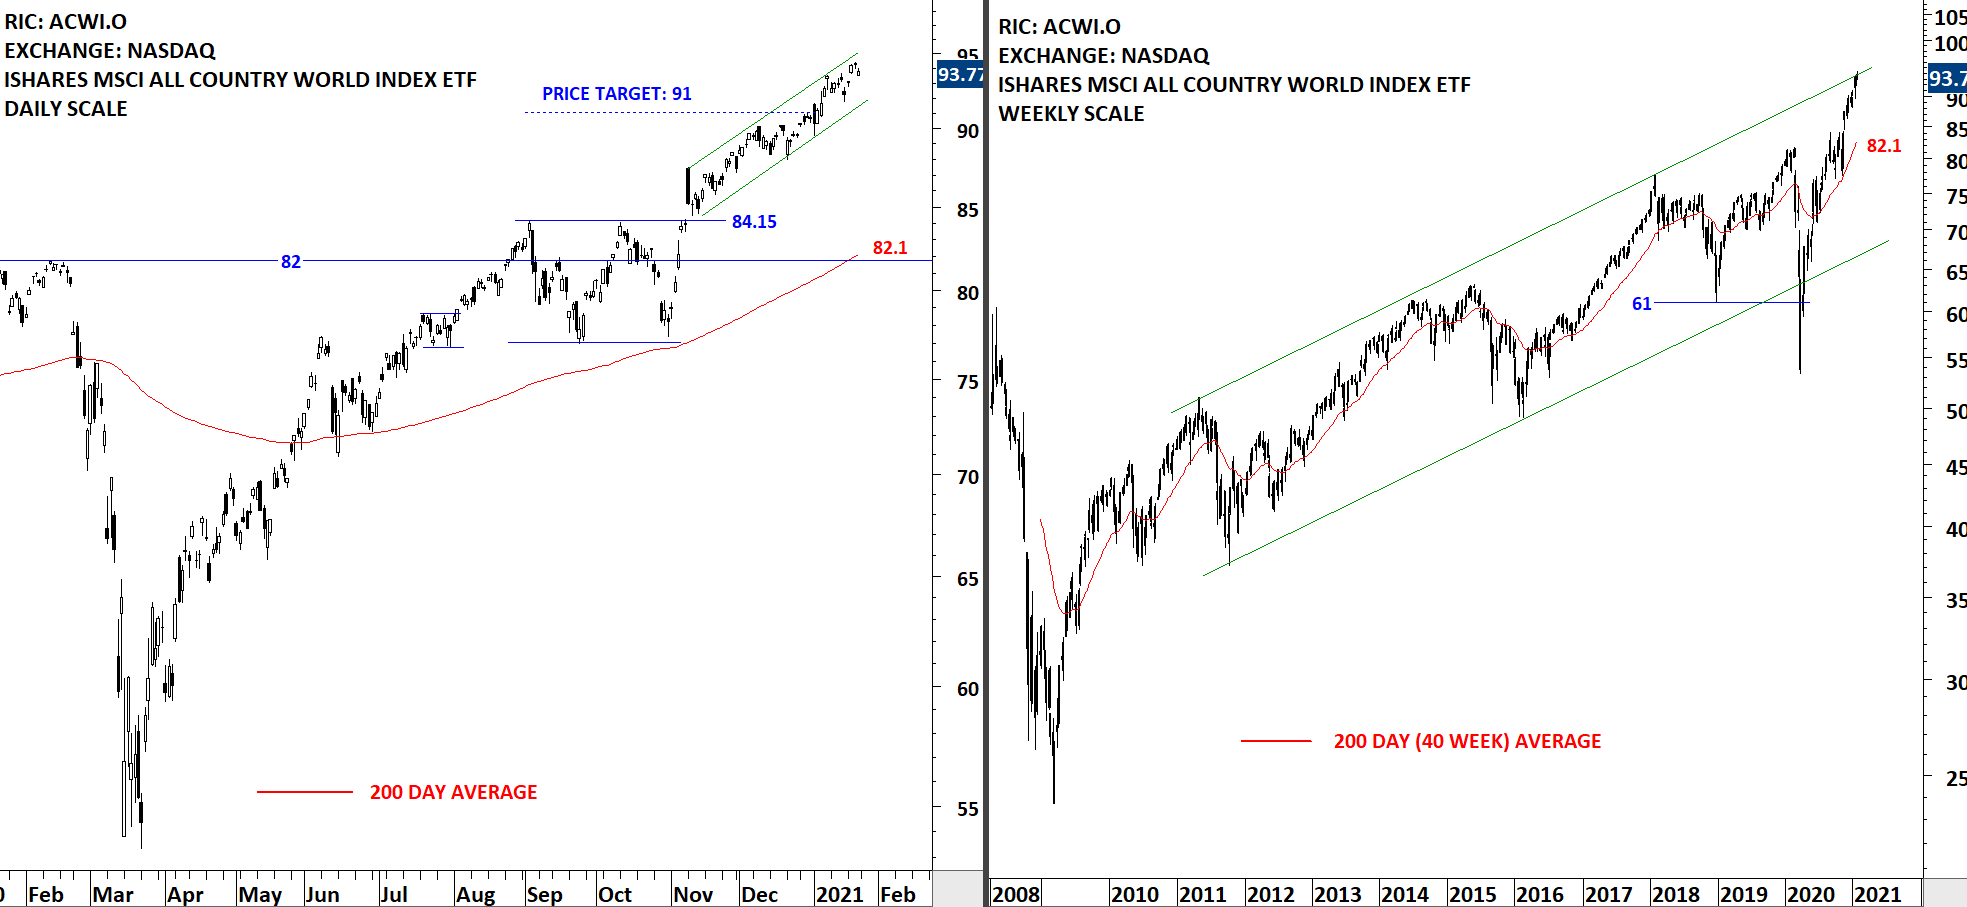
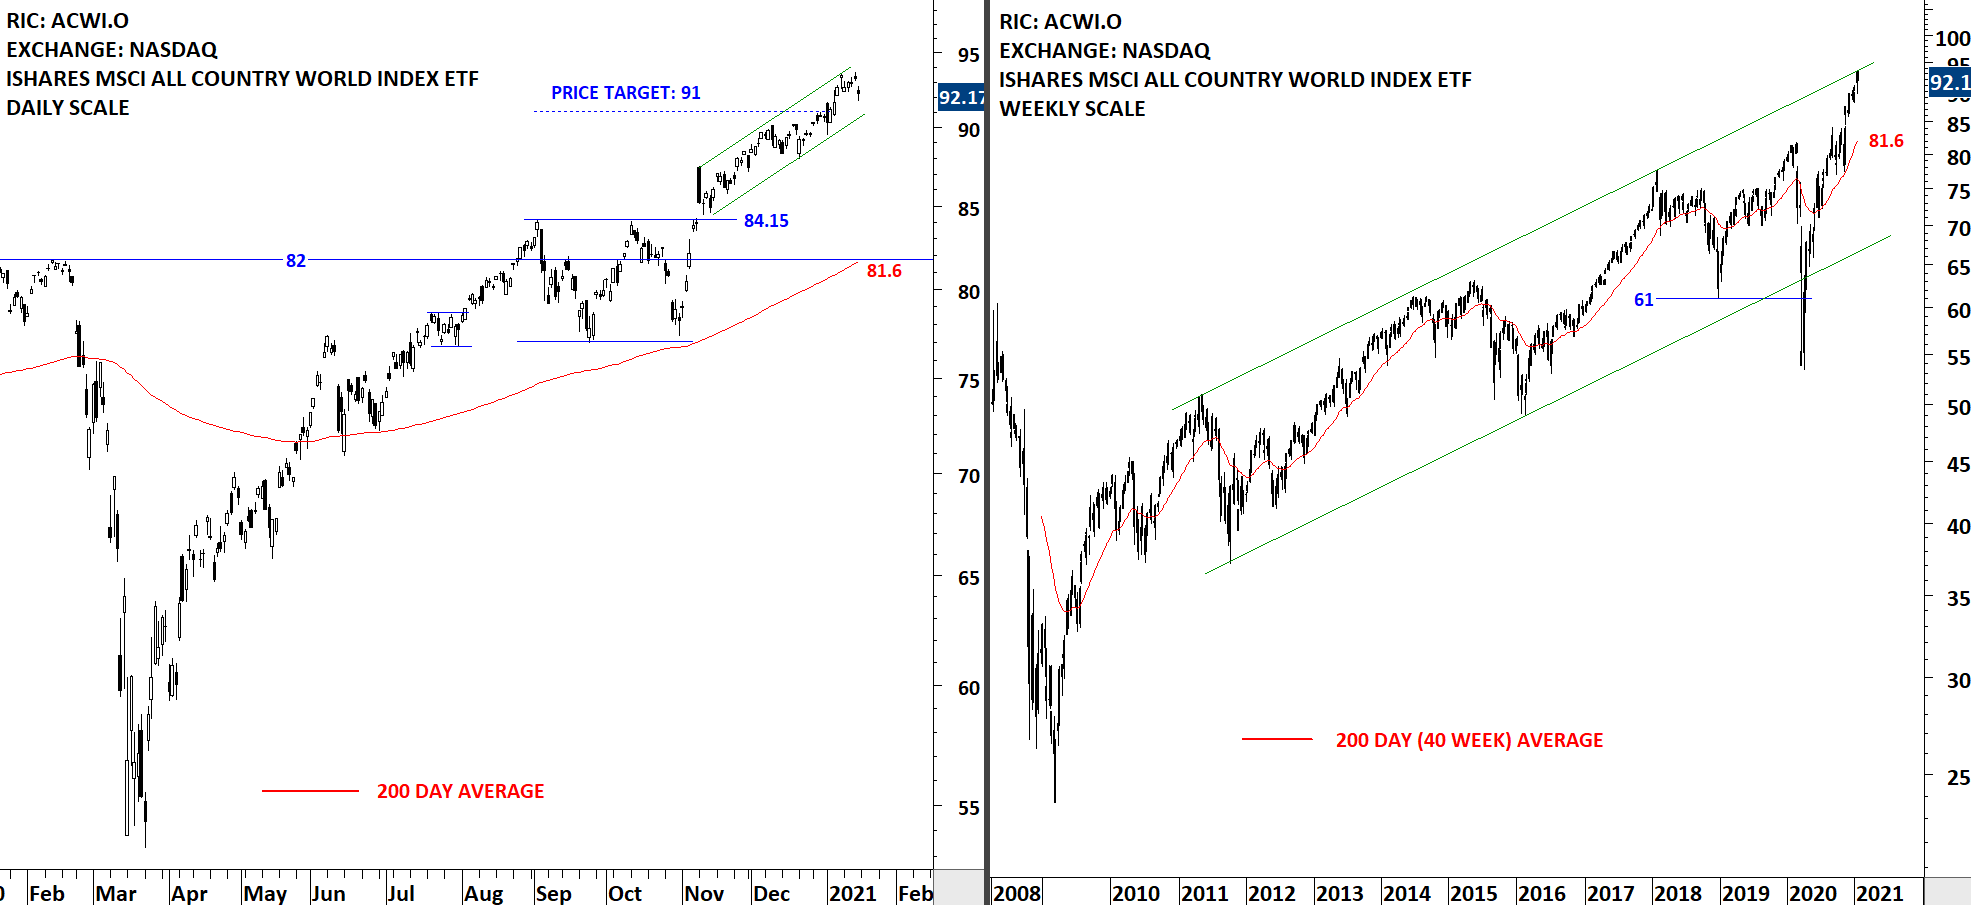
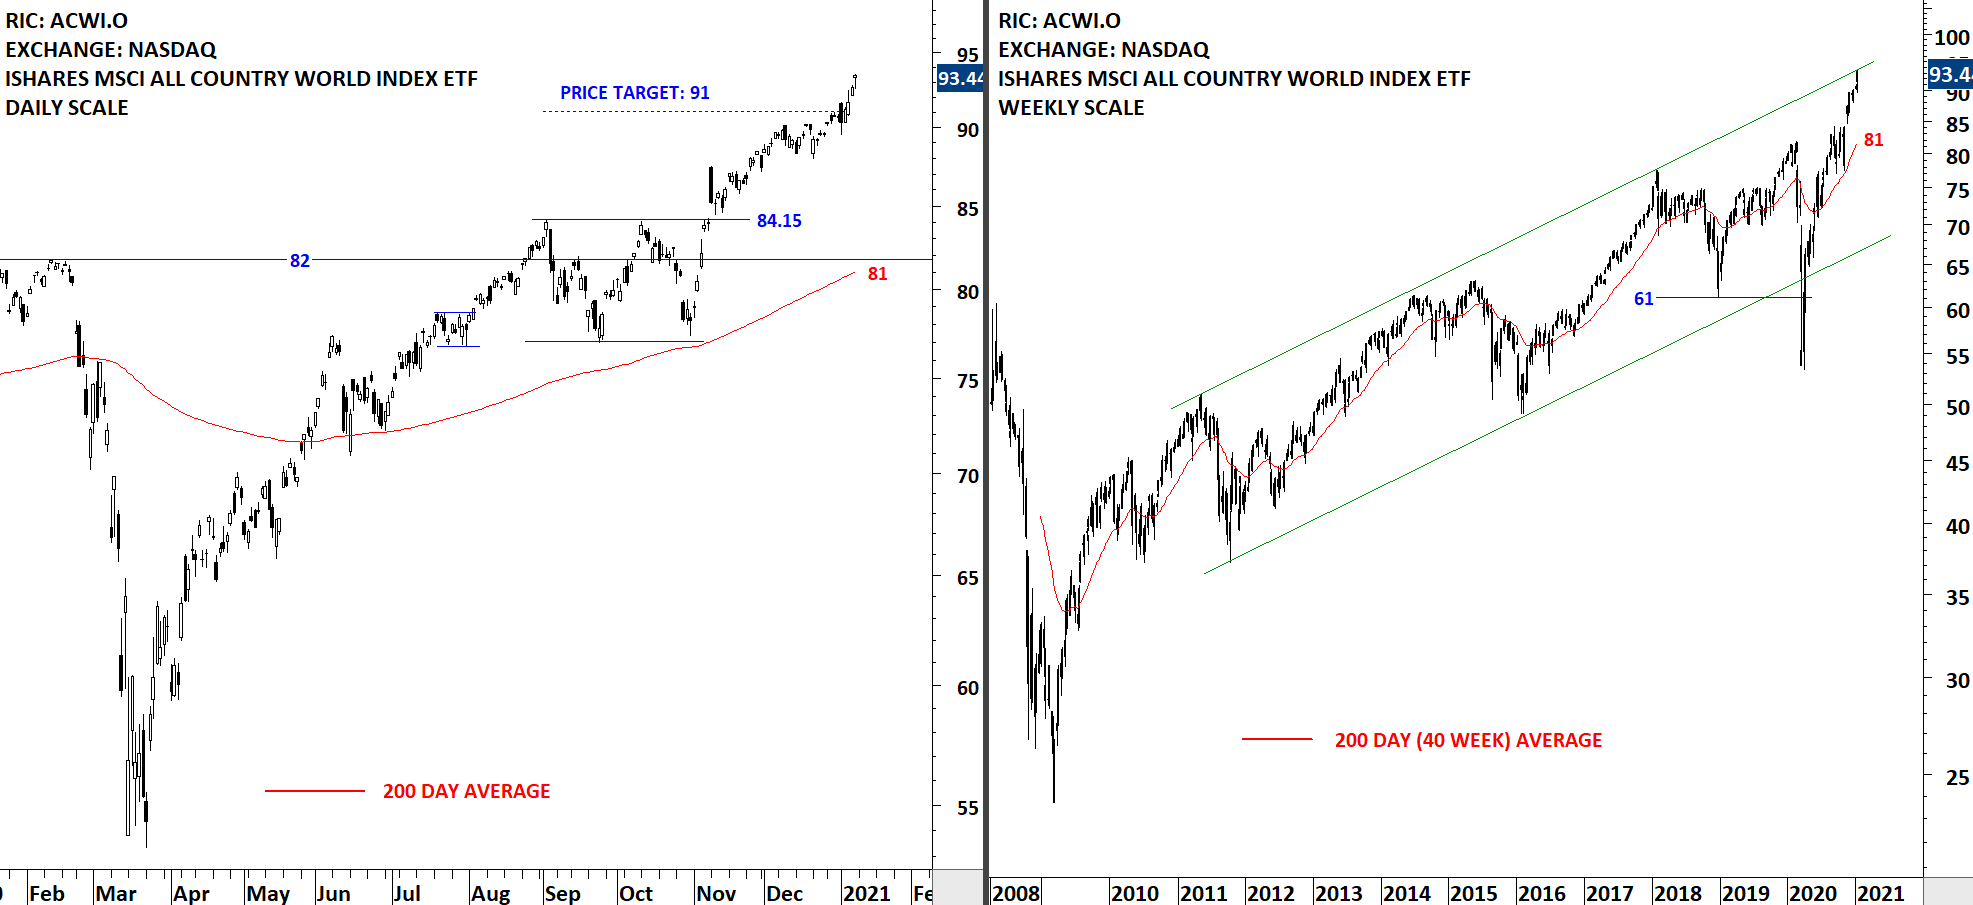
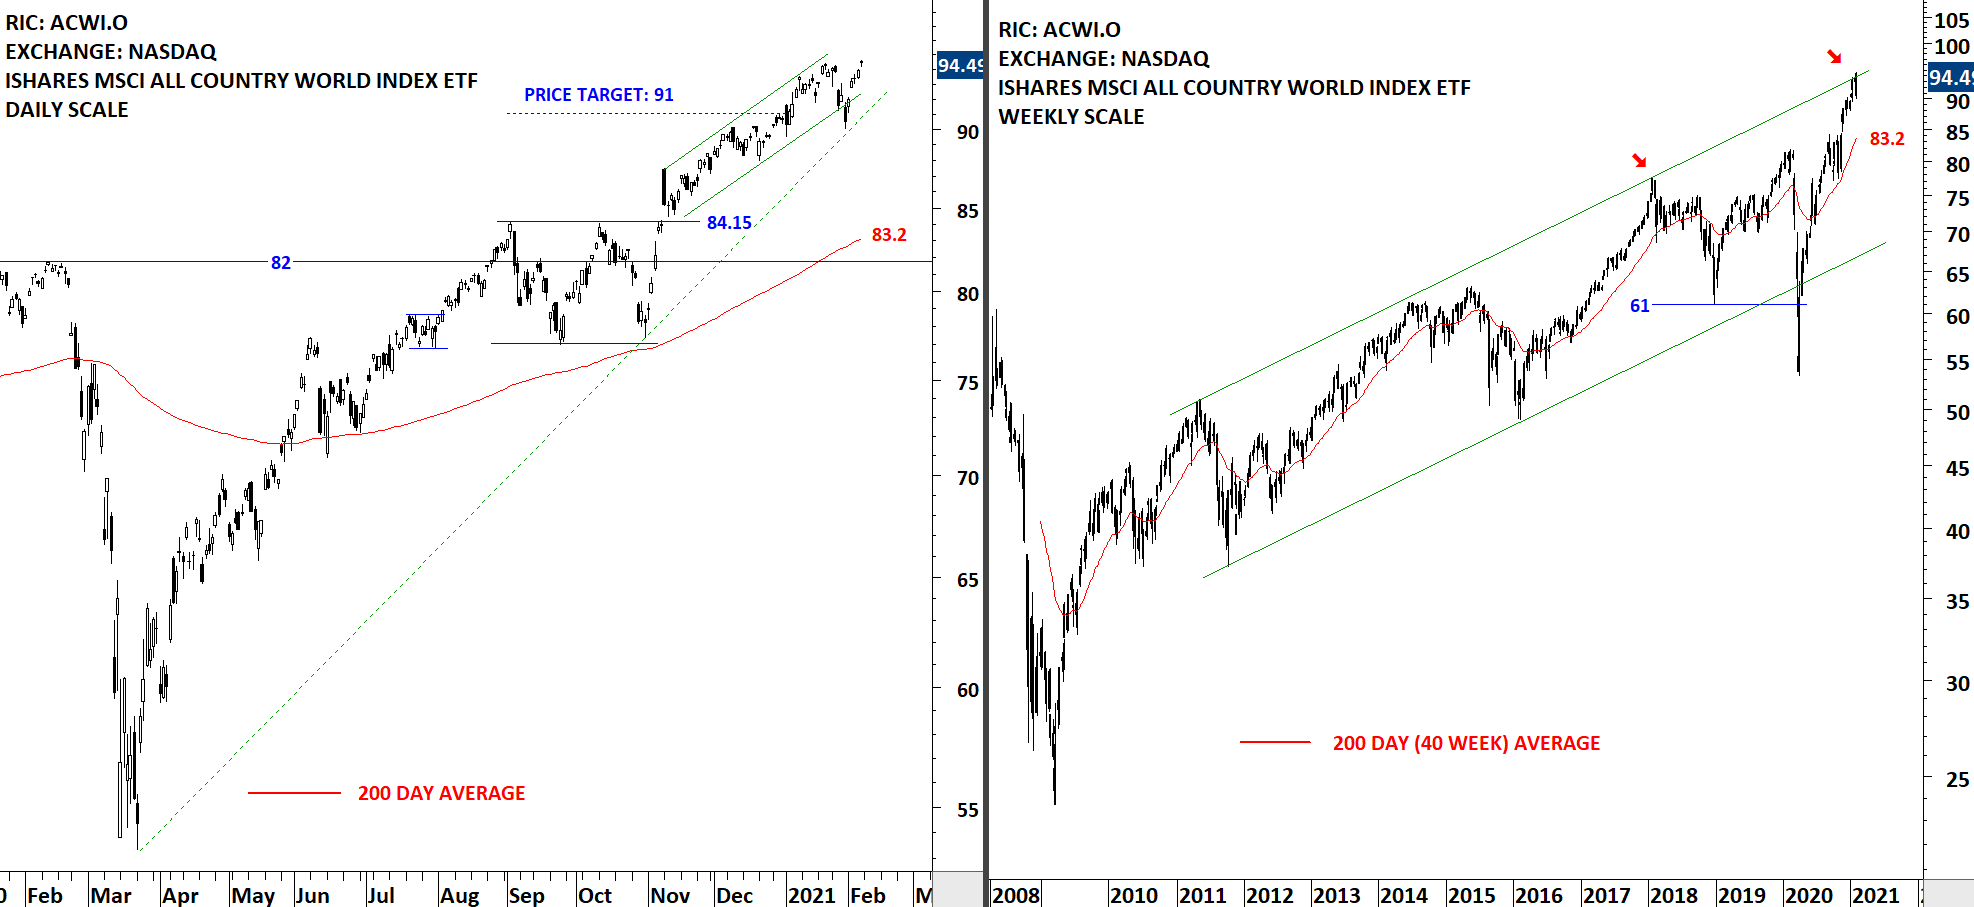
The benchmark for the Global equity markets performance, the iShares MSCI All Country World Index ETF (ACWI.O) had a short-term bear trap after breaching the lower boundary of the past 2 months uptrend at 92 levels. The ETF quickly recovered inside the trend channel and tested the minor high at 94.5 levels. The uptrend remains intact. It is important to note that price is at the upper boundary of the long-term trend channel, a possible resistance area. The 200-day moving average and the upper boundary of the previous short-term consolidation are forming support between 83.2 and 84.15 levels. Following week I will monitor how the ETF performs at the minor high. If it finds resistance at 94.5, it can retrace back to the minor low at 90 levels.
 Read More