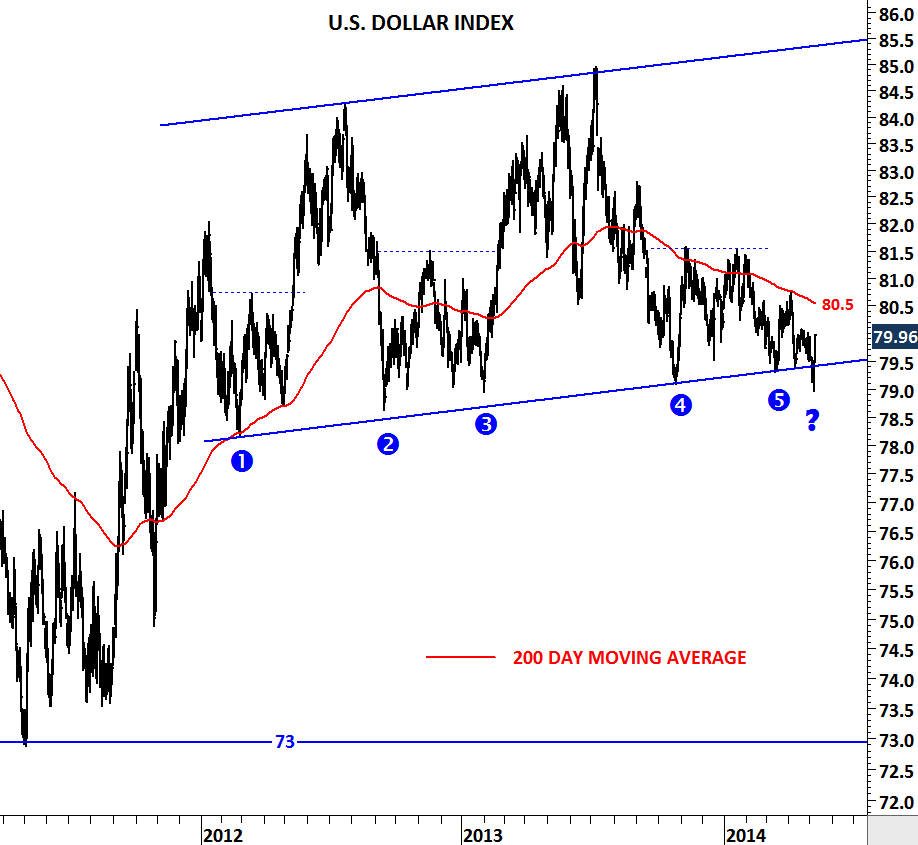
U.S. DOLLAR INDEX

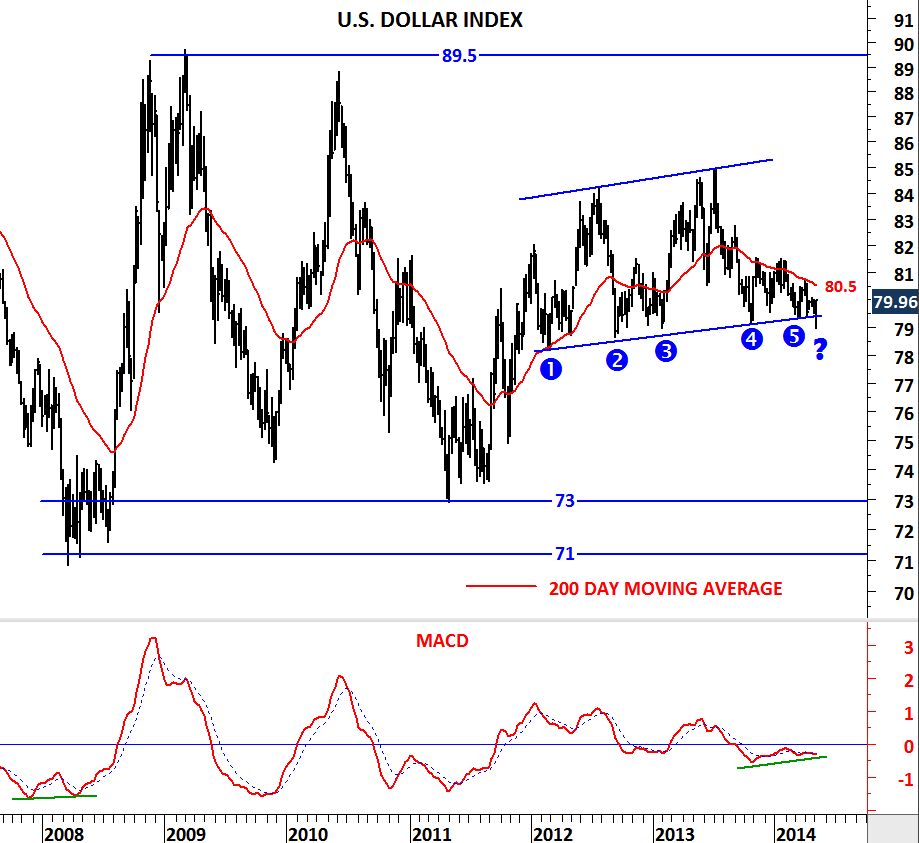
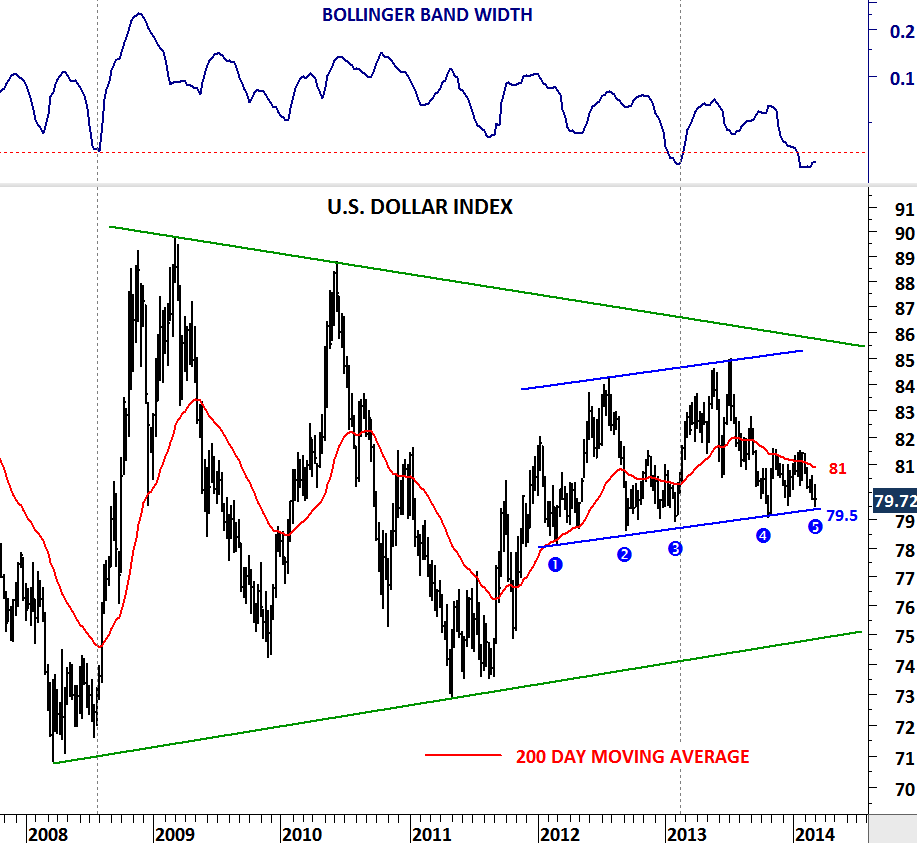
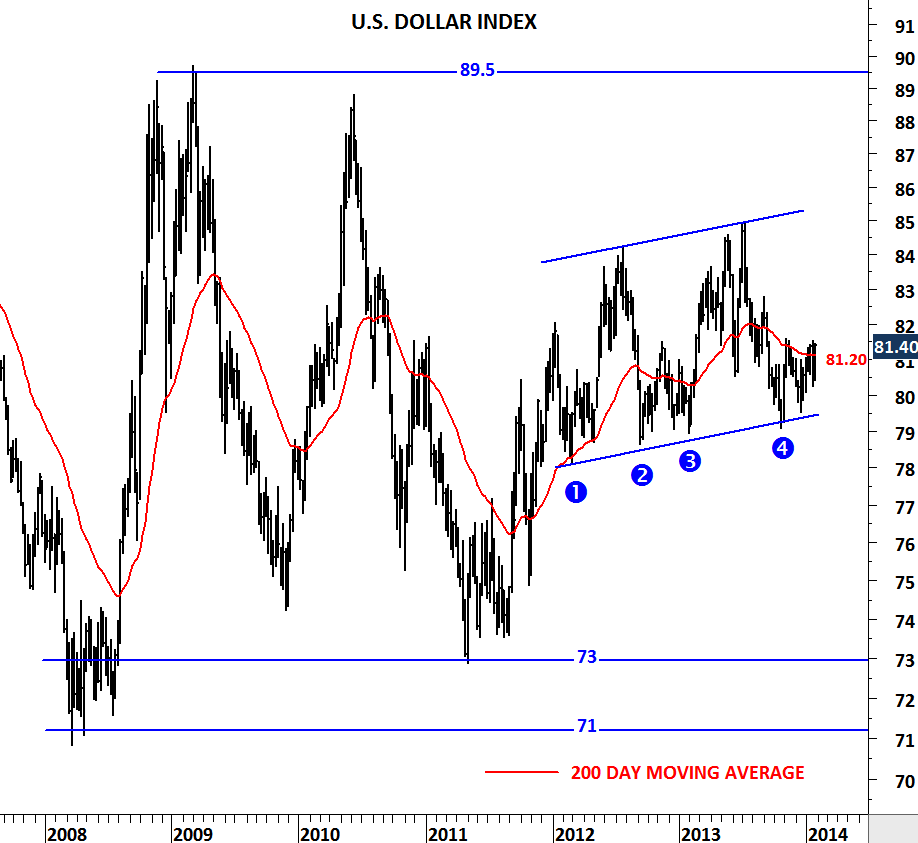
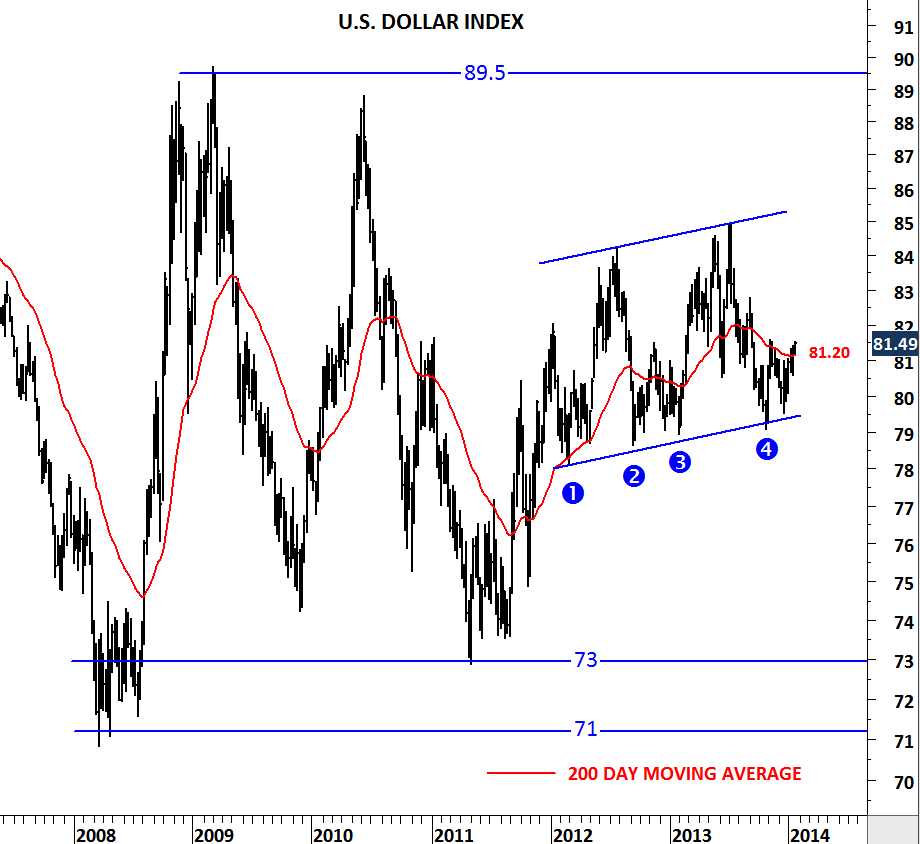
Friday’s move on the U.S. dollar index could be a major medium-term reversal for some of the cross rates out there. I’ve discussed the U.S. dollar index chart in my earlier updates and drew attention to the importance of the strong medium-term support at 79.5 levels. (Earlier update is here) During last week U.S. dollar index breached the support level at 79.5 but failed to close below it. Instead the weekly close was at the highest level of the weekly bar. The low levels in March-April and May formed positive divergence on the MACD. Positive divergence on MACD is a bullish technical development. Following the same thought process on my earlier analysis, I will focus on two levels in the following weeks. 1) 200-day average at 80.50 levels which will act as resistance. 2) Medium-term support area between 79 and 79.50.

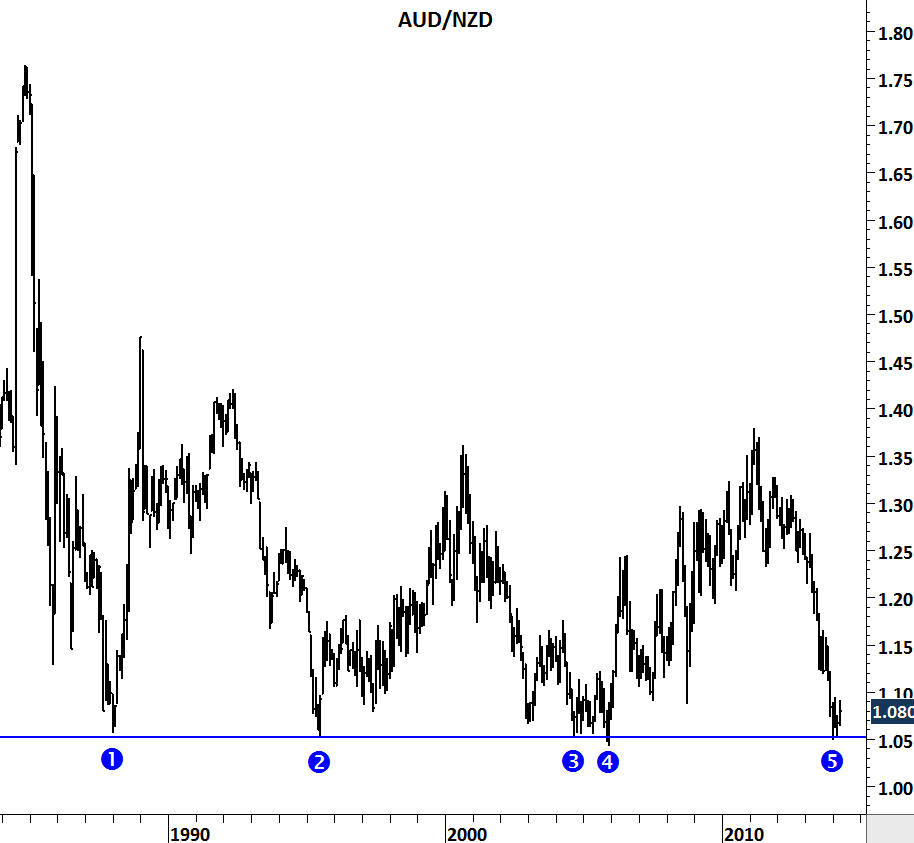
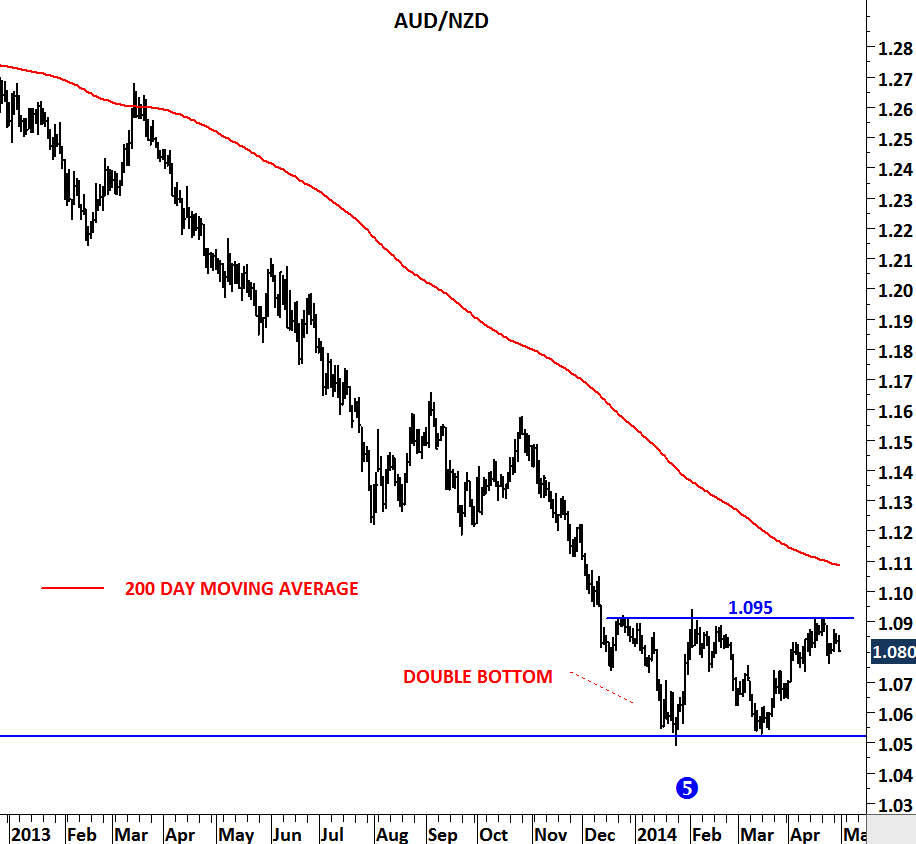
Do you see other bullish developments favoring U.S. dollar strength in the coming weeks? How would emerging market currencies react to possible strength in the U.S. dollar index? You can share your views with other followers. Have a very good week.

U.S. Dollar Index (Daily scale)

US DOLLAR INDEX daily

U.S. Dollar Index (Weekly scale)

US DOLLAR INDEX weekly

AUD/NZD

AUDNZD

Long-term charts usually reveal important information. Historical price levels are widely followed by investors and traders. Australian Dollar/New Zealand Dollar cross-rate is now at a historical support level. This long-term support was tested for the 5th time over the past three decades. 1.05 acted as support and each time the cross rate reversed from this level and moved higher.

AUDNZD II

Similar technical action can repeat itself as we are also seeing a bullish base formation in the short/medium-term. Double bottom chart pattern suggests higher prices if the neckline at 1.095 is broken on the upside. A decisive break above 1.095 will favor Australian dollar against the New Zealand dollar in the short/medium-term.

U.S. DOLLAR INDEX

Multi-year low volatility reading on the U.S. dollar index suggests strong directional movement in the following weeks/months. U.S. dollar index tested the strong support level for the 5th time over the past two years and a breakdown below this support level at 79.5 could push the U.S. dollar index towards 75 levels. Unless we see another rebound from the strong support in the following weeks, we will favor a bearish scenario for the U.S. dollar. Low volatility is something we should keep an eye on. Previous breakouts from such low volatility readings resulted in sharp price swings.

US DOLLAR INDEX


U.S. DOLLAR INDEX

February will be an important month for currencies and especially for the U.S. dollar. U.S. dollar index rebounded from the lower boundary of its 2 year-long consolidation for the 4th time and now the index is challenging the minor resistance at 81.50 levels. Similar breakouts resulted in a strong U.S. dollar in the first half of 2012 and in the beginning of 2013. Breakout above 81.50 can push the U.S. dollar index towards 84-85 area in the following months. Strong medium-term support remains at 79.5.

U.S. Dollar Index (Weekly scale)

US DOLLAR INDEX weekly

U.S. Dollar Index (Daily scale)

US DOLLAR INDEX daily

U.S. DOLLAR vs. CAD, MXN, TWD, TRY …

Yes, it is a global trend and the dollar is gaining strength against most of the currency pairs. U.S. dollar index is trying to clear its 200 day moving average. Emerging market currencies have depreciated against the U.S. dollar over the past few months and seems like more and more weak signals are being generated by the recent breakouts. Here are some of the charts I shared earlier during the month and some new charts I want to draw attention to.

US DOLLAR INDEX

USDCAD

USDMXN

USDTRY

USDPHP

USDRUB

USDZAR

USDTWD

GBP/CHF

GBPCHF

GBP is gaining strength against major currencies. This is a bullish chart pattern that has been forming over the past year on GBP/CHF. Cross rate tested 1.48 levels for three times over the past year and a break above this resistance could send the cross rate towards 1.51-1.52 area resulting in further GBP strength. Chart pattern can be classified as a double bottom or cup with handle . In both cases a breakout on the upside will generate a bullish signal for GBP in the short/medium-term.

EUR/USD & GBP/USD

EURUSD

GBPUSD

If you think that currencies have been volatile, you haven’t seen anything yet. We are likely to see more volatility and read about “currency wars” in the following months. These two charts are extremely powerful and suggest both cross rates are at an extreme low volatility period when compared with the past few decades. Volatility is cyclical and low volatility is usually followed by high volatility and vice versa. Both EUR/USD and GBP/USD are getting closer to a major breakout that will be followed by multi-month trend periods. These are very long-term charts and are presented to show that actually we are at a low volatility period. Levels to watch in the long-term for EUR/USD: (resistance: 1.41, support: 1.21) for GBP/USD: (resistance: 1.65, support: 1.50).

GBP/USD

One of the best long-term opportunity is presenting itself on the GBP/USD chart. This widely followed currency pair is now forming a perfect symmetrical triangle. Since 2009, GBP/USD has been consolidating in a range between 1,35 and 1,70. As it is always the case with symmetrical triangles, consolidation range narrows and is usually followed by a strong breakout. It is hard to guess the direction of the breakout. Symmetrical triangles can be continuation patterns as well as reversal patterns. In order not to anticipate it is always better to wait for a decisive close outside of the boundaries as a confirmation.

Over the past 3 years consolidation range has narrowed on the GBP/USD chart and the boundaries are now between 1.52 and 1.65. We are getting close to a strong breakout that is likely to result in a medium/long-term trend. Watch these two levels carefully on a weekly basis. 1.52 is support and 1.62-1.65 area is strong resistance.

U.S. DOLLAR INDEX

Lately I’ve been focusing more frequently on the currency markets and especially on crossrates against the U.S. dollar. Several developed and emerging market currencies are forming major reversal patterns (inverted Head & Shoulder) that is bullish for the dollar in the short/medium-term.

http://techcharts.wordpress.com/2012/01/22/u-s-dollar-index-eurusd/ (January)

http://techcharts.wordpress.com/2012/02/11/u-s-dollar-index-eurusd-2/ (February)

Inverted H&S pattern is a widely followed technical chart formation and has a very low failure rate. As a major reversal pattern, Head & Shoulder bottom (inverted Head & Shoulder) forms after a downtrend and its completion marks a change in trend. Head & Shoulder bottom pattern is not complete, and the downtrend is not reversed until neckline resistance is broken. With friday’s close, U.S. dollar index breached its neckline between 81.70 and 82 levels. This should be regarded as a positive technical action for the dollar and would require to search for more evidence that signals dollar strength in the short/medium-term. Below are some of the charts that have similar inverted H&S patterns, either in the phase of completion or already completed. These charts also support the case for dollar strength in the following weeks/months.

USD/BRL broke above its neckline at 1.92 as we have discussed in an earlier update. USD/IDR, USD/SEK are two other crossrates that have breached above their strong resistances. USD/CAD and USD/ZAR are still completing their base patterns. I’m not sure if we are going to see another QE that might put pressure on the dollar but so far, analyzed charts above are signaling an increasing demand for the dollar.

CANADIAN DOLLAR

This currency has a special place for me. During my post-graduate studies in Canada, I used to follow it closely as I was converting U.S. dollars to Canadian dollars almost every month. When I decided to move to Canada in 2003 crossrate was at 1.4 levels. 1 USD used to buy 1.4 CAD. It has constantly moved lower over the past decade and at one point it reached 0.90 levels.

Today I’m analyzing Canadian dollar and giving Tech Charts visitors a “heads up” on the possibility of a strong breakout in the following days. Canadian dollar formed several consolidation ranges in the past year. In Aug-Sep period a sideways consolidation, in Oct-Dec period a contracting range (symmetrical triangle) and now over the past one month another sideways consolidation. Each breakout from these consolidation ranges was strong and was followed by a directional move. Canadian dollar has been trading in a range between 1.009 and 0.995. Price found support above the 200 day moving average, a bullish development. We are likely to see a breakout soon. Please note that volatility reached an extreme low reading and a breakout could result in a strong move. A break above 1.009 level will be very positive for Canadian dollar. A break below 0.995 will be negative. My suggestion is to wait for a confirmation and take action when one of these levels are breached.