ORLA MINING – CUP & HANDLE CONTINUATION

Every week Tech Charts Global Equity Markets report features some of the well-defined, mature classical chart patterns under a lengthy watchlist and the chart pattern breakout signals that took place during that week. Global Equity Markets report covers single stocks from developed, emerging and frontier markets, ETF’s and global equity indices. The report starts with a review section that highlights the important chart developments on global equity benchmarks. This blog post features from the watchlist section Orla Mining Ltd. listed on the Toronto Stock Exchange.

ORLA MINING LTD (OLA.TO)

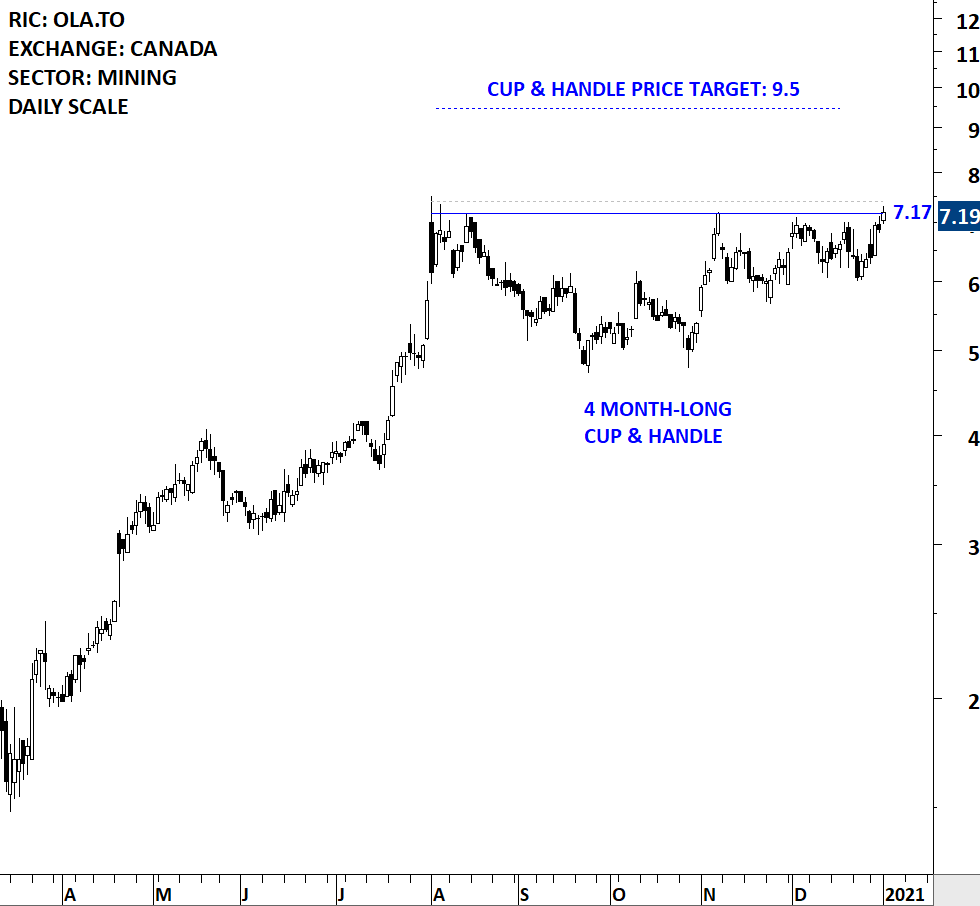
Orla Mining Ltd is a Canada-based mineral exploration company. The Company has the following projects: Camino Rojo and Cerro Quema. Camino Rojo is a gold and silver project located in Zacatecas State, Central Mexico. Camino Rojo has historical oxide reserves along with historical sulphide resources. The stock is listed on the Toronto Stock Exchange. Price chart formed a 4 month-long cup & handle continuation with the horizontal boundary acting as strong resistance at 7.17 levels. The horizontal boundary was tested several times over the course of the chart pattern. A daily close above 7.40 levels will confirm the breakout from the 4 month-long cup & handle continuation with the possible chart pattern price target of 9.5 levels. Breakout can push the stock to all-time highs. (Data as of Jan 4, 2020)


Tech Charts Membership

By becoming a Premium Member, you’ll be able to improve your knowledge of the principles of classical charting.

With this knowledge, you can merge them with your investing system. In fact, some investors use my analyses to modify their existing style to invest more efficiently and successfully.

Get Access Now

As a Premium Member of Aksel Kibar’s Tech Charts,

You will receive:

  • Global Equities Report. Delivered weekly.
  • Classical charting principles. Learn patterns and setups.
  • Actionable information. Worldwide indices and stocks of interest.
  • Risk management advice. The important trading points of each chart.
  • Information on breakout opportunities. Identify the ones you want to take action on.
  • Video tutorials. How patterns form and why they succeed or fail.
  • Watch list alerts. As they become available so you can act quickly.
  • Breakout alerts. Usually once a week.
  • Access to everything (now and as it becomes available)
    o Reports
    o Videos and video series
  • Multi-part webinar course. You learn the 8 most common charting principles.
  • Webinars. Actionable and timely advice on breaking out chart patterns.

For your convenience your membership auto renews each year.

Get Access Now

A HEALTHY NEW YEAR

We always include in our wishes “health” but sometimes we take it for granted. 2020 has been one of those years that we have realized that nothing should be taken for granted. I hope you and your families have been safe & healthy during these difficult times. I wish everyone a HEALTHY new year with great success and accomplishments. I’m thankful to all of you for your feedback and support that helps me to improve the service here at Tech Charts. I will continue to be of your assistance.

Kind regards,

Aksel Kibar, CMT

I’ve been covering several Global equity benchmarks in the Global Equity Markets report. One of those extremely bullish setups is taking place in China SSE Composite Index and also the other sub-indices in China. 2021 can start with a positive note for China equities and as a result for Emerging Markets.

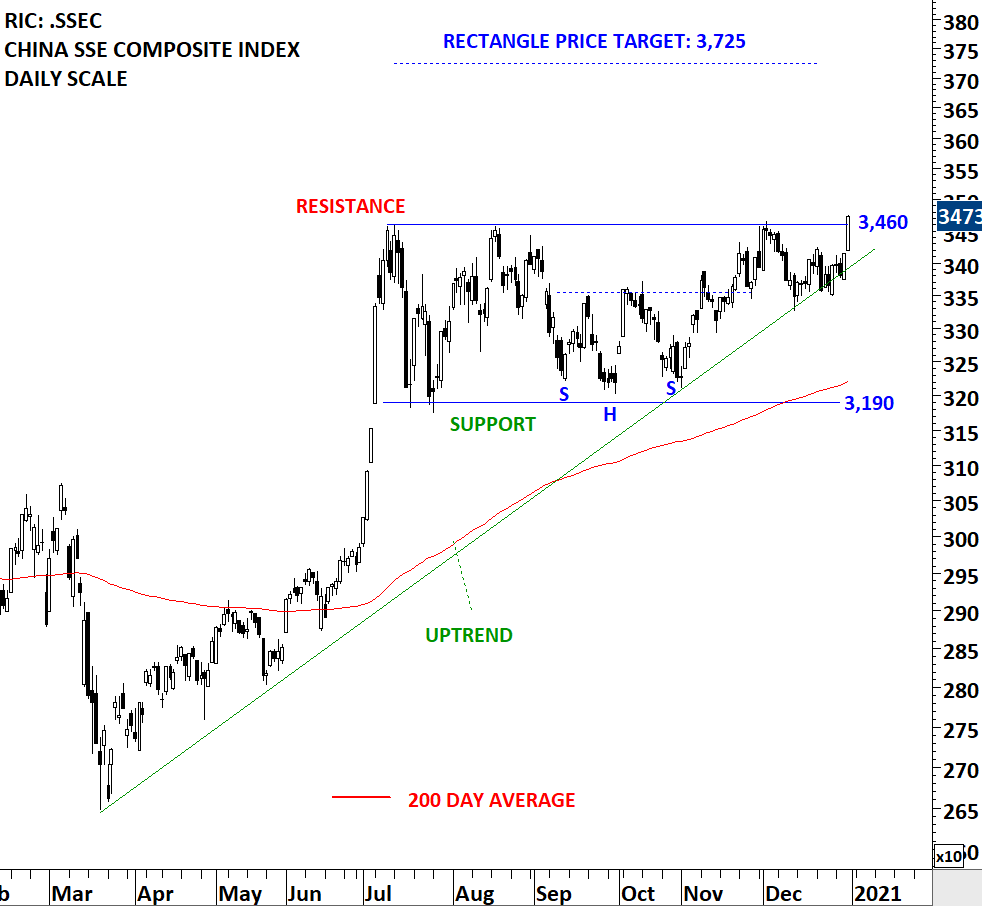
The chart below shows the China SSE Composite Index (larger universe for China equities). The index possibly formed a well-defined rectangle chart pattern with the upper boundary acting as resistance at 3,460 levels. Breakout can push the index towards the price objective at 3,725 levels. This week’s price action once again tested the upper boundary of the well-defined rectangle. Strong price action can be analyzed as positive and possibly a preparation for a breakout higher.


Tech Charts Membership

By becoming a Premium Member, you’ll be able to improve your knowledge of the principles of classical charting.

With this knowledge, you can merge them with your investing system. In fact, some investors use my analyses to modify their existing style to invest more efficiently and successfully.

Get Access Now

As a Premium Member of Aksel Kibar’s Tech Charts,

You will receive:

  • Global Equities Report. Delivered weekly.
  • Classical charting principles. Learn patterns and setups.
  • Actionable information. Worldwide indices and stocks of interest.
  • Risk management advice. The important trading points of each chart.
  • Information on breakout opportunities. Identify the ones you want to take action on.
  • Video tutorials. How patterns form and why they succeed or fail.
  • Watch list alerts. As they become available so you can act quickly.
  • Breakout alerts. Usually once a week.
  • Access to everything (now and as it becomes available)
    o Reports
    o Videos and video series
  • Multi-part webinar course. You learn the 8 most common charting principles.
  • Webinars. Actionable and timely advice on breaking out chart patterns.

For your convenience your membership auto renews each year.
Get Access Now

DASSAULT SYSTEMES – RECTANGLE

Every week Tech Charts Global Equity Markets report features some of the well-defined, mature classical chart patterns under a lengthy watchlist and the chart pattern breakout signals that took place during that week. Global Equity Markets report covers single stocks from developed, emerging and frontier markets, ETF’s and global equity indices. The report starts with a review section that highlights the important chart developments on global equity benchmarks. This blog post features from the watchlist section Dassault Systemes listed on the Paris Stock Exchange.

DASSAULT SYSTEMES SE (DAST.PA)

Dassault Systemes SE is a France-based software company, which provides different kind of three-dimensional (3D) solutions. The stock is listed on the Paris Stock Exchange. Price chart formed a 5 month-long rectangle with the horizontal boundary acting as strong resistance at 162.80 levels. The horizontal boundary was tested several times over the course of the chart pattern. A daily close above 165.30 levels will confirm the breakout from the 5 month-long rectangle with the possible chart pattern price target of 181.0 levels. Breakout can push the stock to all-time highs. (Data as of 23/12/2020)


Tech Charts Membership

By becoming a Premium Member, you’ll be able to improve your knowledge of the principles of classical charting.

With this knowledge, you can merge them with your investing system. In fact, some investors use my analyses to modify their existing style to invest more efficiently and successfully.

Get Access Now

As a Premium Member of Aksel Kibar’s Tech Charts,

You will receive:

  • Global Equities Report. Delivered weekly.
  • Classical charting principles. Learn patterns and setups.
  • Actionable information. Worldwide indices and stocks of interest.
  • Risk management advice. The important trading points of each chart.
  • Information on breakout opportunities. Identify the ones you want to take action on.
  • Video tutorials. How patterns form and why they succeed or fail.
  • Watch list alerts. As they become available so you can act quickly.
  • Breakout alerts. Usually once a week.
  • Access to everything (now and as it becomes available)
    o Reports
    o Videos and video series
  • Multi-part webinar course. You learn the 8 most common charting principles.
  • Webinars. Actionable and timely advice on breaking out chart patterns.

For your convenience your membership auto renews each year.

Get Access Now

ITB – ISHARES HOME CONSTRUCTION ETF

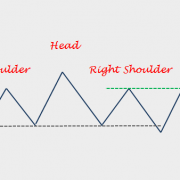
Every week Tech Charts Global Equity Markets report features some of the well-defined, mature classical chart patterns under a lengthy watchlist and the chart pattern breakout signals that took place during that week. Global Equity Markets report covers single stocks from developed, emerging and frontier markets, ETF’s and global equity indices. The report starts with a review section that highlights the important chart developments on global equity benchmarks. This blog post features from the watchlist section The ISHARES US HOME CONSTRUCTION ETF listed on the New York Stock Exchange. The ETF might be forming a H&S top failure. Below you will also find a short educational video on how H&S top failure can develop, trigger a fresh buy signal and how to measure price objective.

ISHARES US HOME CONSTRUCTION ETF (ITB)

The ISHARES US HOME CONSTRUCTION ETF seeks to track the investment results of the Dow Jones US Select Home Construction Index composed of US equities in the home construction sector. The Fund generally invests at least 90% of its assets in securities of the Underlying Index and in depositary receipts representing securities of the Index. The ETF is listed on the New York Stock Exchange. Price chart formed a 4 month-long head and shoulder top with the horizontal boundary acting as strong support at 51.80 levels. The horizontal boundary was tested several times over the course of the chart pattern. A daily close below 50.25 levels will confirm the breakdown from the 4 month-long head and shoulder top with the possible chart pattern price target of 44.8 levels. I’m also monitoring this chart for a possible H&S top failure. A breach above the high of the right shoulder will negate the H&S top chart pattern. A daily close above 60 levels (3% above the high of right shoulder) can be used as a breakout confirmation to trade the chart pattern from the long side. Price objective for the H&S top failure stands at 67 levels. (Data as of 17/12/2020)

A short educational video on H&S top failures


Tech Charts Membership

By becoming a Premium Member, you’ll be able to improve your knowledge of the principles of classical charting.

With this knowledge, you can merge them with your investing system. In fact, some investors use my analyses to modify their existing style to invest more efficiently and successfully.

Get Access Now

As a Premium Member of Aksel Kibar’s Tech Charts,

You will receive:

  • Global Equities Report. Delivered weekly.
  • Classical charting principles. Learn patterns and setups.
  • Actionable information. Worldwide indices and stocks of interest.
  • Risk management advice. The important trading points of each chart.
  • Information on breakout opportunities. Identify the ones you want to take action on.
  • Video tutorials. How patterns form and why they succeed or fail.
  • Watch list alerts. As they become available so you can act quickly.
  • Breakout alerts. Usually once a week.
  • Access to everything (now and as it becomes available)
    o Reports
    o Videos and video series
  • Multi-part webinar course. You learn the 8 most common charting principles.
  • Webinars. Actionable and timely advice on breaking out chart patterns.

For your convenience your membership auto renews each year.
Get Access Now

RECTANGLE – UNIVAR SOLUTIONS INC (UNVR.K)

Every week Tech Charts Global Equity Markets report features some of the well-defined, mature classical chart patterns under a lengthy watchlist and the chart pattern breakout signals that took place during that week. Global Equity Markets report covers single stocks from developed, emerging and frontier markets, ETF’s and global equity indices. The report starts with a review section that highlights the important chart developments on global equity benchmarks. This blog post features from the watchlist section Univar Solutions Inc. listed on the New York Stock Exchange.

UNIVAR SOLUTIONS INC (UNVR.K)

Univar Solutions Inc., formerly Univar Inc., is a global chemical and ingredient distributor and provider of value-added services. The Company operates through four segments: Univar USA, Univar Canada, Univar Europe and the Middle East and Africa and Latin America. The stock is listed on the New York Stock Exchange. Price chart formed a 6 month-long rectangle with the horizontal boundary acting as strong resistance at 19.00 levels. The horizontal boundary was tested several times over the course of the chart pattern. A daily close above 19.60 levels will confirm the breakout from the 6 month-long rectangle with the possible chart pattern price target of 22.3 levels. With tight and lengthy consolidations like these price can reach 2x the price objective. I added the 2x price target which is standing at 25.7 levels. (Data as of 07/12/2020)


Tech Charts Membership

By becoming a Premium Member, you’ll be able to improve your knowledge of the principles of classical charting.

With this knowledge, you can merge them with your investing system. In fact, some investors use my analyses to modify their existing style to invest more efficiently and successfully.

Get Access Now

As a Premium Member of Aksel Kibar’s Tech Charts,

You will receive:

  • Global Equities Report. Delivered weekly.
  • Classical charting principles. Learn patterns and setups.
  • Actionable information. Worldwide indices and stocks of interest.
  • Risk management advice. The important trading points of each chart.
  • Information on breakout opportunities. Identify the ones you want to take action on.
  • Video tutorials. How patterns form and why they succeed or fail.
  • Watch list alerts. As they become available so you can act quickly.
  • Breakout alerts. Usually once a week.
  • Access to everything (now and as it becomes available)
    o Reports
    o Videos and video series
  • Multi-part webinar course. You learn the 8 most common charting principles.
  • Webinars. Actionable and timely advice on breaking out chart patterns.

For your convenience your membership auto renews each year.
Get Access Now

CUP & HANDLE CONTINUATION – EKINOPS SA (EKI.PA) 

Every week Tech Charts Global Equity Markets report features some of the well-defined, mature classical chart patterns under a lengthy watchlist and the chart pattern breakout signals that took place during that week. Global Equity Markets report covers single stocks from developed, emerging and frontier markets, ETF’s and global equity indices. The report starts with a review section that highlights the important chart developments on global equity benchmarks. This blog post features from the watchlist section Ekinops SA listed on the Paris Stock Exchange.

EKINOPS SA (EKI.PA)

Ekinops SA is a France-based company engaged in the provision of optical transport solutions for service providers and private networks. The Company develops optical aggregation and transportation sub-systems for metropolitan and long-distance networks. The stock is listed on the Paris Stock Exchange. Price chart formed an 11 month-long cup & handle continuation  with the horizontal boundary acting as strong resistance at 6.60 levels. The horizontal boundary was tested several times over the course of the chart pattern. A daily close above 6.80 levels will confirm the breakout from the 11 month-long cup & handle continuation  with the possible chart pattern price target of 8.8 levels. (Data as of 30/11/2020)

A short educational video on Cup & handle continuation chart pattern


Tech Charts Membership

By becoming a Premium Member, you’ll be able to improve your knowledge of the principles of classical charting.

With this knowledge, you can merge them with your investing system. In fact, some investors use my analyses to modify their existing style to invest more efficiently and successfully.

Get Access Now

As a Premium Member of Aksel Kibar’s Tech Charts,

You will receive:

  • Global Equities Report. Delivered weekly.
  • Classical charting principles. Learn patterns and setups.
  • Actionable information. Worldwide indices and stocks of interest.
  • Risk management advice. The important trading points of each chart.
  • Information on breakout opportunities. Identify the ones you want to take action on.
  • Video tutorials. How patterns form and why they succeed or fail.
  • Watch list alerts. As they become available so you can act quickly.
  • Breakout alerts. Usually once a week.
  • Access to everything (now and as it becomes available)
    o Reports
    o Videos and video series
  • Multi-part webinar course. You learn the 8 most common charting principles.
  • Webinars. Actionable and timely advice on breaking out chart patterns.

For your convenience your membership auto renews each year.

Get Access Now

SYMMETRICAL TRIANGLE AND BTCUSD

Every week Tech Charts Global Equity Markets report features some of the well-defined, mature classical chart patterns under a lengthy watchlist and the chart pattern breakout signals that took place during that week. Global Equity Markets report covers single stocks from developed, emerging and frontier markets, ETF’s and global equity indices. The report starts with a review section that highlights the important chart developments on global equity benchmarks, commodities, currencies and cryptocurrencies that might be in focus. This blog post features from the review section BTCUSD. Please note that this is a monthly scale price chart and the November price action (last candle) is still not completed. I’m featuring this chart to show the levels BTC is testing and to draw attention to a possible outcome with symmetrical triangle breakouts.

BTCUSD possibly completed a symmetrical triangle chart pattern on the long-term price chart. Symmetrical triangle is a chart pattern with diagonal boundaries. One difficulty with trading breakouts from diagonal boundaries is the fact that price, following the breakout can find resistance at the minor high. Whereas breakouts from chart patterns with horizontal boundaries usually clear all minor highs at the same time of the breakout.

The minor high for BTC stands at 19,666 levels. Question is, will BTC find resistance at the minor high before breaking out to all-time highs. Previous two breakouts took place after price found resistance and retraced from the minor highs. Chart pattern price target for BTC stands at 30K and with possibly a potential to move much higher, but now we need to focus on the price action around 19,666 levels.
Here is a short educational video that explains the importance of the minor high as resistance with symmetrical triangle breakouts.

Tech Charts Membership

By becoming a Premium Member, you’ll be able to improve your knowledge of the principles of classical charting.

With this knowledge, you can merge them with your investing system. In fact, some investors use my analyses to modify their existing style to invest more efficiently and successfully.

Get Access Now

As a Premium Member of Aksel Kibar’s Tech Charts,

You will receive:

  • Global Equities Report. Delivered weekly.
  • Classical charting principles. Learn patterns and setups.
  • Actionable information. Worldwide indices and stocks of interest.
  • Risk management advice. The important trading points of each chart.
  • Information on breakout opportunities. Identify the ones you want to take action on.
  • Video tutorials. How patterns form and why they succeed or fail.
  • Watch list alerts. As they become available so you can act quickly.
  • Breakout alerts. Usually once a week.
  • Access to everything (now and as it becomes available)
    o Reports
    o Videos and video series
  • Multi-part webinar course. You learn the 8 most common charting principles.
  • Webinars. Actionable and timely advice on breaking out chart patterns.

For your convenience your membership auto renews each year.
Get Access Now

GOLD MINERS – MARATHON GOLD CORP (MOZ.TO) 

Every week Tech Charts Global Equity Markets report features some of the well-defined, mature classical chart patterns under a lengthy watchlist and the chart pattern breakout signals that took place during that week. Global Equity Markets report covers single stocks from developed, emerging and frontier markets, ETF’s and global equity indices. The report starts with a review section that highlights the important chart developments on global equity benchmarks. This blog post features from the watchlist section Marathon Gold Corp (Marathon) listed on the Toronto Stock Exchange.

With breakouts I like to confirm couple of things on price charts. When those conditions are met, I have higher conviction on the trade setup. Those are:

  1. A well-defined chart pattern with horizontal boundaries
  2. Several tests of chart pattern boundary before a breakout takes place
  3. If the chart pattern is a bullish setup, possibility of breakout taking place above the 200-day average (trend filter)
  4. Possibility of a breakout to all-time highs (path of least resistance)

Below chart is meeting all the above criteria and as a result it is a high conviction trade setup for me.

MARATHON GOLD CORP (MOZ.TO)

Marathon Gold Corp (Marathon) is a Canada-based company engaged in the acquisition, exploration and development of natural resource properties located in North America. The stock is listed on the Toronto Stock Exchange. Price chart formed a 3 month-long rectangle with the horizontal boundary acting as strong resistance at 2.60 levels. The horizontal boundary was tested several times over the course of the chart pattern. A daily close above 2.67 levels will confirm the breakout from the 3 month-long rectangle with the possible chart pattern price target of 3.13 levels.


Tech Charts Membership

By becoming a Premium Member, you’ll be able to improve your knowledge of the principles of classical charting.

With this knowledge, you can merge them with your investing system. In fact, some investors use my analyses to modify their existing style to invest more efficiently and successfully.

Get Access Now

As a Premium Member of Aksel Kibar’s Tech Charts,

You will receive:

  • Global Equities Report. Delivered weekly.
  • Classical charting principles. Learn patterns and setups.
  • Actionable information. Worldwide indices and stocks of interest.
  • Risk management advice. The important trading points of each chart.
  • Information on breakout opportunities. Identify the ones you want to take action on.
  • Video tutorials. How patterns form and why they succeed or fail.
  • Watch list alerts. As they become available so you can act quickly.
  • Breakout alerts. Usually once a week.
  • Access to everything (now and as it becomes available)
    o Reports
    o Videos and video series
  • Multi-part webinar course. You learn the 8 most common charting principles.
  • Webinars. Actionable and timely advice on breaking out chart patterns.

For your convenience your membership auto renews each year.
Get Access Now

ISHARES S&P MID CAP 400 VALUE ETF (IJJ)

Every week Tech Charts Global Equity Markets report features some of the well-defined, mature classical chart patterns under a lengthy watchlist and the chart pattern breakout signals that took place during that week. Global Equity Markets report covers single stocks from developed, emerging and frontier markets, ETF’s and global equity indices. The report starts with a review section that highlights the important chart developments on global equity benchmarks. This blog post features from the watchlist section the iShares S&P MID CAP 400 VALUE ETF (IJJ) listed on the New York Stock Exchange.

ISHARES S&P MID CAP 400 VALUE ETF (IJJ)

The Fund seeks investment results that correspond generally to the price and yield performance, before fees and expenses, of the S&P MidCap 400/BARRA Value Index. The Index consists of stocks from a broad range of industries. Uses a replication strategy to track the Index. The ETF is listed on the New York Stock Exchange. Price chart formed a 5 month-long rectangle with the horizontal boundary acting as strong resistance at 74.40 levels. The horizontal boundary was tested several times over the course of the chart pattern. A daily close above 76.60 levels will confirm the breakout from the 5 month-long rectangle with the possible chart pattern price target of 85.0 levels.


Tech Charts Membership

By becoming a Premium Member, you’ll be able to improve your knowledge of the principles of classical charting.

With this knowledge, you can merge them with your investing system. In fact, some investors use my analyses to modify their existing style to invest more efficiently and successfully.

Get Access Now

As a Premium Member of Aksel Kibar’s Tech Charts,

You will receive:

  • Global Equities Report. Delivered weekly.
  • Classical charting principles. Learn patterns and setups.
  • Actionable information. Worldwide indices and stocks of interest.
  • Risk management advice. The important trading points of each chart.
  • Information on breakout opportunities. Identify the ones you want to take action on.
  • Video tutorials. How patterns form and why they succeed or fail.
  • Watch list alerts. As they become available so you can act quickly.
  • Breakout alerts. Usually once a week.
  • Access to everything (now and as it becomes available)
    o Reports
    o Videos and video series
  • Multi-part webinar course. You learn the 8 most common charting principles.
  • Webinars. Actionable and timely advice on breaking out chart patterns.

For your convenience your membership auto renews each year.
Get Access Now

ISHARES MSCI ALL COUNTRY WORLD INDEX ETF (ACWI.O)

Every week Tech Charts Global Equity Markets report features some of the well-defined, mature classical chart patterns under a lengthy watchlist and the chart pattern breakout signals that took place during that week. Global Equity Markets report covers single stocks from developed, emerging and frontier markets, ETF’s and global equity indices. The report starts with a review section that highlights the important chart developments on global equity benchmarks. This blog post features from the review section the iShares MSCI All Country World Index ETF (ACWI.O) listed on the Nasdaq Stock Exchange.

As we are getting closer to the U.S. elections, this chart is on my radar as it offers two possibilities from a classical charting perspective. A bearish outcome with the completion of a double top or a bullish outcome with the rebound from support area to resume the existing uptrend. We are at inflection point.

The benchmark for the Global equity markets performance, the iShares MSCI All Country World Index ETF (ACWI.O) resumed its correction after finding resistance at 84.15 levels, the minor high. The uptrend on Global equities is intact and ACWI ETF continues to trend higher above its 200-day average which is acting as support at 76.7 levels. Global equities are searching for direction in the short-term. Price is at an important inflection point. Last 2 month’s consolidation between 84.15 and 76.7 levels can act as

1) Double top, break down the support at 76.7 levels and resume correction towards 70 levels, 2) Rectangle continuation, rebound from current levels and resume uptrend towards 84.15 levels. It is important to note that Friday’s price action formed a bullish hammer around support levels and could signal reversal from support if we see follow through in the following days.


Tech Charts Membership

By becoming a Premium Member, you’ll be able to improve your knowledge of the principles of classical charting.

With this knowledge, you can merge them with your investing system. In fact, some investors use my analyses to modify their existing style to invest more efficiently and successfully.

Get Access Now

As a Premium Member of Aksel Kibar’s Tech Charts,

You will receive:

  • Global Equities Report. Delivered weekly.
  • Classical charting principles. Learn patterns and setups.
  • Actionable information. Worldwide indices and stocks of interest.
  • Risk management advice. The important trading points of each chart.
  • Information on breakout opportunities. Identify the ones you want to take action on.
  • Video tutorials. How patterns form and why they succeed or fail.
  • Watch list alerts. As they become available so you can act quickly.
  • Breakout alerts. Usually once a week.
  • Access to everything (now and as it becomes available)
    o Reports
    o Videos and video series
  • Multi-part webinar course. You learn the 8 most common charting principles.
  • Webinars. Actionable and timely advice on breaking out chart patterns.

For your convenience your membership auto renews each year.
Get Access Now