A LONG-TERM BREAKOUT OPPORTUNITY

Every week Tech Charts Global Equity Markets report features some of the well-defined, mature classical chart patterns under a lengthy watchlist and the chart pattern breakout signals that took place during that week. Global Equity Markets report covers single stocks from developed, emerging and frontier markets, ETF’s and global equity indices. The report starts with a review section that highlights the important chart developments on global equity benchmarks and miscellaneous charts of interest. This blog post features from the review section a long-term base formation and a breakout opportunity that is listed on Toronto Stock Exchange.

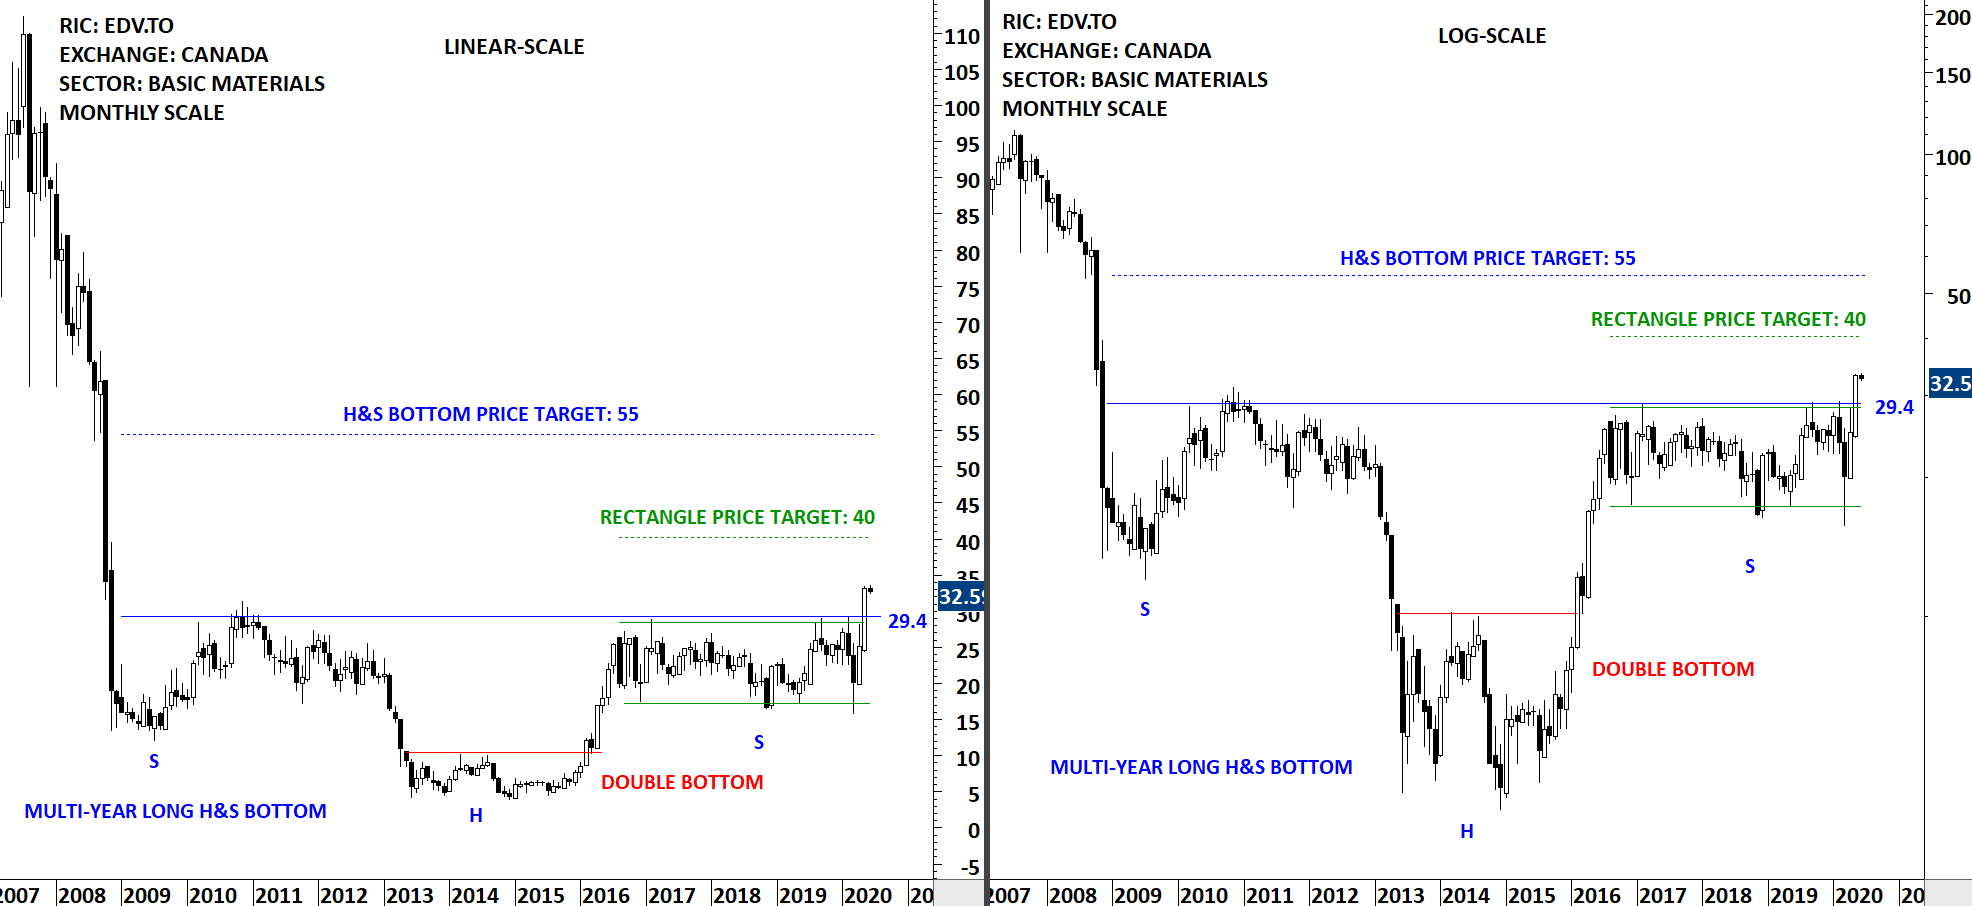
ENDEAVOUR MINING CORP (EDV.TO)

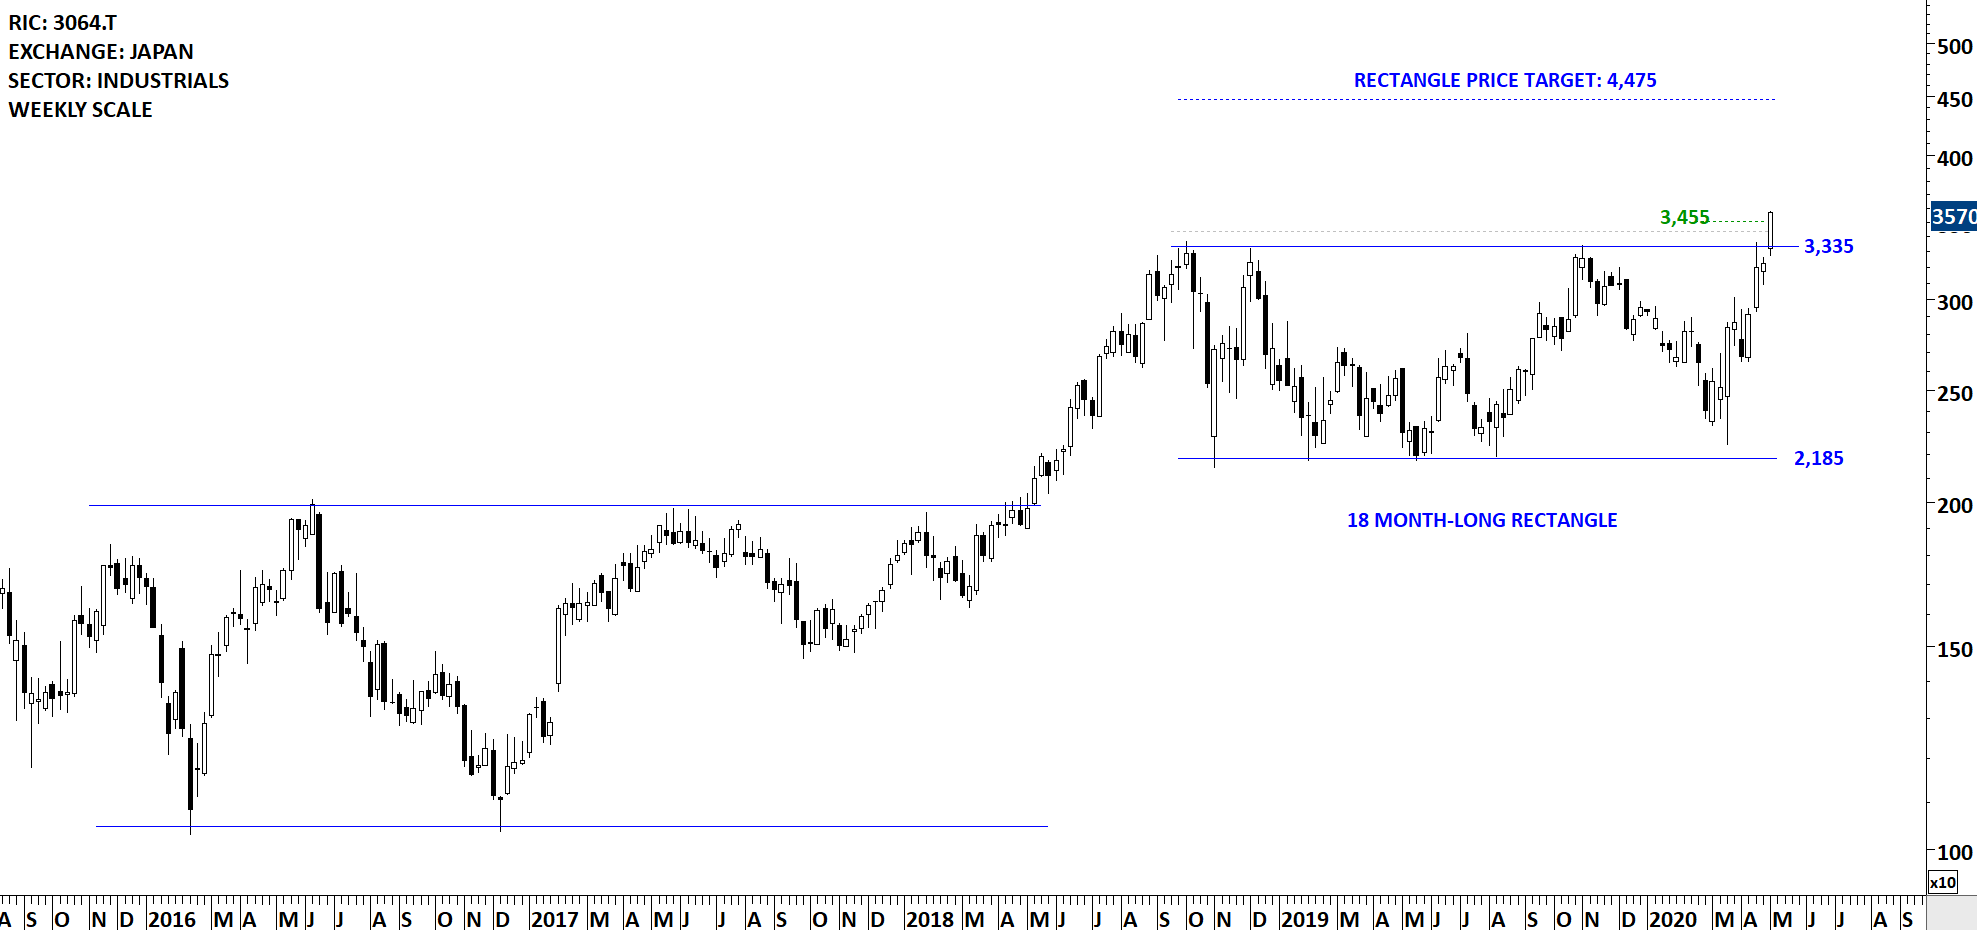
Endeavour Mining Corporation (Endeavour) is an intermediate gold producer. The Company is a gold mining company that operates four mines in Cote d’Ivoire (Agbaou and Ity), Burkina Faso (Karma) and Ghana (Nzema), along with project development and exploration assets. The stock is listed on Toronto Stock Exchange. Price chart formed a multi-year long rectangle as part of a possible decade-long H&S bottom. This is a very long-term chart pattern and should be given enough room with protective stops. I would view it as a long-term breakout opportunity. I added both the linear scale and logarithmic scale price charts (difference between log and linear scale price charts). Rectangle chart pattern has a possible price target of 40 and the price objective for the H&S bottom is at 55 levels.


Tech Charts Membership

By becoming a Premium Member, you’ll be able to improve your knowledge of the principles of classical charting.

With this knowledge, you can merge them with your investing system. In fact, some investors use my analyses to modify their existing style to invest more efficiently and successfully.

Get Access Now

As a Premium Member of Aksel Kibar’s Tech Charts,

You will receive:

  • Global Equities Report. Delivered weekly.
  • Classical charting principles. Learn patterns and setups.
  • Actionable information. Worldwide indices and stocks of interest.
  • Risk management advice. The important trading points of each chart.
  • Information on breakout opportunities. Identify the ones you want to take action on.
  • Video tutorials. How patterns form and why they succeed or fail.
  • Watch list alerts. As they become available so you can act quickly.
  • Breakout alerts. Usually once a week.
  • Access to everything (now and as it becomes available)
    o Reports
    o Videos and video series
  • Multi-part webinar course. You learn the 8 most common charting principles.
  • Webinars. Actionable and timely advice on breaking out chart patterns.

For your convenience your membership auto renews each year.

Get Access Now

CUP & HANDLE CONTINUATION

Every week Tech Charts Global Equity Markets report features some of the well-defined, mature classical chart patterns under a lengthy watchlist and the chart pattern breakout signals that took place during that week. Global Equity Markets report covers single stocks from developed, emerging and frontier markets, ETF’s and global equity indices. The report starts with a review section that highlights the important chart developments on global equity benchmarks. This blog post features from the watchlist section a cup & handle continuation chart pattern listed on the Nasdaq Stock Exchange.

ADVANCED MICRO DEVICES INC (AMD.O)

Advanced Micro Devices, Inc. is a global semiconductor company. The Company is engaged in offering x86 microprocessors, as standalone devices or as incorporated into an accelerated processing unit (APU), chipsets, discrete graphics processing units (GPUs) and professional graphics, and server and embedded processors and semi-custom System-on-Chip (SoC) products and technology for game consoles. The stock is listed on the Nasdaq Stock Exchange. Price chart formed a 4 month-long cup & handle with the horizontal boundary acting as strong resistance at 58.5 levels. The horizontal boundary was tested several times over the course of the chart pattern. A daily close above 60.2 levels will confirm the breakout from the 4 month-long cup & handle with the possible chart pattern price target of 77.6 levels.


Tech Charts Membership

By becoming a Premium Member, you’ll be able to improve your knowledge of the principles of classical charting.

With this knowledge, you can merge them with your investing system. In fact, some investors use my analyses to modify their existing style to invest more efficiently and successfully.

Get Access Now

As a Premium Member of Aksel Kibar’s Tech Charts,

You will receive:

  • Global Equities Report. Delivered weekly.
  • Classical charting principles. Learn patterns and setups.
  • Actionable information. Worldwide indices and stocks of interest.
  • Risk management advice. The important trading points of each chart.
  • Information on breakout opportunities. Identify the ones you want to take action on.
  • Video tutorials. How patterns form and why they succeed or fail.
  • Watch list alerts. As they become available so you can act quickly.
  • Breakout alerts. Usually once a week.
  • Access to everything (now and as it becomes available)
    o Reports
    o Videos and video series
  • Multi-part webinar course. You learn the 8 most common charting principles.
  • Webinars. Actionable and timely advice on breaking out chart patterns.

For your convenience your membership auto renews each year.

Get Access Now

H&S BOTTOM REVERSAL

Every week Tech Charts Global Equity Markets report features some of the well-defined, mature classical chart patterns under a lengthy watchlist and the chart pattern breakout signals that took place during that week. Global Equity Markets report covers single stocks from developed, emerging and frontier markets, ETF’s and global equity indices. The report starts with a review section that highlights the important chart developments on global equity benchmarks. This blog post features from the watchlist section a head and shoulder bottom reversal chart pattern that is listed on the Paris Stock Exchange.

Over the past 3 years (2017-2020) Tech Charts Global Equity Markets report alerted members on 616 breakouts and breakdowns (long and short opportunities). The compiled statistics on those breakouts are as below. A chart pattern once completed with a confirmed breakout either reaches its chart pattern price target (successful) or it reaches chart pattern negation level (failed). It is interesting to note that H&S bottom reversal has been one of the best performing chart pattern followed by another H&S; the H&S top reversal. More detailed statistics will be shared during our members annual review which should take place by end of May.

REMY COINTREAU SA (RCOP.PA)

Remy Cointreau SA is a France-based company engaged in the production and distribution of wines and spirits. The stock is listed on the Paris Stock Exchange. Price chart formed a 4 month-long head and shoulder bottom with the horizontal boundary acting as strong resistance at 105.0 levels. The horizontal boundary was tested several times over the course of the chart pattern. A daily close above 107.0 levels will confirm the breakout from the 4 month-long head and shoulder bottom with the possible chart pattern price target of 126.0 levels. (Data as of May 12, 2020, CET 13:00)


Tech Charts Membership

By becoming a Premium Member, you’ll be able to improve your knowledge of the principles of classical charting.

With this knowledge, you can merge them with your investing system. In fact, some investors use my analyses to modify their existing style to invest more efficiently and successfully.

Get Access Now

As a Premium Member of Aksel Kibar’s Tech Charts,

You will receive:

  • Global Equities Report. Delivered weekly.
  • Classical charting principles. Learn patterns and setups.
  • Actionable information. Worldwide indices and stocks of interest.
  • Risk management advice. The important trading points of each chart.
  • Information on breakout opportunities. Identify the ones you want to take action on.
  • Video tutorials. How patterns form and why they succeed or fail.
  • Watch list alerts. As they become available so you can act quickly.
  • Breakout alerts. Usually once a week.
  • Access to everything (now and as it becomes available)
    o Reports
    o Videos and video series
  • Multi-part webinar course. You learn the 8 most common charting principles.
  • Webinars. Actionable and timely advice on breaking out chart patterns.

For your convenience your membership auto renews each year.

Get Access Now

RECTANGLE BREAKOUT

Every week Tech Charts Global Equity Markets report features some of the well-defined, mature classical chart patterns under a lengthy watchlist and the chart pattern breakout signals that took place during that week. Global Equity Markets report covers single stocks from developed, emerging and frontier markets, ETF’s and global equity indices. The report starts with a review section that highlights the important chart developments on global equity benchmarks. This blog post features from the breakout alerts section a rectangle chart pattern that completed on the Nikkei Stock Exchange.

MONOTARO CO LTD (3064.T)

MonotaRO Co.,Ltd. is a Japan-based company principally engaged in the sale of factory indirect materials. The Company sells factory indirect materials to customers, mainly small and medium-sized manufacturing companies in Japan and overseas, by mail order using e-commerce (distribution based on the Internet). The stock is listed on the Tokyo Stock Exchange. Price chart formed an 18 month-long rectangle with the horizontal boundary acting as strong resistance at 3,335.0 levels. The horizontal boundary was tested several times over the course of the chart pattern. The daily close above 3,435.0 levels confirmed the breakout from the 18 month-long rectangle with the possible chart pattern price target of 4,475.0 levels.

Depending on each trader/investor risk profile a stop-loss can be placed below the chart pattern boundary at 3,335 levels. There are different types of breakouts. I discussed 4 types of breakouts in a twitter thread. I also attached it below for your reference.

4 TYPES OF BREAKOUTS


Tech Charts Membership

By becoming a Premium Member, you’ll be able to improve your knowledge of the principles of classical charting.

With this knowledge, you can merge them with your investing system. In fact, some investors use my analyses to modify their existing style to invest more efficiently and successfully.

Get Access Now

As a Premium Member of Aksel Kibar’s Tech Charts,

You will receive:

  • Global Equities Report. Delivered weekly.
  • Classical charting principles. Learn patterns and setups.
  • Actionable information. Worldwide indices and stocks of interest.
  • Risk management advice. The important trading points of each chart.
  • Information on breakout opportunities. Identify the ones you want to take action on.
  • Video tutorials. How patterns form and why they succeed or fail.
  • Watch list alerts. As they become available so you can act quickly.
  • Breakout alerts. Usually once a week.
  • Access to everything (now and as it becomes available)
    o Reports
    o Videos and video series
  • Multi-part webinar course. You learn the 8 most common charting principles.
  • Webinars. Actionable and timely advice on breaking out chart patterns.

For your convenience your membership auto renews each year.

Get Access Now

SHORT-TERM TRADING OPPORTUNITIES: FLAG PATTERNS

Every week Tech Charts Global Equity Markets report features some of the well-defined, mature classical chart patterns under a lengthy watchlist and the chart pattern breakout signals that took place during that week. Global Equity Markets report covers single stocks from developed, emerging and frontier markets, ETF’s and global equity indices. The report starts with a review section that highlights the important chart developments on global equity benchmarks. This blog post features from the watchlist section a flag chart pattern on Gubre Fabrikalari that is listed on the Istanbul Stock Exchange.

GUBRE FABRIKALARI TAS (GUBRF.IS)

Gubre Fabrikalari TAS (Gubretas) is a Turkey-based company engaged in the production and marketing of chemical fertilizers, including solid fertilizers, liquid fertilizers, powder-based fertilizers and organic fertilizers. The stock is listed on the Istanbul Stock Exchange. Price chart formed a 1 month-long flag with the horizontal boundary acting as resistance at 15.6 levels. The horizontal boundary was tested several times over the course of the chart pattern. A daily close above 16.0 levels will confirm the breakout from the 1 month-long flag with the possible chart pattern price target of 19.0 levels.


Tech Charts Membership

By becoming a Premium Member, you’ll be able to improve your knowledge of the principles of classical charting.

With this knowledge, you can merge them with your investing system. In fact, some investors use my analyses to modify their existing style to invest more efficiently and successfully.

Get Access Now

As a Premium Member of Aksel Kibar’s Tech Charts,

You will receive:

  • Global Equities Report. Delivered weekly.
  • Classical charting principles. Learn patterns and setups.
  • Actionable information. Worldwide indices and stocks of interest.
  • Risk management advice. The important trading points of each chart.
  • Information on breakout opportunities. Identify the ones you want to take action on.
  • Video tutorials. How patterns form and why they succeed or fail.
  • Watch list alerts. As they become available so you can act quickly.
  • Breakout alerts. Usually once a week.
  • Access to everything (now and as it becomes available)
    o Reports
    o Videos and video series
  • Multi-part webinar course. You learn the 8 most common charting principles.
  • Webinars. Actionable and timely advice on breaking out chart patterns.

For your convenience your membership auto renews each year.

Get Access Now

RECTANGLE BULLISH CONTINUATION

Every week Tech Charts Global Equity Markets report features some of the well-defined, mature classical chart patterns under a lengthy watchlist and the chart pattern breakout signals that took place during that week. Global Equity Markets report covers single stocks from developed, emerging and frontier markets, ETF’s and global equity indices. The report starts with a review section that highlights the important chart developments on global equity benchmarks. This blog post features from the watchlist section a rectangle chart pattern that is listed on the Hong Kong Stock Exchange.

SINO BIOPHARMACEUTICAL LTD (1177.HK)

Sino Biopharmaceutical Limited is an investment holding company principally engaged in the medicine products business. The stock is listed on the Hong Kong Stock Exchange. Price chart formed a 6 month-long rectangle with the horizontal boundary acting as strong resistance at 12.15 levels. The horizontal boundary was tested several times over the course of the chart pattern. A daily close above 12.5 levels will confirm the breakout from the 6 month-long rectangle with the possible chart pattern price target at 14.8 levels. Please note that this is a weekly scale price chart and the last weekly candle includes two days of trading. (Data as of April 21, 2020)

The chart below highlights previous well-defined chart patterns and the breakout signals. It is a good case study to go through what I usually look for on price charts.

  • A bullish chart pattern should complete above the 200-day moving average. Likewise a bearish chart pattern should complete below the 200-day moving average. I use 200-day average as a trend filter.
  • Preferably a well-defined chart pattern should have horizontal boundary and the breakout should take place through the horizontal boundary.
  • Before the breakout takes place, the horizontal boundary should be tested several times. Several tests of chart pattern boundary suggests that the technical level is recognized by market participants.
  • Breakout should be taking place from a low volatility condition. Volatility is cyclical. Low volatility is followed by high volatility and vice versa. A low volatility condition presents itself in one of the well-defined classical chart patterns.


Tech Charts Membership

By becoming a Premium Member, you’ll be able to improve your knowledge of the principles of classical charting.

With this knowledge, you can merge them with your investing system. In fact, some investors use my analyses to modify their existing style to invest more efficiently and successfully.

Get Access Now

As a Premium Member of Aksel Kibar’s Tech Charts,

You will receive:

  • Global Equities Report. Delivered weekly.
  • Classical charting principles. Learn patterns and setups.
  • Actionable information. Worldwide indices and stocks of interest.
  • Risk management advice. The important trading points of each chart.
  • Information on breakout opportunities. Identify the ones you want to take action on.
  • Video tutorials. How patterns form and why they succeed or fail.
  • Watch list alerts. As they become available so you can act quickly.
  • Breakout alerts. Usually once a week.
  • Access to everything (now and as it becomes available)
    o Reports
    o Videos and video series
  • Multi-part webinar course. You learn the 8 most common charting principles.
  • Webinars. Actionable and timely advice on breaking out chart patterns.

For your convenience your membership auto renews each year.

Get Access Now

RECTANGLE BULLISH CONTINUATION

Every week Tech Charts Global Equity Markets report features some of the well-defined, mature classical chart patterns under a lengthy watchlist and the chart pattern breakout signals that took place during that week. Global Equity Markets report covers single stocks from developed, emerging and frontier markets, ETF’s and global equity indices. The report starts with a review section that highlights the important chart developments on global equity benchmarks. This blog post features from the watchlist section a rectangle chart pattern that is listed on U.S. Exchange.

MOLINA HEALTHCARE INC (MOH)

Molina Healthcare, Inc. offers Medicaid-related solutions for low-income families and individuals, and assists government agencies in their administration of the Medicaid program. The stock is listed on the New York Stock Exchange. Price chart formed a 17 month-long rectangle with the horizontal boundary acting as strong resistance at 154.00 levels. The horizontal boundary was tested several times over the course of the chart pattern. The daily close above 158.60 levels confirmed the breakout from the 17 month-long rectangle with the possible chart pattern price target of 203.00 levels. Please note that this is a weekly scale price chart and the last weekly candle includes two days of trading. (Data as of Apr 14, 2020)


Tech Charts Membership

By becoming a Premium Member, you’ll be able to improve your knowledge of the principles of classical charting.

With this knowledge, you can merge them with your investing system. In fact, some investors use my analyses to modify their existing style to invest more efficiently and successfully.

Get Access Now

As a Premium Member of Aksel Kibar’s Tech Charts,

You will receive:

  • Global Equities Report. Delivered weekly.
  • Classical charting principles. Learn patterns and setups.
  • Actionable information. Worldwide indices and stocks of interest.
  • Risk management advice. The important trading points of each chart.
  • Information on breakout opportunities. Identify the ones you want to take action on.
  • Video tutorials. How patterns form and why they succeed or fail.
  • Watch list alerts. As they become available so you can act quickly.
  • Breakout alerts. Usually once a week.
  • Access to everything (now and as it becomes available)
    o Reports
    o Videos and video series
  • Multi-part webinar course. You learn the 8 most common charting principles.
  • Webinars. Actionable and timely advice on breaking out chart patterns.

For your convenience your membership auto renews each year.

Get Access Now

BULLISH FLAG ON MERCK KGAA

Every week Tech Charts Global Equity Markets report features some of the well-defined, mature classical chart patterns under a lengthy watchlist and the chart pattern breakout signals that took place during that week. Global Equity Markets report covers single stocks from developed, emerging and frontier markets, ETF’s and global equity indices. The report starts with a review section that highlights the important chart developments on global equity benchmarks. This blog post features from the watchlist section a bullish flag chart pattern that is listed on Frankfurt Stock Exchange. The short-term bullish consolidation can be utilized for trading opportunity. A link is provided here to learn more about Flag as a measuring pattern.

MERCK KGAA (MRCG.DE)

Merck KGaA is a Germany-based science and technology company. The Company operates in three business segments: Healthcare, Life Sciences and Performance Materials. The stock is listed on the Frankfurt Stock Exchange. Price chart formed a multi year-long consolidation range with lower boundary acting as strong support at 76.20 levels. The stock rebounded from the support.  Over the past few days MERCK formed a tight consolidation which can be identified as a bullish flag (shown on the daily scale price chart). The upper boundary is at 94 levels. A daily close above 96.8 levels can confirm the short-term bullish continuation with the possible chart pattern price target at 110.4 levels. (Learn more: Flag as a measuring pattern) (Data as of April 6, 2020)


Tech Charts Membership

By becoming a Premium Member, you’ll be able to improve your knowledge of the principles of classical charting.

With this knowledge, you can merge them with your investing system. In fact, some investors use my analyses to modify their existing style to invest more efficiently and successfully.

Get Access Now

As a Premium Member of Aksel Kibar’s Tech Charts,

You will receive:

  • Global Equities Report. Delivered weekly.
  • Classical charting principles. Learn patterns and setups.
  • Actionable information. Worldwide indices and stocks of interest.
  • Risk management advice. The important trading points of each chart.
  • Information on breakout opportunities. Identify the ones you want to take action on.
  • Video tutorials. How patterns form and why they succeed or fail.
  • Watch list alerts. As they become available so you can act quickly.
  • Breakout alerts. Usually once a week.
  • Access to everything (now and as it becomes available)
    o Reports
    o Videos and video series
  • Multi-part webinar course. You learn the 8 most common charting principles.
  • Webinars. Actionable and timely advice on breaking out chart patterns.

For your convenience your membership auto renews each year.

Get Access Now

SUPPORT & RESISTANCE

Every week Tech Charts Global Equity Markets report features some of the well-defined, mature classical chart patterns under a lengthy watchlist and the chart pattern breakout signals that took place during that week. Global Equity Markets report covers single stocks from developed, emerging and frontier markets, ETF’s and global equity indices. The report starts with a review section that highlights the important chart developments on global equity benchmarks. This blog post features from the watchlist section a rectangle chart pattern that is listed on U.S. Exchange. The well-defined range can be utilized for trading opportunity between the boundaries until price experiences a confirmed breakout/breakdown. A link is provided here to learn more about Support and Resistances.

KULICKE AND SOFFA INDUSTRIES INC (KLIC.O)

Kulicke and Soffa Industries, Inc. designs, manufactures and sells capital equipment and expendable tools used to assemble semiconductor devices, including integrated circuits (ICs), high and low powered discrete devices, light-emitting diodes (LEDs) and power modules. The stock is listed on the Nasdaq Stock Exchange. Price chart formed a 2 year-long rectangle with the horizontal boundaries acting as strong support at 18.15 levels and resistance at 28.6 levels. Both boundaries were tested several times over the course of the chart pattern. A daily close below 17.6 levels will confirm the breakdown from the 2 year-long rectangle with the possible chart pattern price target of 11.6 levels. Until a breakdown takes place the stock can offer a trading opportunity between the wide range 18.15-28.6. A re-test of the previous low and the support area can form a short-term reversal chart pattern. The daily chart is added below. (Data as of March 27, 2020)


Tech Charts Membership

By becoming a Premium Member, you’ll be able to improve your knowledge of the principles of classical charting.

With this knowledge, you can merge them with your investing system. In fact, some investors use my analyses to modify their existing style to invest more efficiently and successfully.

Get Access Now

As a Premium Member of Aksel Kibar’s Tech Charts,

You will receive:

  • Global Equities Report. Delivered weekly.
  • Classical charting principles. Learn patterns and setups.
  • Actionable information. Worldwide indices and stocks of interest.
  • Risk management advice. The important trading points of each chart.
  • Information on breakout opportunities. Identify the ones you want to take action on.
  • Video tutorials. How patterns form and why they succeed or fail.
  • Watch list alerts. As they become available so you can act quickly.
  • Breakout alerts. Usually once a week.
  • Access to everything (now and as it becomes available)
    o Reports
    o Videos and video series
  • Multi-part webinar course. You learn the 8 most common charting principles.
  • Webinars. Actionable and timely advice on breaking out chart patterns.

For your convenience your membership auto renews each year.

Get Access Now

S&P 500 INDEX AND U.S. UNEMPLOYMENT RATE (%)

Every week Tech Charts Global Equity Markets report features some of the well-defined, mature classical chart patterns under a lengthy watchlist and the chart pattern breakout signals that took place during that week. Global Equity Markets report covers single stocks from developed, emerging and frontier markets, ETF’s and global equity indices. The report starts with a review section that highlights the important chart developments on global equity benchmarks. This blog post features from the review section the S&P 500 Index and U.S. Unemployment Rate %.

Global economies are going through difficult times. Below I discuss a possibility. In 2011, I wrote a blog post when Global equities were recovering from the 2007-2008 financial melt-down. I analyzed the Unemployment rate with the S&P 500 Index. You can read the blog post here U.S. Unemployment Rate (%) 2011 Blog Post. Since 2011, the unemployment rate remained in a steady downtrend and reached significantly low levels. We are now seeing discussions about Global recession. I refer to my charts to understand the possibility of it taking place in current environment.

The recent sell-off on S&P 500 Index found support at 2018 minor lows (2,460). I’m weighing the possibility of a multi-month long H&S top. If such scenario taking place we are likely to spend the rest of 2020 by forming the right shoulder of the multi-month long top reversal. Stock market is always regarded as a leading indicator for economic activity. When we put the two charts together, the U.S. unemployment rate and the S&P 500 Index, a top reversal would coincide with a bottom on unemployment rate. Please note that these are monthly scale price charts and it can take several months for reversals to take place. And also please note that this is not a forecast. I view this as a possibility. As I get new evidence, I will update these charts.


Tech Charts Membership

By becoming a Premium Member, you’ll be able to improve your knowledge of the principles of classical charting.

With this knowledge, you can merge them with your investing system. In fact, some investors use my analyses to modify their existing style to invest more efficiently and successfully.

Get Access Now

As a Premium Member of Aksel Kibar’s Tech Charts,

You will receive:

  • Global Equities Report. Delivered weekly.
  • Classical charting principles. Learn patterns and setups.
  • Actionable information. Worldwide indices and stocks of interest.
  • Risk management advice. The important trading points of each chart.
  • Information on breakout opportunities. Identify the ones you want to take action on.
  • Video tutorials. How patterns form and why they succeed or fail.
  • Watch list alerts. As they become available so you can act quickly.
  • Breakout alerts. Usually once a week.
  • Access to everything (now and as it becomes available)
    o Reports
    o Videos and video series
  • Multi-part webinar course. You learn the 8 most common charting principles.
  • Webinars. Actionable and timely advice on breaking out chart patterns.

For your convenience your membership auto renews each year.

Get Access Now