“Demystifying the world of Classical Charting”
– AKSEL KIBAR

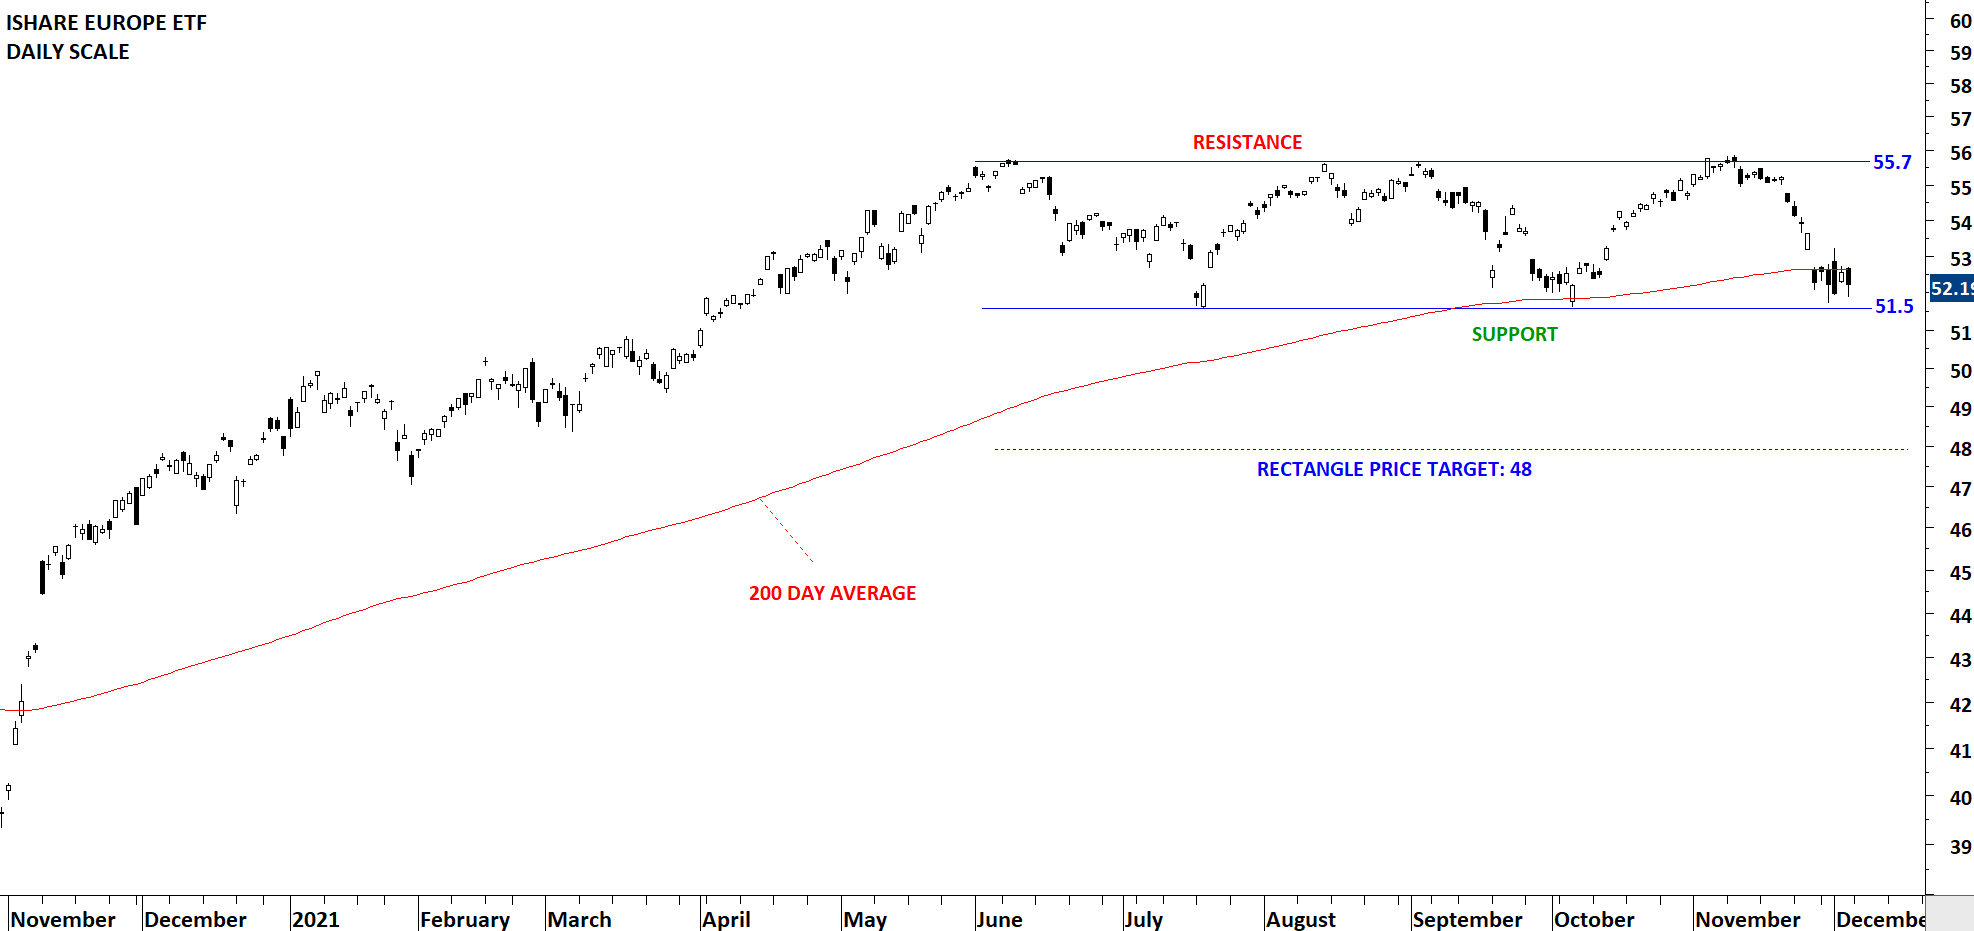
Every week Tech Charts Global Equity Markets report features some of the well-defined, mature classical chart patterns under a lengthy watchlist and the chart pattern breakout signals that took place during that week. Global Equity Markets report covers single stocks from developed, emerging and frontier markets, ETF’s, select commodities, cryptocurrencies and global equity indices. Below charts are from the review section of the weekly report. It is featuring IEV and EFA ETFs listed on the New York Stock Exchange. If you are trading range bound price action between well-defined boundaries, these opportunities might be valuable. I see both charts at inflection points. A rebound from the lower boundaries can put these ETFs back into positive territory. A breakdown will act as bearish reversal.
ISHARE EUROPE ETF (IEV) formed 6 month-long rectangle with the lower boundary acting as support at 51.5 and the upper boundary as resistance at 55.7 levels. Breakdown below the lower boundary can confirm the rectangle as a top reversal with the possible price target of 48 levels.
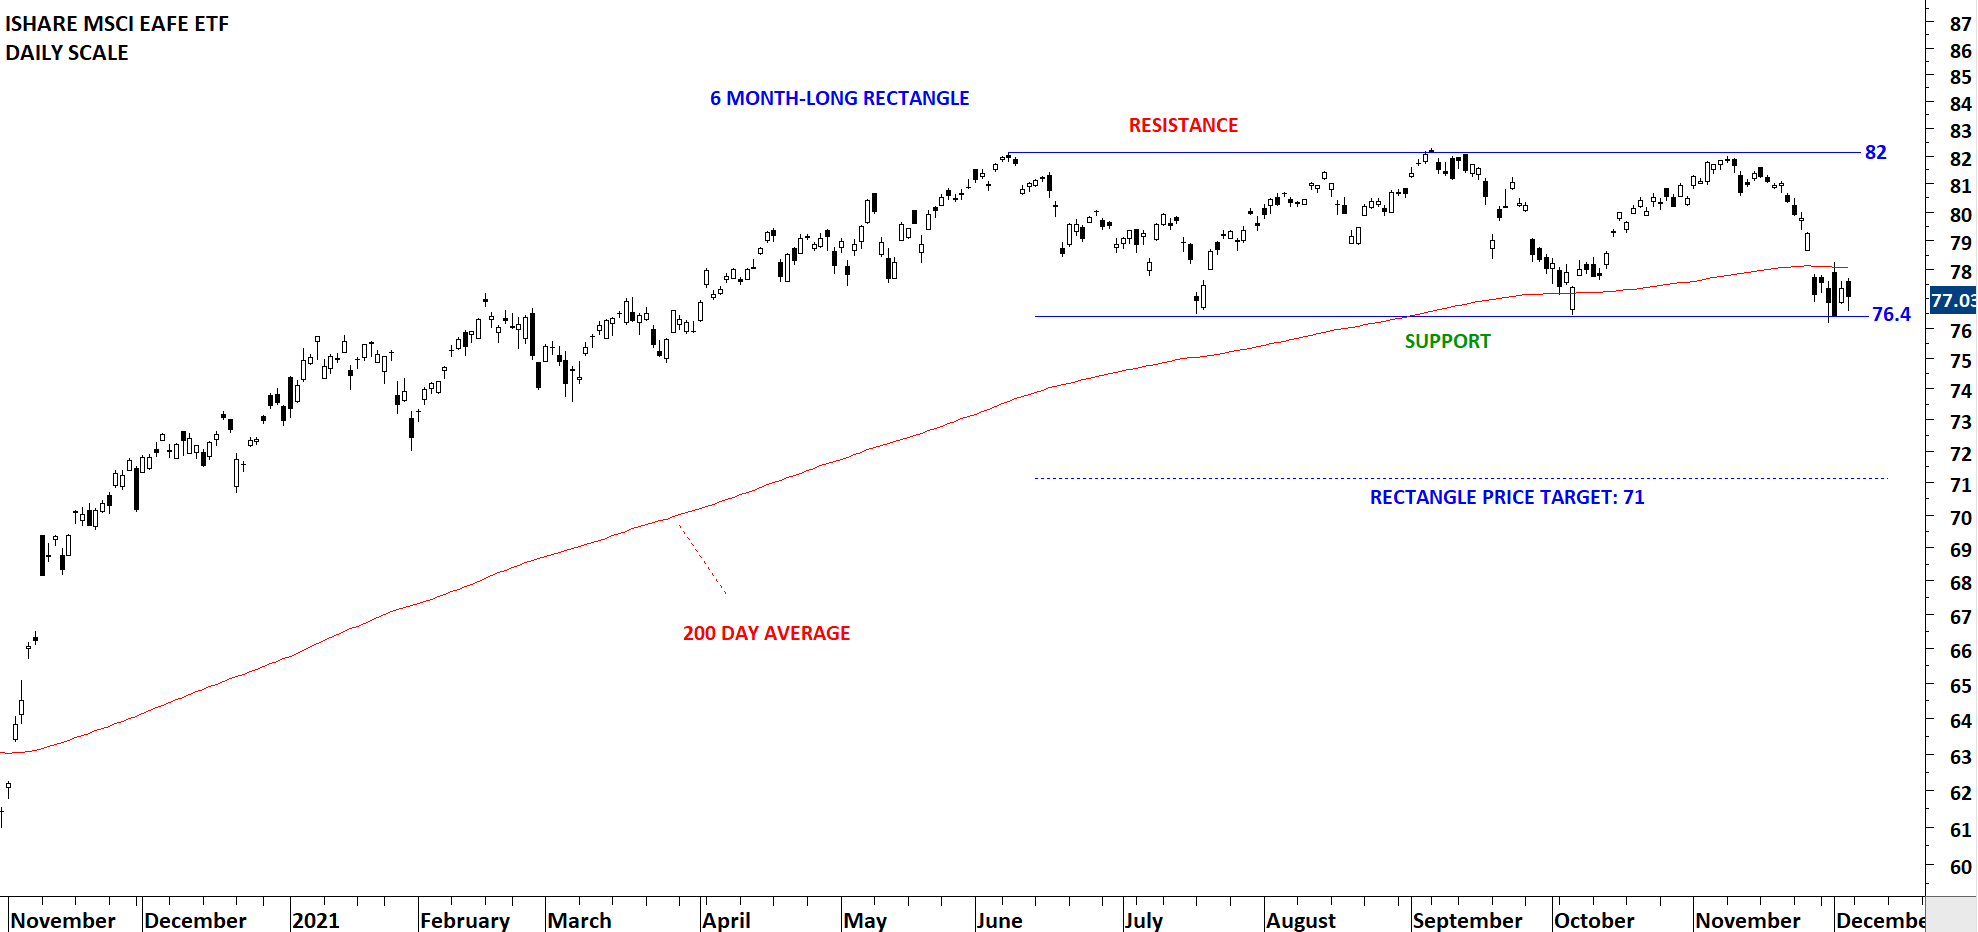
ISHARE MSCI EAFE ETF (EFA) formed a 6 month-long rectangle with the upper boundary acting as resistance at 82 and the lower boundary as support at 76.4 levels. Price is consolidating right below the 200-day average. Breakdown below the horizontal support can result in a top reversal with the price target at 71 levels.
Here is a breakdown of the ISHARES MSCI EAFE ETF for those of you who are not familiar with MSCI benchmarked funds.
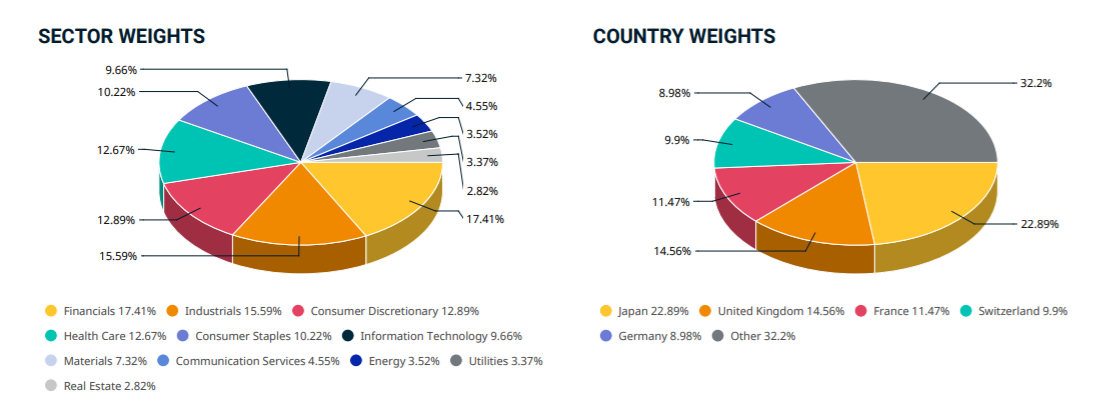 Data as of Oct 29, 2021. Source: msci.com

By becoming a Premium Member, you’ll be able to improve your knowledge of the principles of classical charting.
With this knowledge, you can merge them with your investing system. In fact, some investors use my analyses to modify their existing style to invest more efficiently and successfully.
You will receive:
For your convenience your membership auto renews each year.

Every week Tech Charts Global Equity Markets report features some of the well-defined, mature classical chart patterns under a lengthy watchlist and the chart pattern breakout signals that took place during that week. Global Equity Markets report covers single stocks from developed, emerging and frontier markets, ETF’s, select commodities, cryptocurrencies and global equity indices. Below chart is from the review section of the weekly report. It is featuring SILVER prices on different time frames.
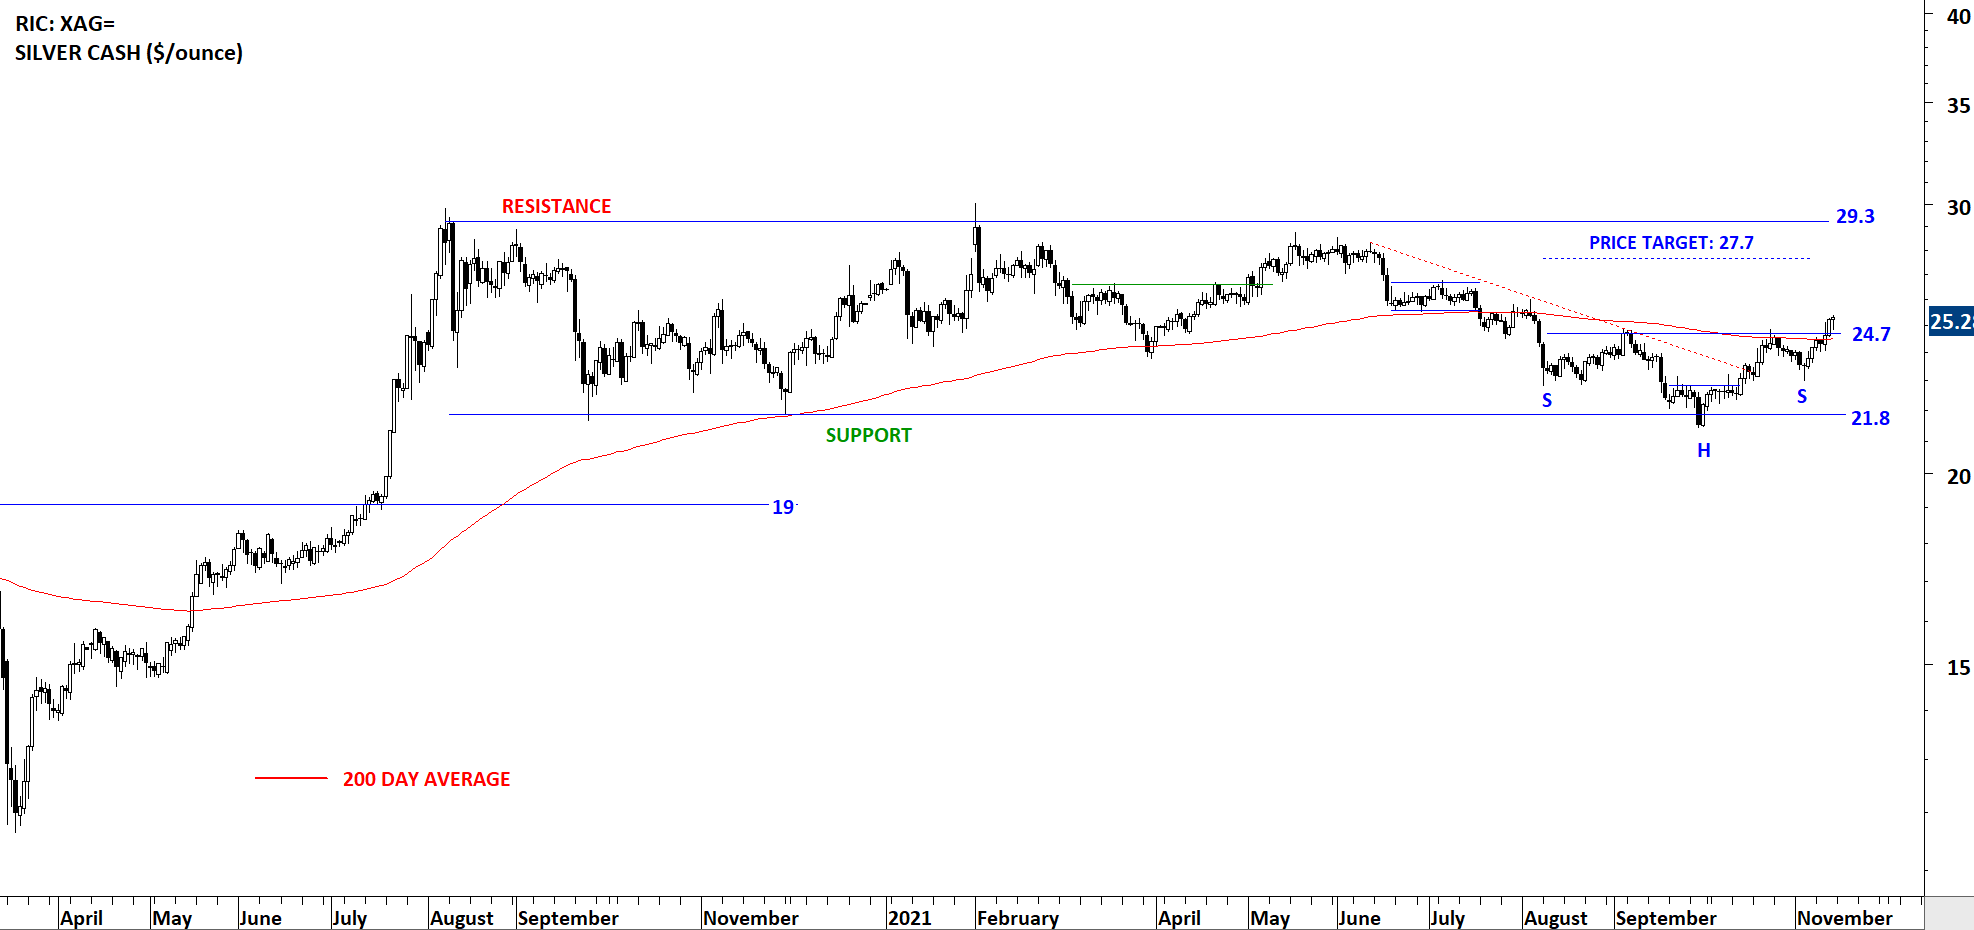
Silver remains range bound between 21.8 and 30 levels. A great text-book opportunity might be developing as price pulled back for couple of weeks to form the right shoulder of a possible H&S bottom. Breakout above the 200-day average changed the outlook to positive. A possible H&S bottom reversal might be completing (as can be seen on daily scale) with the neckline at 24.7 levels. Price target for the H&S bottom reversal stands at 27.7 levels.
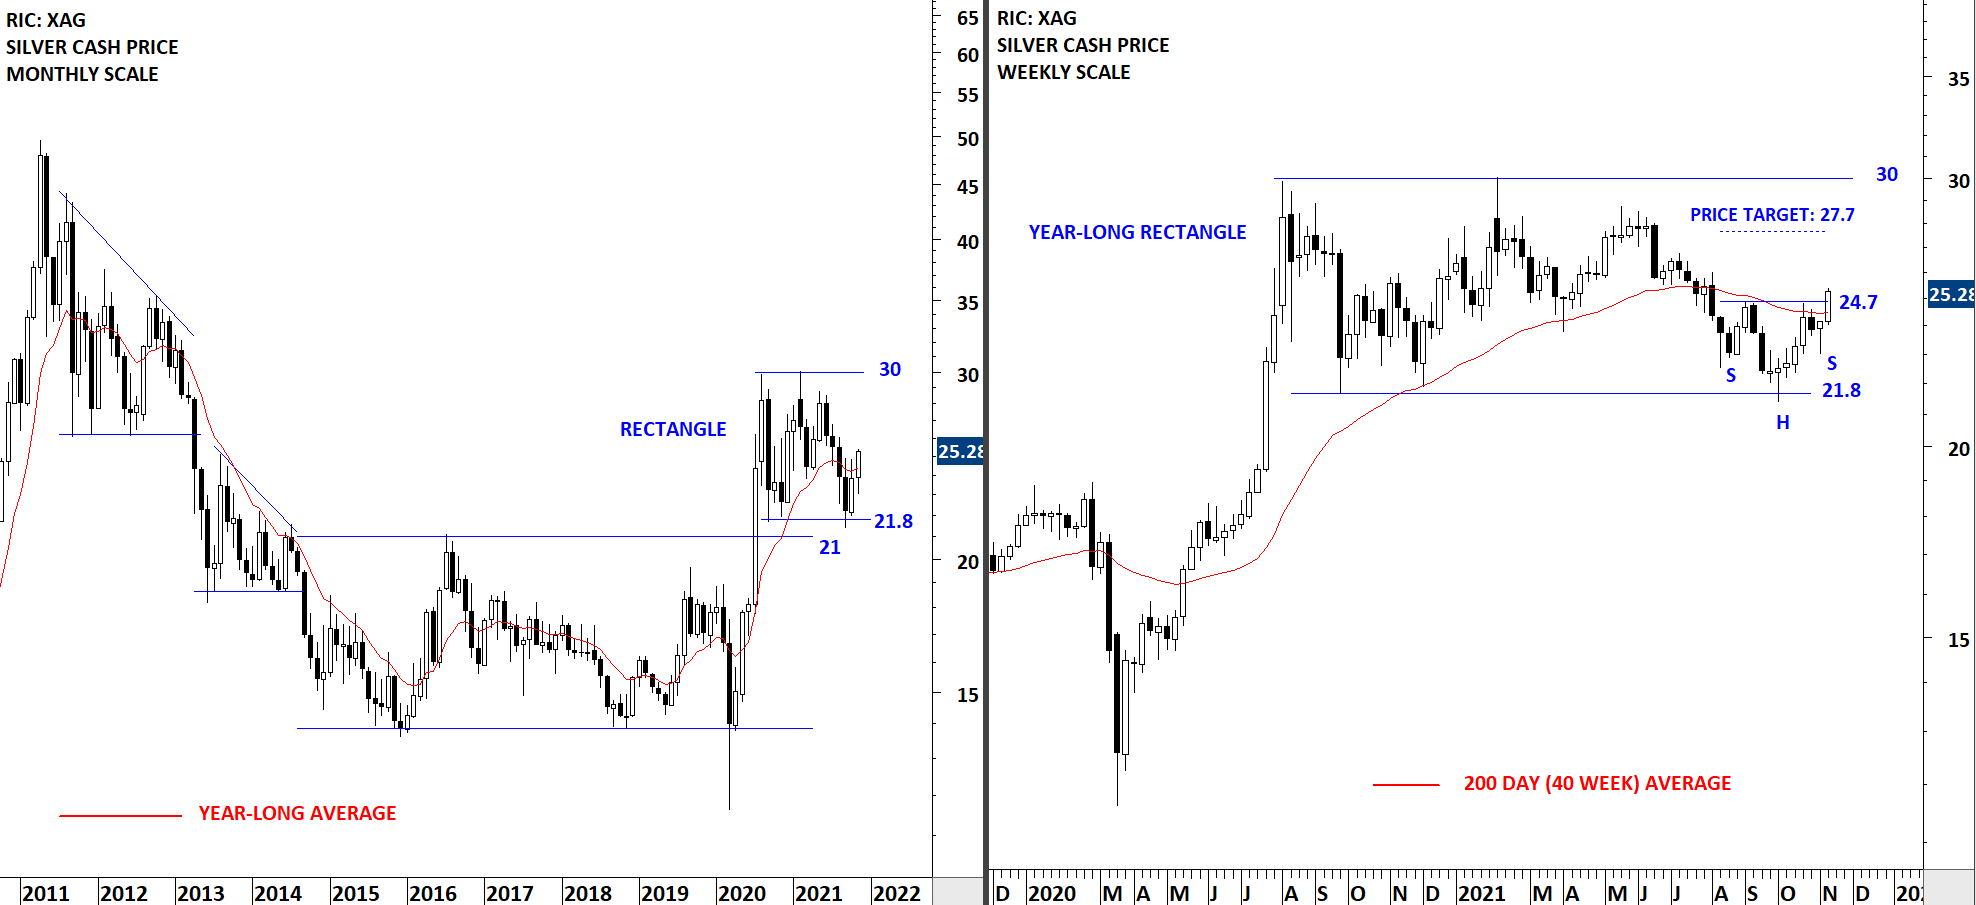
The daily scale price chart of Silver shows much better the developing possible H&S bottom with the neckline that was acting as resistance at 24.7 levels. This was also the 200-day average. Breakout cleared both technical hurdles and now suggests higher prices. Price objective for the H&S bottom stands at 27.7 levels. The low of the right shoulder at 23 levels will act as the chart pattern negation level for the H&S bottom reversal.
By becoming a Premium Member, you’ll be able to improve your knowledge of the principles of classical charting.
With this knowledge, you can merge them with your investing system. In fact, some investors use my analyses to modify their existing style to invest more efficiently and successfully.
You will receive:
For your convenience your membership auto renews each year.
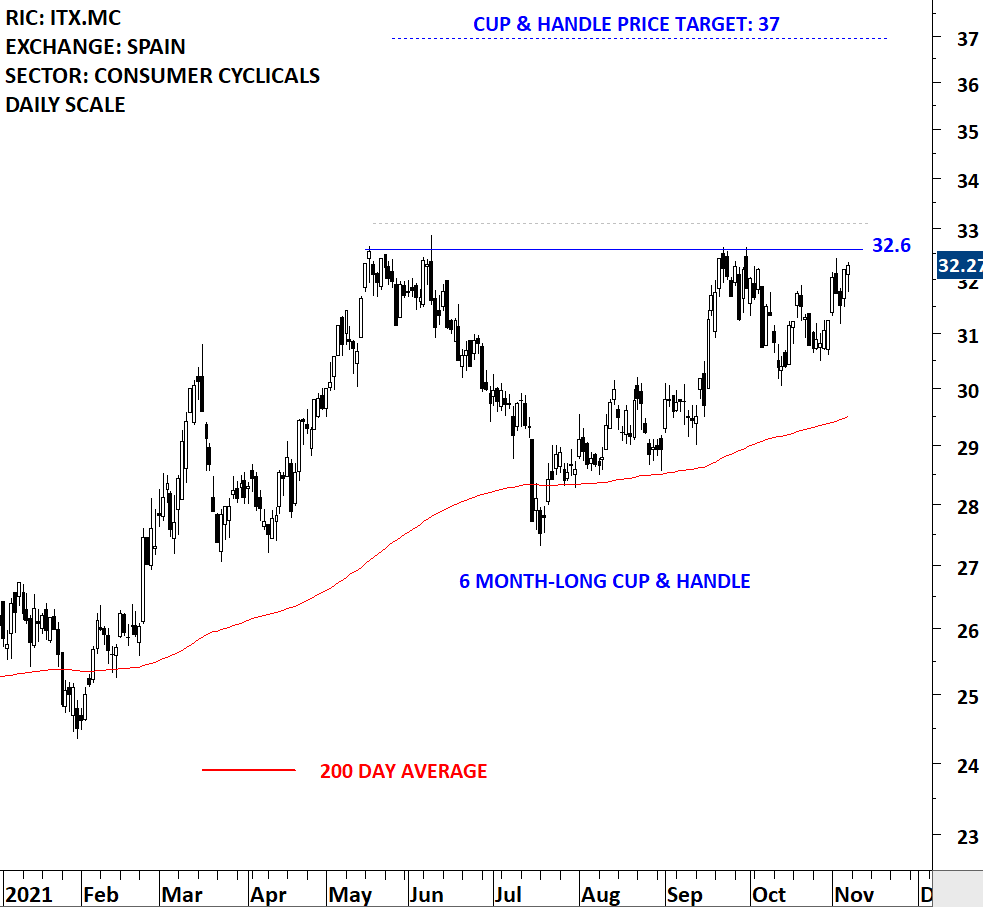
Every week Tech Charts Global Equity Markets report features some of the well-defined, mature classical chart patterns under a lengthy watchlist and the chart pattern breakout signals that took place during that week. Global Equity Markets report covers single stocks from developed, emerging and frontier markets, ETF’s, select commodities, cryptocurrencies and global equity indices. Below chart is from the watchlist section of the weekly report. It is featuring INDUSTRIA DE DISENO TEXTIL SA (ITX.MC) listed on the Spanish Stock Exchange.
Industria de Diseno Textil SA, known as Inditex SA, is a Spain-based company primarily engaged in the textile industry. The Company’s activities include the design, confection, manufacturing, distribution and retail of men, women and children apparel, footwear and fashion accessories, as well as home furnishings and household textile products. The stock is listed on the Spain Stock Exchange. Price chart formed a 6 month-long cup & handle continuation with the horizontal boundary acting as strong resistance at 32.60 levels. The horizontal boundary was tested several times over the course of the chart pattern. A daily close above 33.10 levels will confirm the breakout from the 6 month-long cup & handle continuation with the possible chart pattern price target of 37.00 levels.
By becoming a Premium Member, you’ll be able to improve your knowledge of the principles of classical charting.
With this knowledge, you can merge them with your investing system. In fact, some investors use my analyses to modify their existing style to invest more efficiently and successfully.
You will receive:
For your convenience your membership auto renews each year.

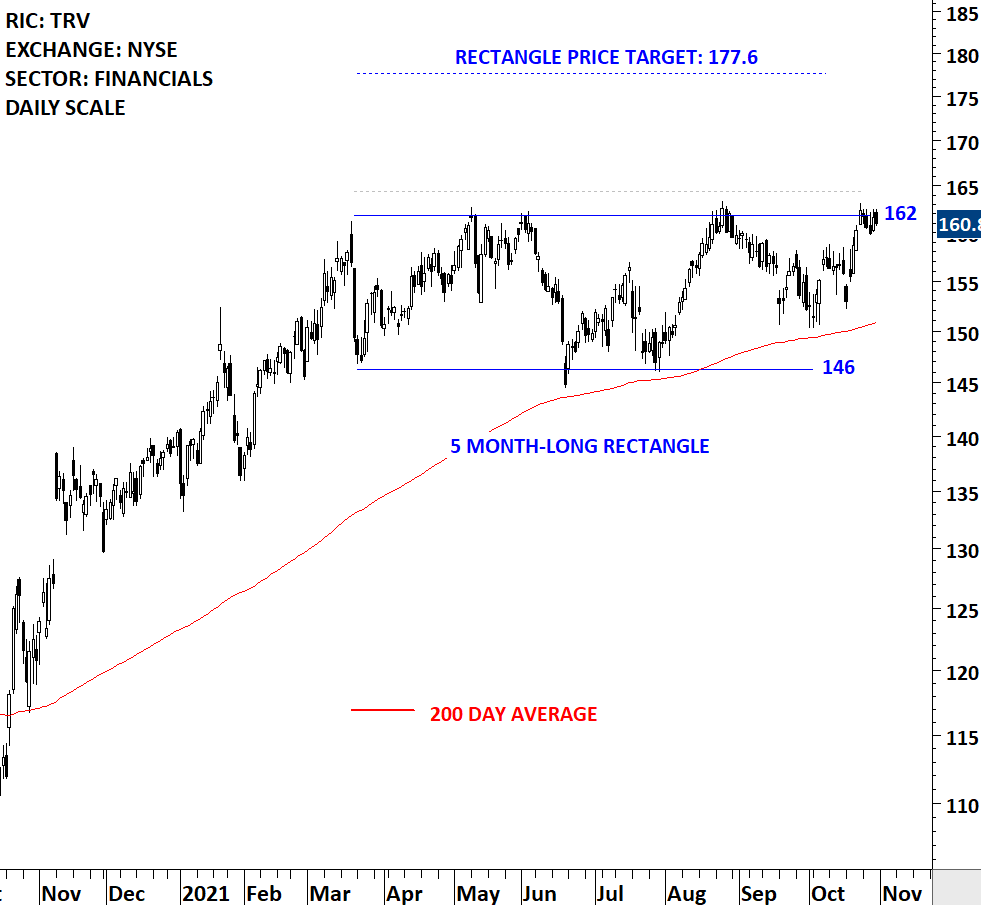
Every week Tech Charts Global Equity Markets report features some of the well-defined, mature classical chart patterns under a lengthy watchlist and the chart pattern breakout signals that took place during that week. Global Equity Markets report covers single stocks from developed, emerging and frontier markets, ETF’s, select commodities, cryptocurrencies and global equity indices. Below chart is from the watchlist section of the weekly report. It is featuring TRAVELERS COMPANIES INC (TRV) listed on the New York Stock Exchange.
The Travelers Companies, Inc. is a holding company principally engaged, through its subsidiaries, in providing a range of commercial and personal property and casualty insurance products and services to businesses, government units, associations and individuals. The stock is listed on the New York Stock Exchange. Price chart formed a 5 month-long rectangle with the horizontal boundary acting as strong resistance at 162.00 levels. The horizontal boundary was tested several times over the course of the chart pattern. A daily close above 164.40 levels will confirm the breakout from the 5 month-long rectangle with the possible chart pattern price target of 177.60 levels.
By becoming a Premium Member, you’ll be able to improve your knowledge of the principles of classical charting.
With this knowledge, you can merge them with your investing system. In fact, some investors use my analyses to modify their existing style to invest more efficiently and successfully.
You will receive:
For your convenience your membership auto renews each year.
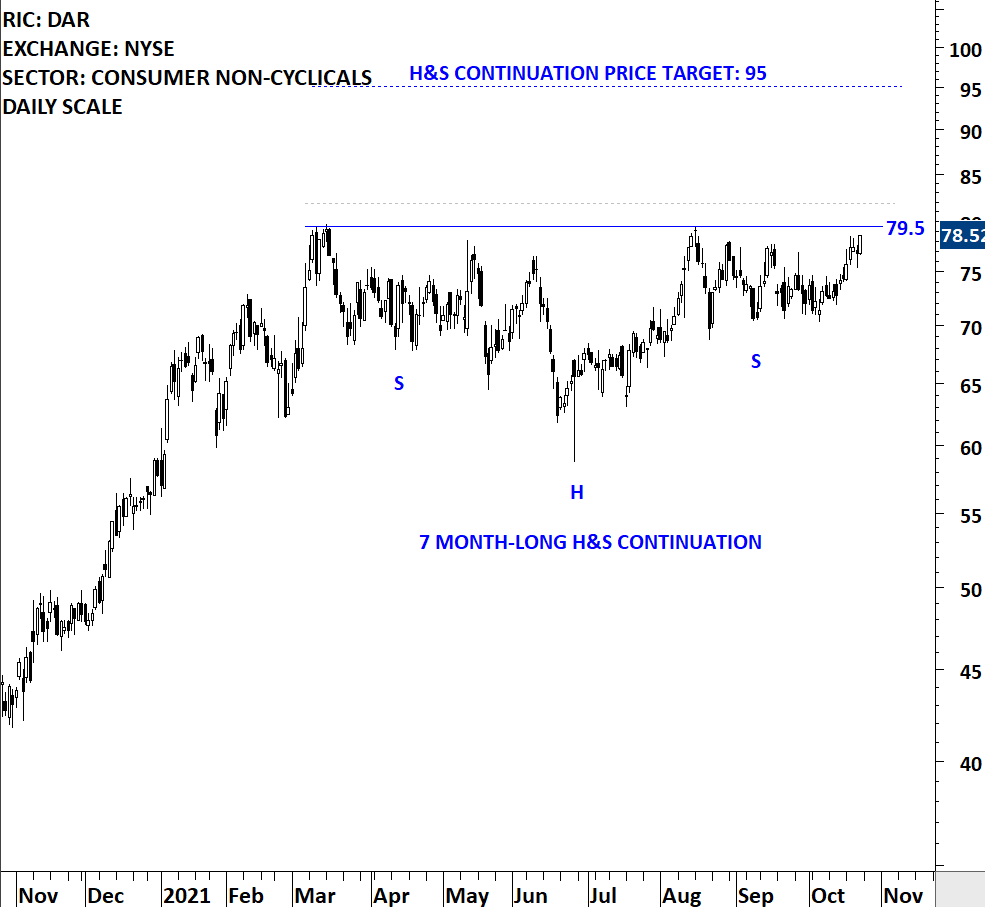
Every week Tech Charts Global Equity Markets report features some of the well-defined, mature classical chart patterns under a lengthy watchlist and the chart pattern breakout signals that took place during that week. Global Equity Markets report covers single stocks from developed, emerging and frontier markets, ETF’s, select commodities, cryptocurrencies and global equity indices. Below chart is from the watchlist section of the weekly report. It is featuring Darling Ingredients Inc. listed on the New York Stock Exchange.
Darling Ingredients Inc. is a developer & producer of sustainable natural ingredients from edible and inedible bio-nutrients, creating ingredients and customized specialty solutions for customers in the food, pet food, feed, fuel, bioenergy, and fertilizer industries. The stock is listed on the New York Stock Exchange. Price chart formed a 7 month-long head and shoulder continuation with the horizontal boundary acting as strong resistance at 79.50 levels. The horizontal boundary was tested several times over the course of the chart pattern. A daily close above 81.80 levels will confirm the breakout from the 7 month-long head and shoulder continuation with the possible chart pattern price target of 95.00 levels.
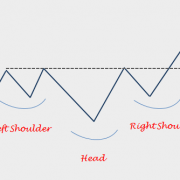
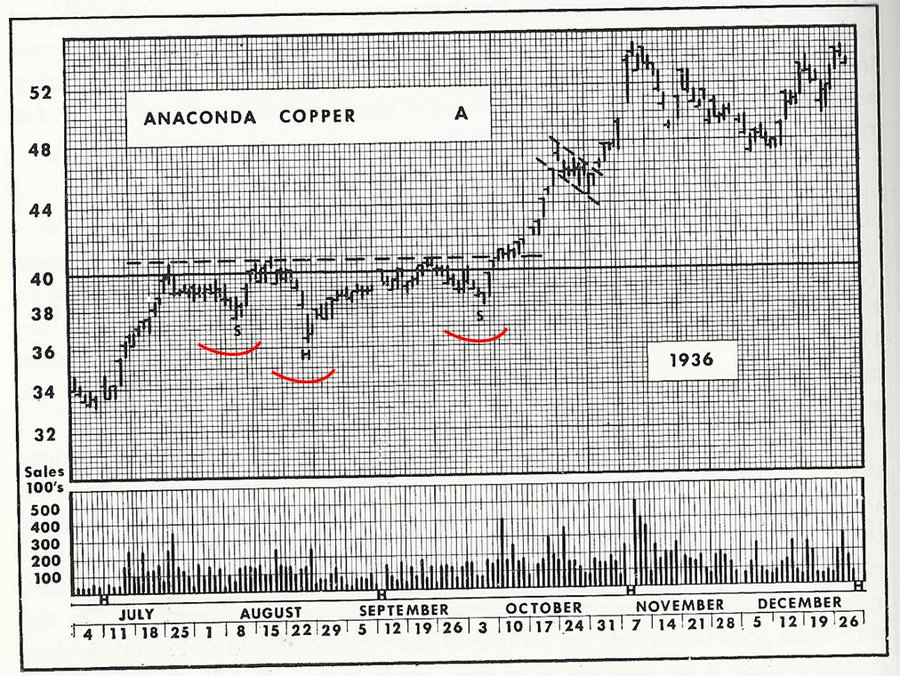
A common discussion is on the validity of H&S acting as a continuation chart pattern. It is widely believed that H&S can only form as a reversal chart pattern. Edwards & Magee in their book Technical Analysis of Stock Trends, discussed the continuation type with the below chart example from 1930s. I’ve come across and featured several examples of H&S continuation in the past reports. In fact the statistics on H&S continuation is solid.
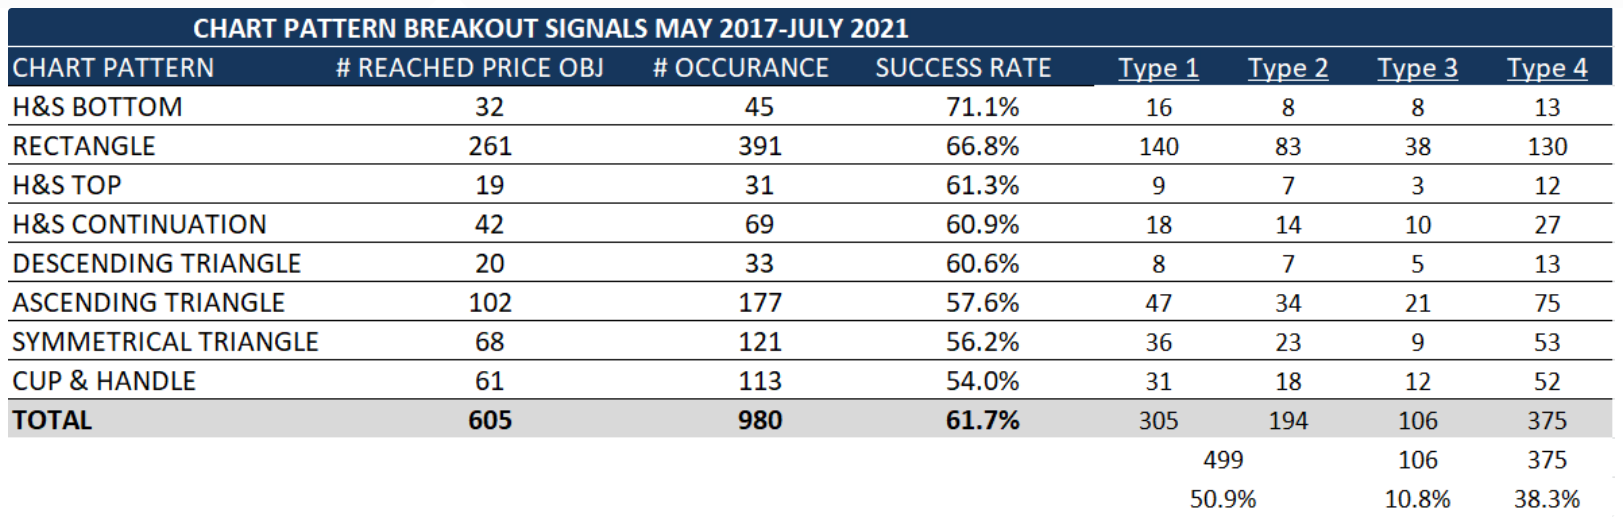
Below is the table showing chart pattern statistics for H&S continuation. These numbers cover the period of May 2017 till July 2021. H&S types with my favorite chart pattern rectangle are in the top 4 reliable chart patterns.
By becoming a Premium Member, you’ll be able to improve your knowledge of the principles of classical charting.
With this knowledge, you can merge them with your investing system. In fact, some investors use my analyses to modify their existing style to invest more efficiently and successfully.
You will receive:
For your convenience your membership auto renews each year.

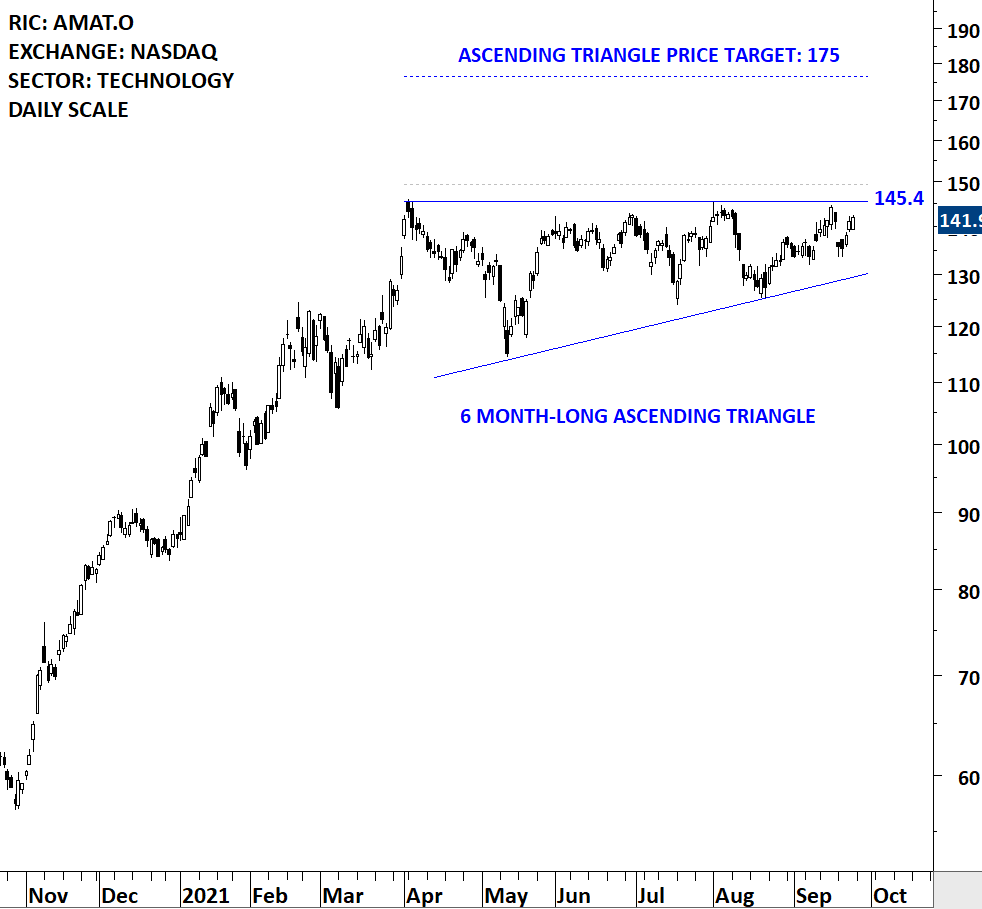
Every week Tech Charts Global Equity Markets report features some of the well-defined, mature classical chart patterns under a lengthy watchlist and the chart pattern breakout signals that took place during that week. Global Equity Markets report covers single stocks from developed, emerging and frontier markets, ETF’s, select commodities, cryptocurrencies and global equity indices. Below chart is from the watchlist section of the weekly report. It is featuring Applied Materials Inc. listed on the Nasdaq Stock Exchange.
Applied Materials, Inc. provides manufacturing equipment, services and software to the global semiconductor, display and related industries. The stock is listed on the Nasdaq Stock Exchange. Price chart formed a 6 month-long ascending triangle with the horizontal boundary acting as strong resistance at 145.40 levels. The horizontal boundary was tested several times over the course of the chart pattern. A daily close above 149.50 levels will confirm the breakout from the 6 month-long ascending triangle with the possible chart pattern price target of 175.00 levels. Breakout can push the stock to all-time highs.
By becoming a Premium Member, you’ll be able to improve your knowledge of the principles of classical charting.
With this knowledge, you can merge them with your investing system. In fact, some investors use my analyses to modify their existing style to invest more efficiently and successfully.
You will receive:
For your convenience your membership auto renews each year.

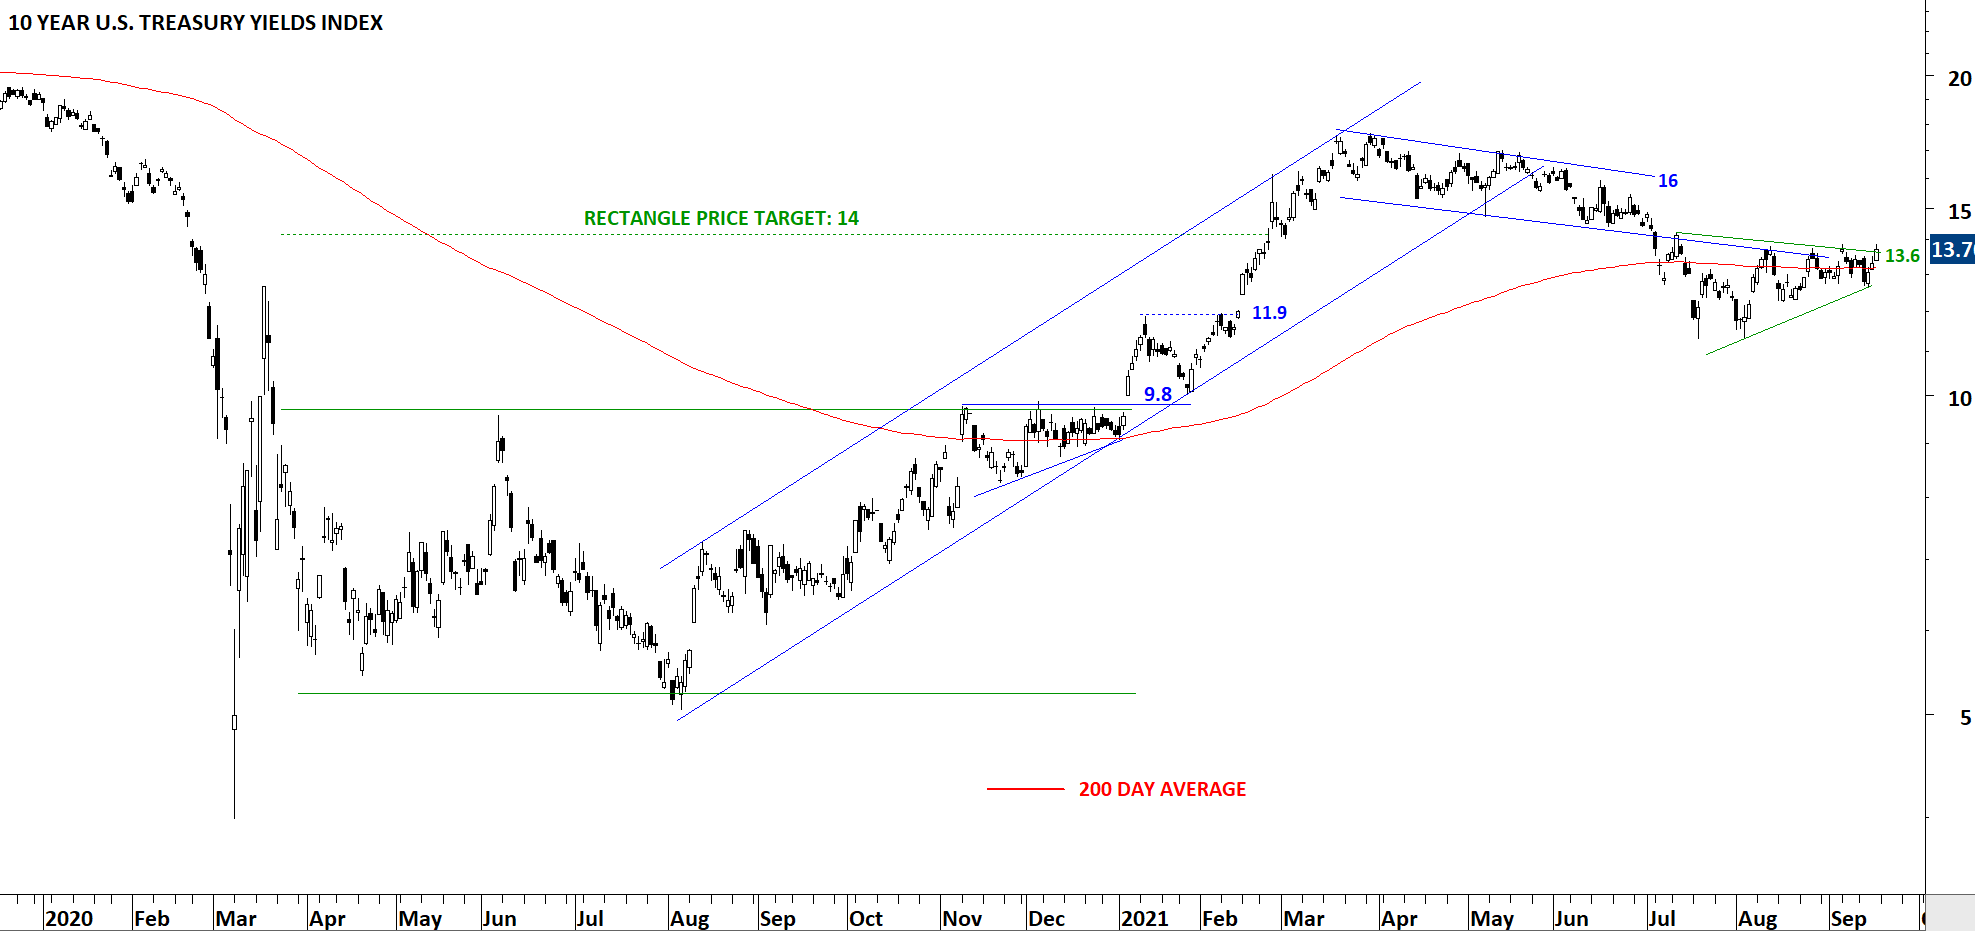
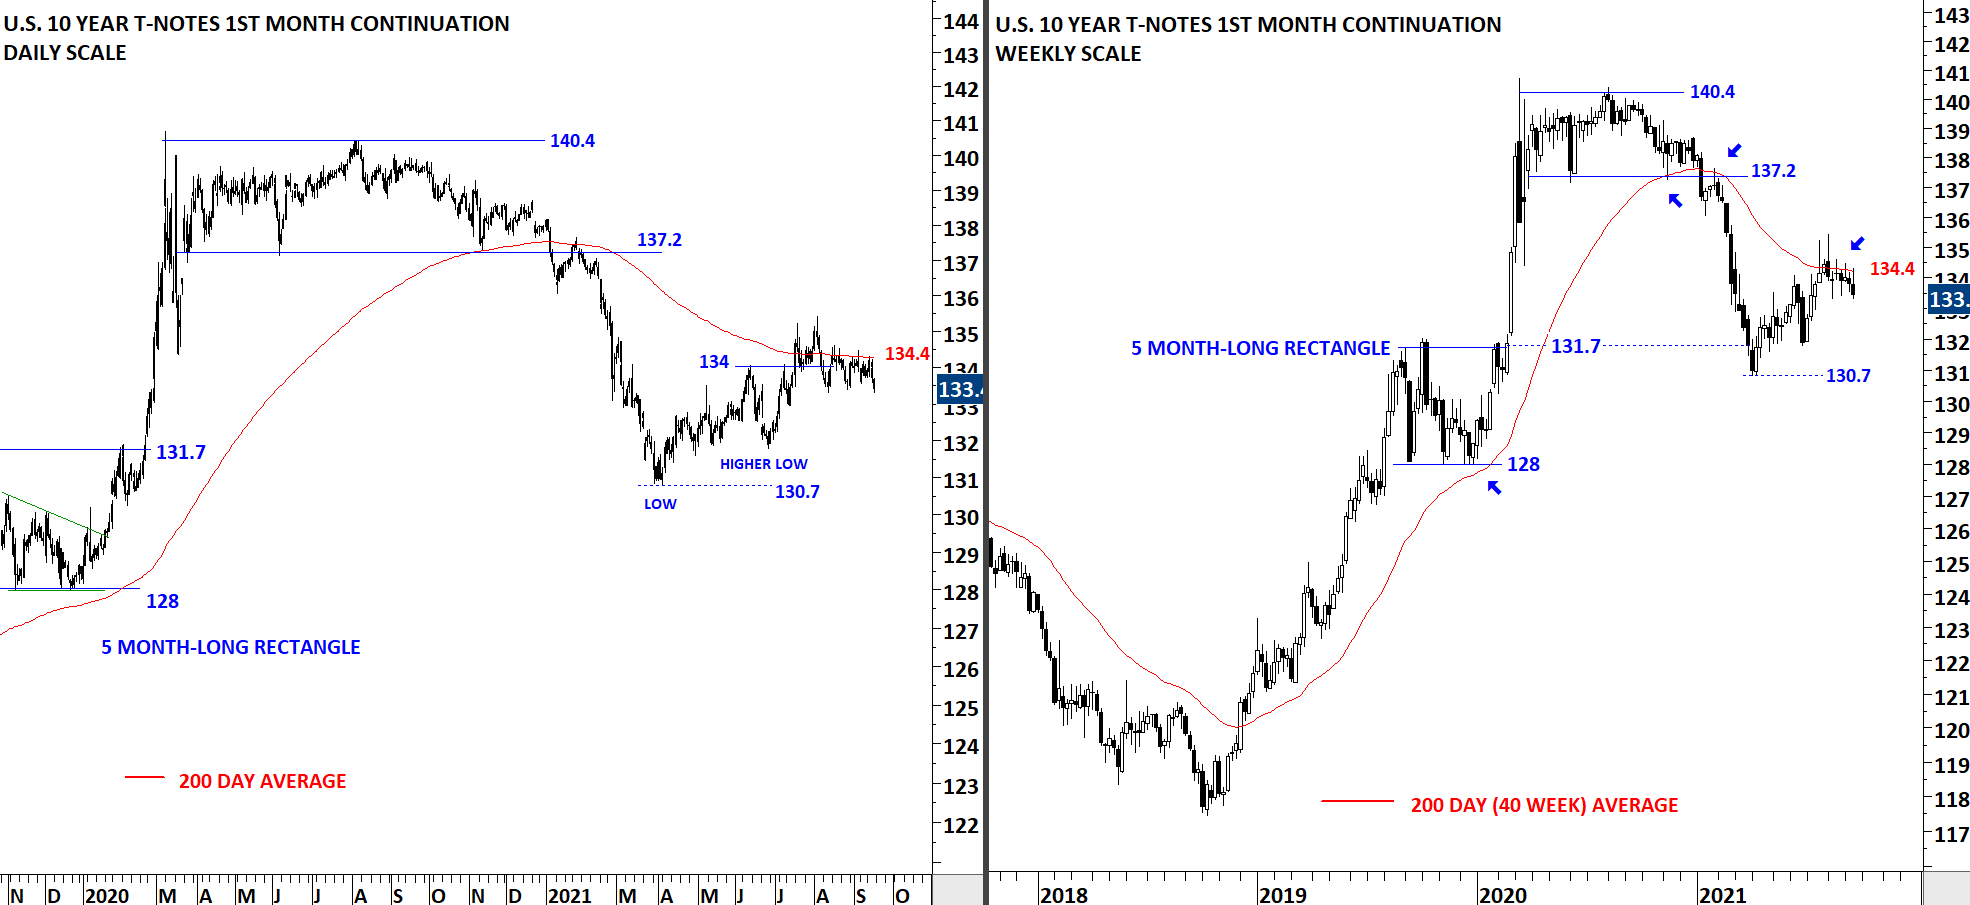
Every week Tech Charts Global Equity Markets report features some of the well-defined, mature classical chart patterns under a lengthy watchlist and the chart pattern breakout signals that took place during that week. Global Equity Markets report covers single stocks from developed, emerging and frontier markets, ETF’s, select commodities, cryptocurrencies and global equity indices. Below charts discuss U.S. 10 Year Treasury Yields and Bonds from the review section of the weekly report.
The chart below is the 10 Year U.S. Treasury Yield Index. The index is looking for a direction after a strong run. Price pulled back to the 200-day average. A recovery above 13.2-13.6 area can put the yields back in an uptrend. Failure to recover above 13.2-13.6 area can result in a correction towards 10 levels. Volatility is at an extreme low and this suggests a trend period soon.
The U.S. 10 Year T-Note is trading around its 200-day average. Latest consolidation below the 200-day average at 134.4 levels and the minor high at 134 levels will be important levels to monitor for trend change. I will monitor this chart for stability above the 200-day average to conclude for a trend change. Failure to recover above the 200-day average can result in a re-test of the lows around 130.7 levels.
By becoming a Premium Member, you’ll be able to improve your knowledge of the principles of classical charting.
With this knowledge, you can merge them with your investing system. In fact, some investors use my analyses to modify their existing style to invest more efficiently and successfully.
You will receive:
For your convenience your membership auto renews each year.

Every week Tech Charts Global Equity Markets report features some of the well-defined, mature classical chart patterns under a lengthy watchlist and the chart pattern breakout signals that took place during that week. Global Equity Markets report covers single stocks from developed, emerging and frontier markets, ETF’s, select commodities, cryptocurrencies and global equity indices.
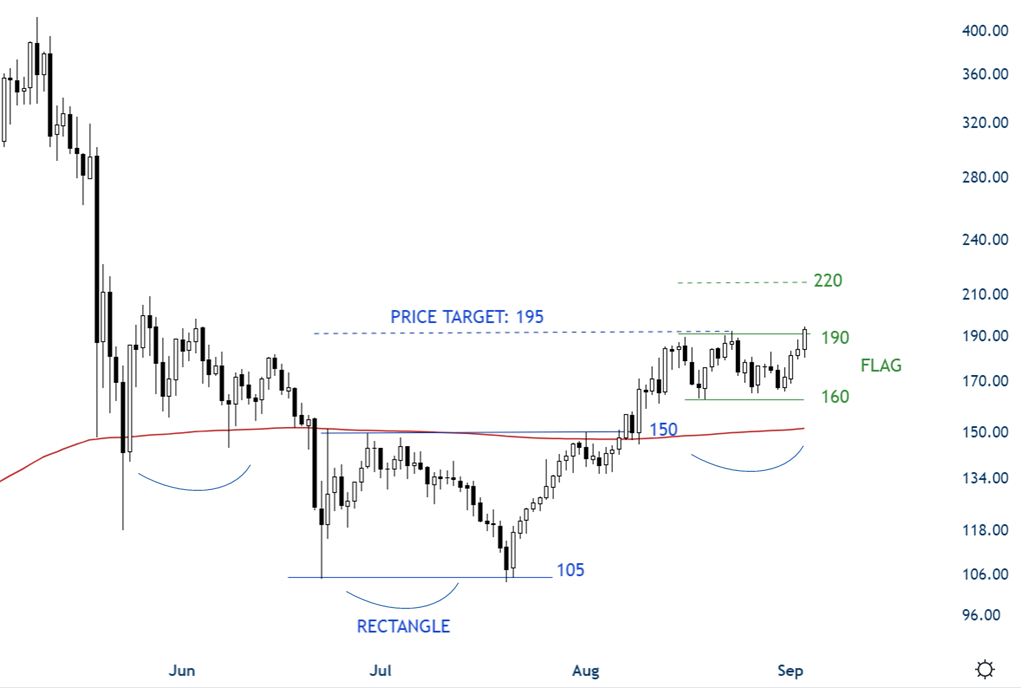
We have now added special cryptocurrency reports to our coverage as part of the premium membership. The below analysis is part of the special cryptocurrency updates.
As on many other crypto pairs a bullish flag can be identified on LTCUSD as well. Earlier the price chart completed a rectangle bottom reversal with a breakout above 150 levels where price breached the long-term (365 day EMA) as well. The trend change has taken place. Following the change in trend we are now seeing a possible bullish continuation chart pattern with the resistance at 190 and support at 160 levels. From a larger scale perspective a multi-month long H&S bottom can be in progress as well. For now I want to focus on the latest bullish flag development. A breakout above 190 levels can target 220 levels in a short period of time and confirm the existing uptrend.
By becoming a Premium Member, you’ll be able to improve your knowledge of the principles of classical charting.
With this knowledge, you can merge them with your investing system. In fact, some investors use my analyses to modify their existing style to invest more efficiently and successfully.
You will receive:
For your convenience your membership auto renews each year.

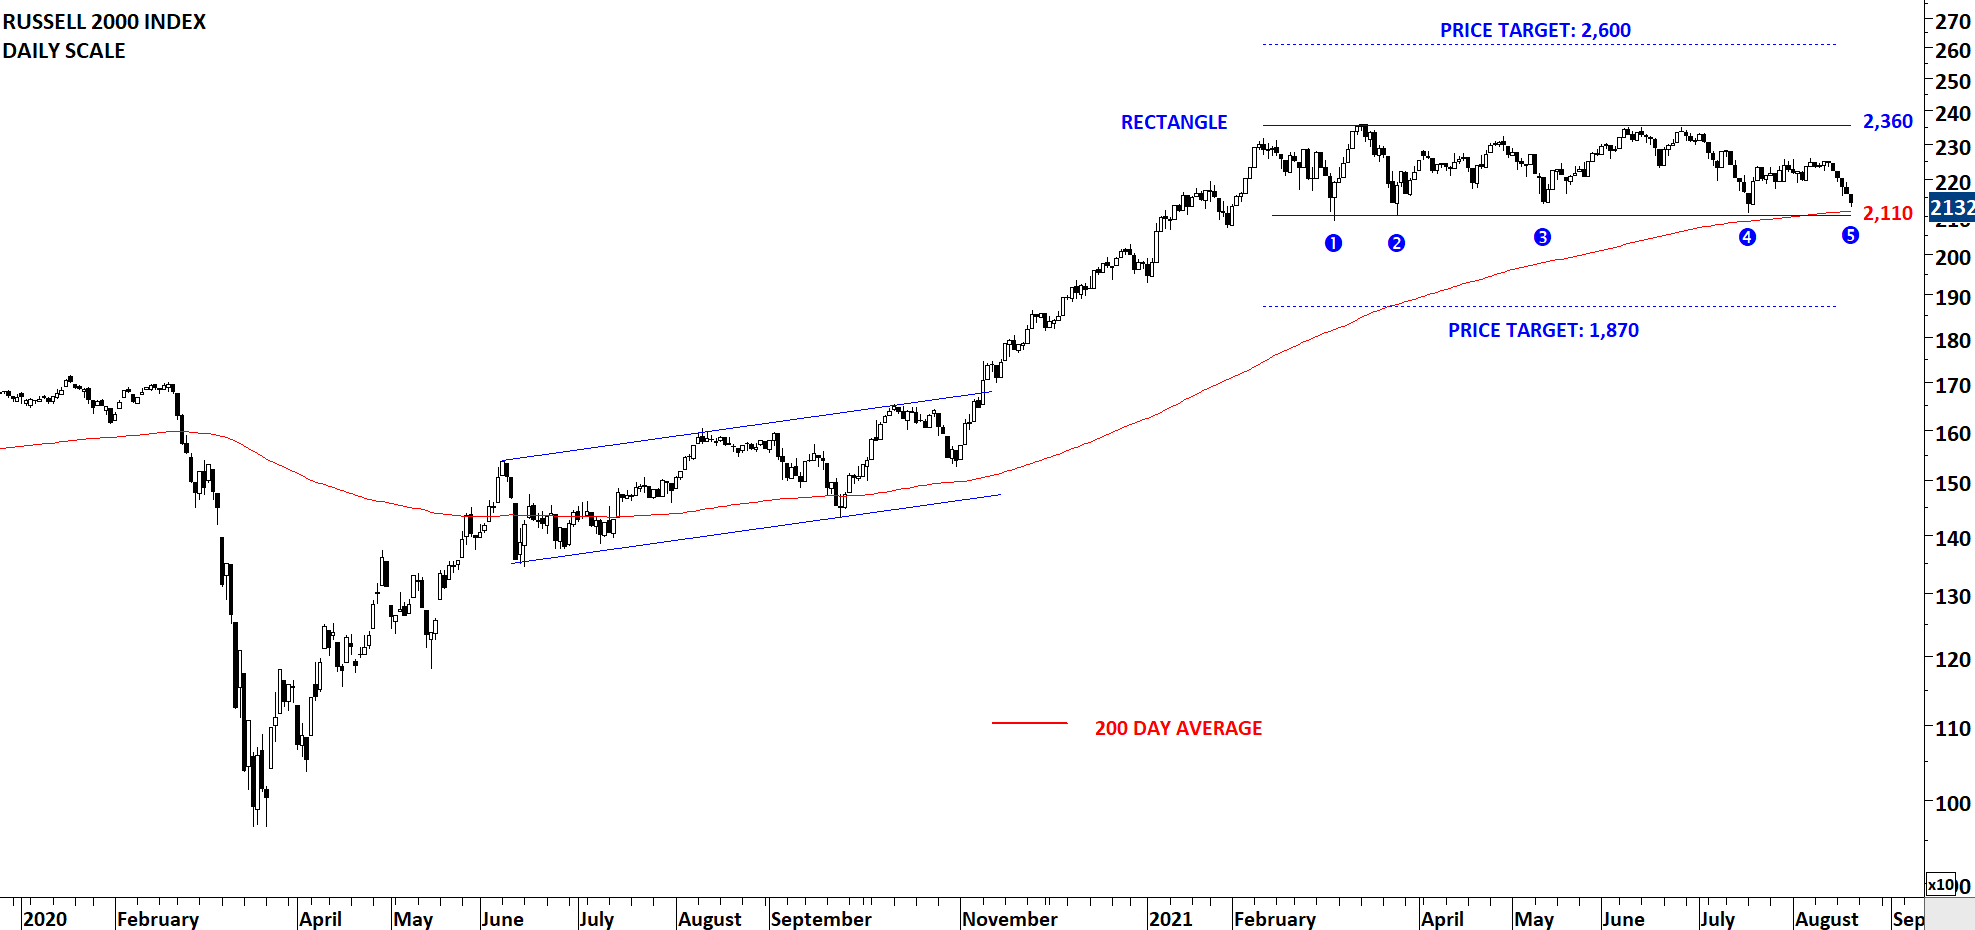
Every week Tech Charts Global Equity Markets report features some of the well-defined, mature classical chart patterns under a lengthy watchlist and the chart pattern breakout signals that took place during that week. Global Equity Markets report covers single stocks from developed, emerging and frontier markets, ETF’s, select commodities, cryptocurrencies and global equity indices. The report starts with a review section that highlights the important chart developments on global equity benchmarks. This blog post features from the review section Russell 2000 Index.
If you have been struggling with stocks being choppy with frequent false breakouts, the chart below might explain the last several months lackluster performance. Russell 2000 Index has been range bound since February 2021. The index formed a well-defined consolidation range that can act as a bullish continuation as well as a top reversal. Rectangle chart pattern can act as a top reversal. The lower boundary of the well-defined consolidation is forming support at 2,100 levels with the 200-day moving average acting as another layer of support at 2,110 levels. When a well-defined, several times tested horizontal boundary overlaps with a long-term average (my preference is the 200-day EMA), I call these inflection points. Inflection points are important technical areas where we can expect a rebound or a breakdown that can result in a strong directional move. In other words those areas of “change”.
Russell 2000 Index is now very close to the lower boundary of its multi-month long consolidation. Breakdown can target 1,870 levels. A rebound from the strong support area can result in a re-test of the upper boundary at 2,360 levels.
By becoming a Premium Member, you’ll be able to improve your knowledge of the principles of classical charting.
With this knowledge, you can merge them with your investing system. In fact, some investors use my analyses to modify their existing style to invest more efficiently and successfully.
You will receive:
For your convenience your membership auto renews each year.
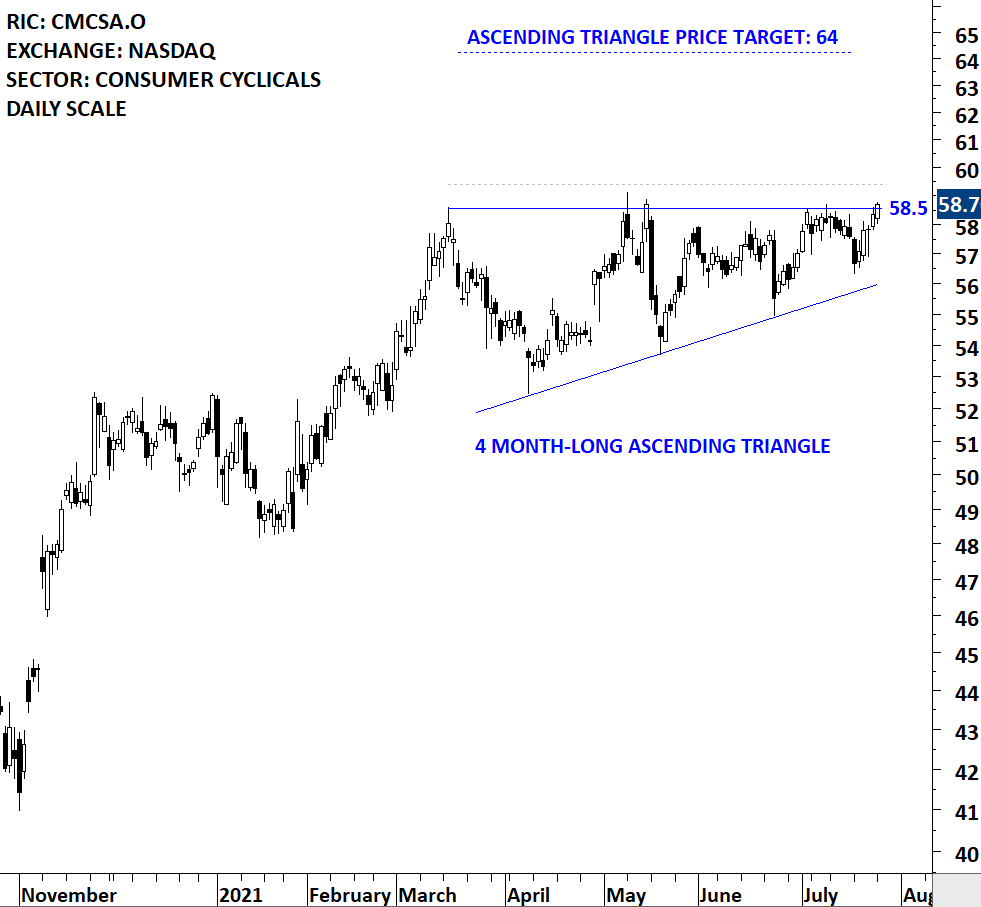
Every week Tech Charts Global Equity Markets report features some of the well-defined, mature classical chart patterns under a lengthy watchlist and the chart pattern breakout signals that took place during that week. Global Equity Markets report covers single stocks from developed, emerging and frontier markets, ETF’s, select commodities, cryptocurrencies and global equity indices. The report starts with a review section that highlights the important chart developments on global equity benchmarks. This blog post features from the watchlist section COMCAST CORP (CMCSA.O) listed on the Nasdaq Stock Exchange.
Comcast Corporation is a media and technology company. The Company has two primary businesses: Comcast Cable and NBCUniversal. The stock is listed on the Nasdaq Stock Exchange. Price chart formed a 4 month-long ascending triangle with the horizontal boundary acting as strong resistance at 58.50 levels. The horizontal boundary was tested several times over the course of the chart pattern. A daily close above 59.40 levels will confirm the breakout from the 4 month-long ascending triangle with the possible chart pattern price target of 64.00 levels. Breakout can push the stock to all-time highs. As is the case for several stocks, the stock is very close to an earning announcement on Jul 29th. It is important to factor possible volatility around that date to your decision making.
By becoming a Premium Member, you’ll be able to improve your knowledge of the principles of classical charting.
With this knowledge, you can merge them with your investing system. In fact, some investors use my analyses to modify their existing style to invest more efficiently and successfully.
You will receive:
For your convenience your membership auto renews each year.


