
EUROPE ETFs
Every week Tech Charts Global Equity Markets report features some of the well-defined, mature classical chart patterns under a lengthy watchlist and the chart pattern breakout signals that took place during that week. Global Equity Markets report covers single stocks from developed, emerging and frontier markets, ETF’s, select commodities, cryptocurrencies and global equity indices. Below charts are from the review section of the weekly report. It is featuring IEV and EFA ETFs listed on the New York Stock Exchange. If you are trading range bound price action between well-defined boundaries, these opportunities might be valuable. I see both charts at inflection points. A rebound from the lower boundaries can put these ETFs back into positive territory. A breakdown will act as bearish reversal.
EUROPEAN EQUITY BENCHMARKS
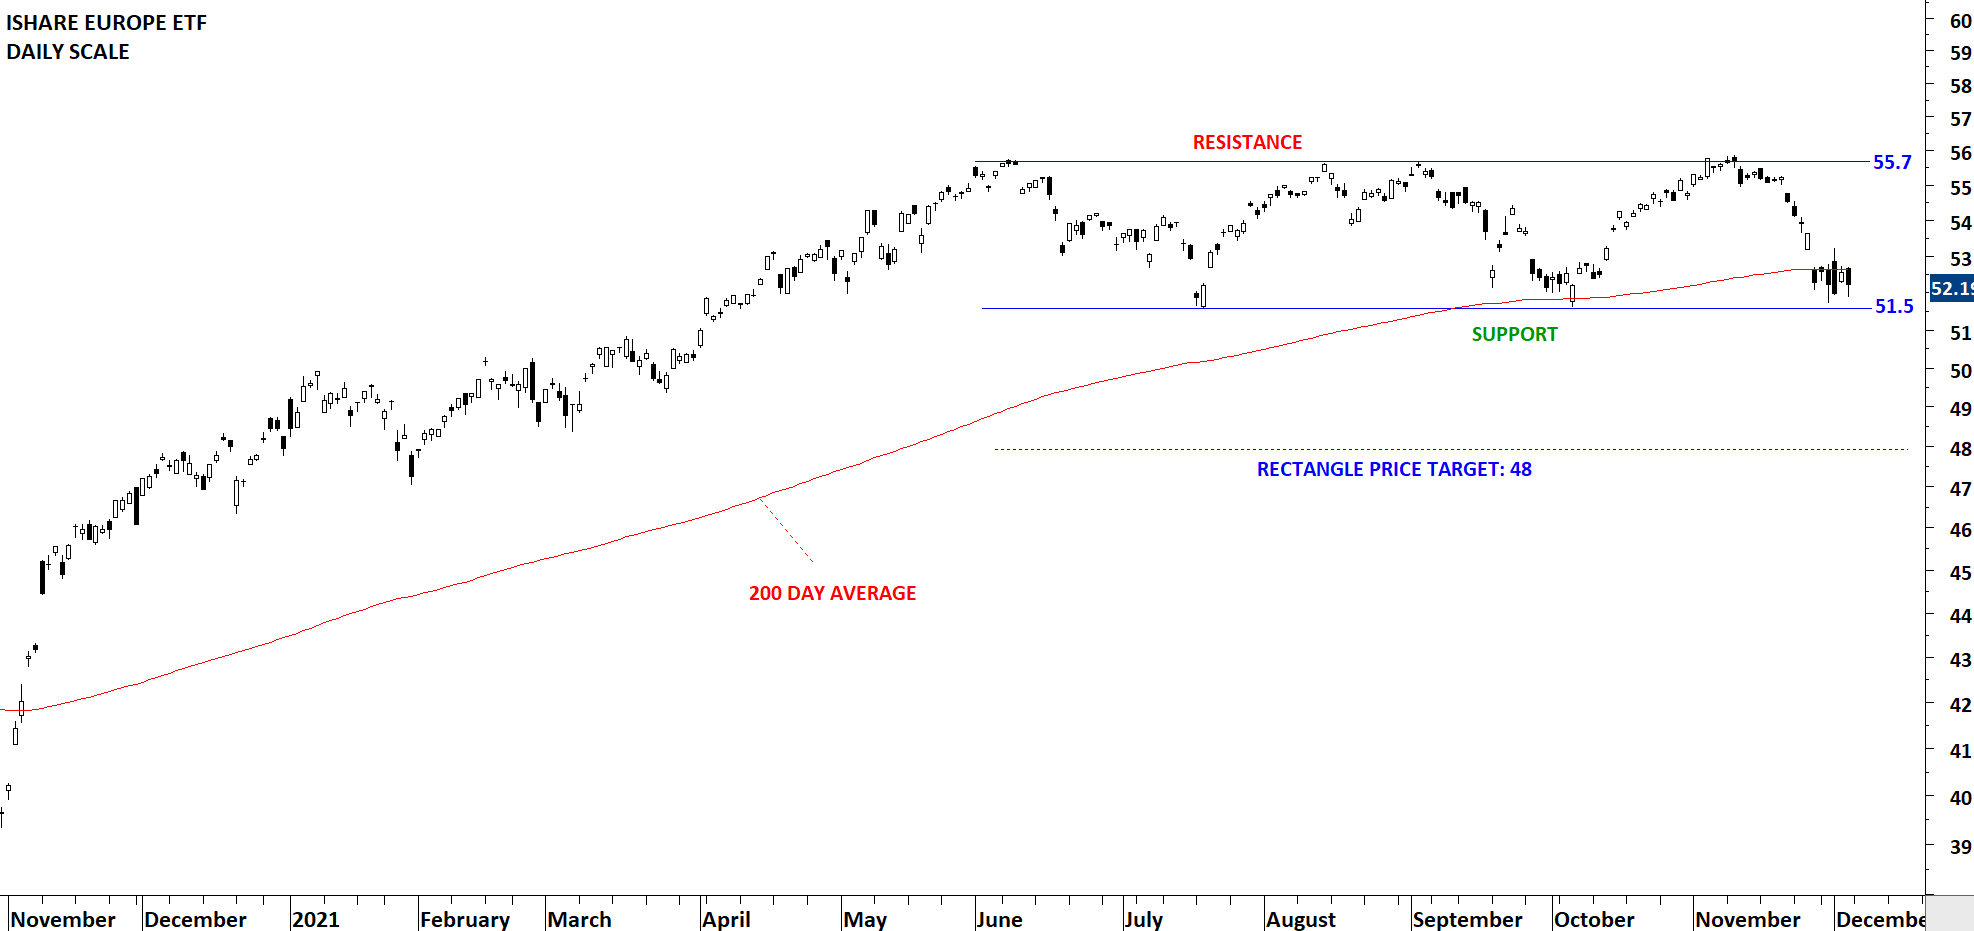
ISHARE EUROPE ETF (IEV) formed 6 month-long rectangle with the lower boundary acting as support at 51.5 and the upper boundary as resistance at 55.7 levels. Breakdown below the lower boundary can confirm the rectangle as a top reversal with the possible price target of 48 levels.
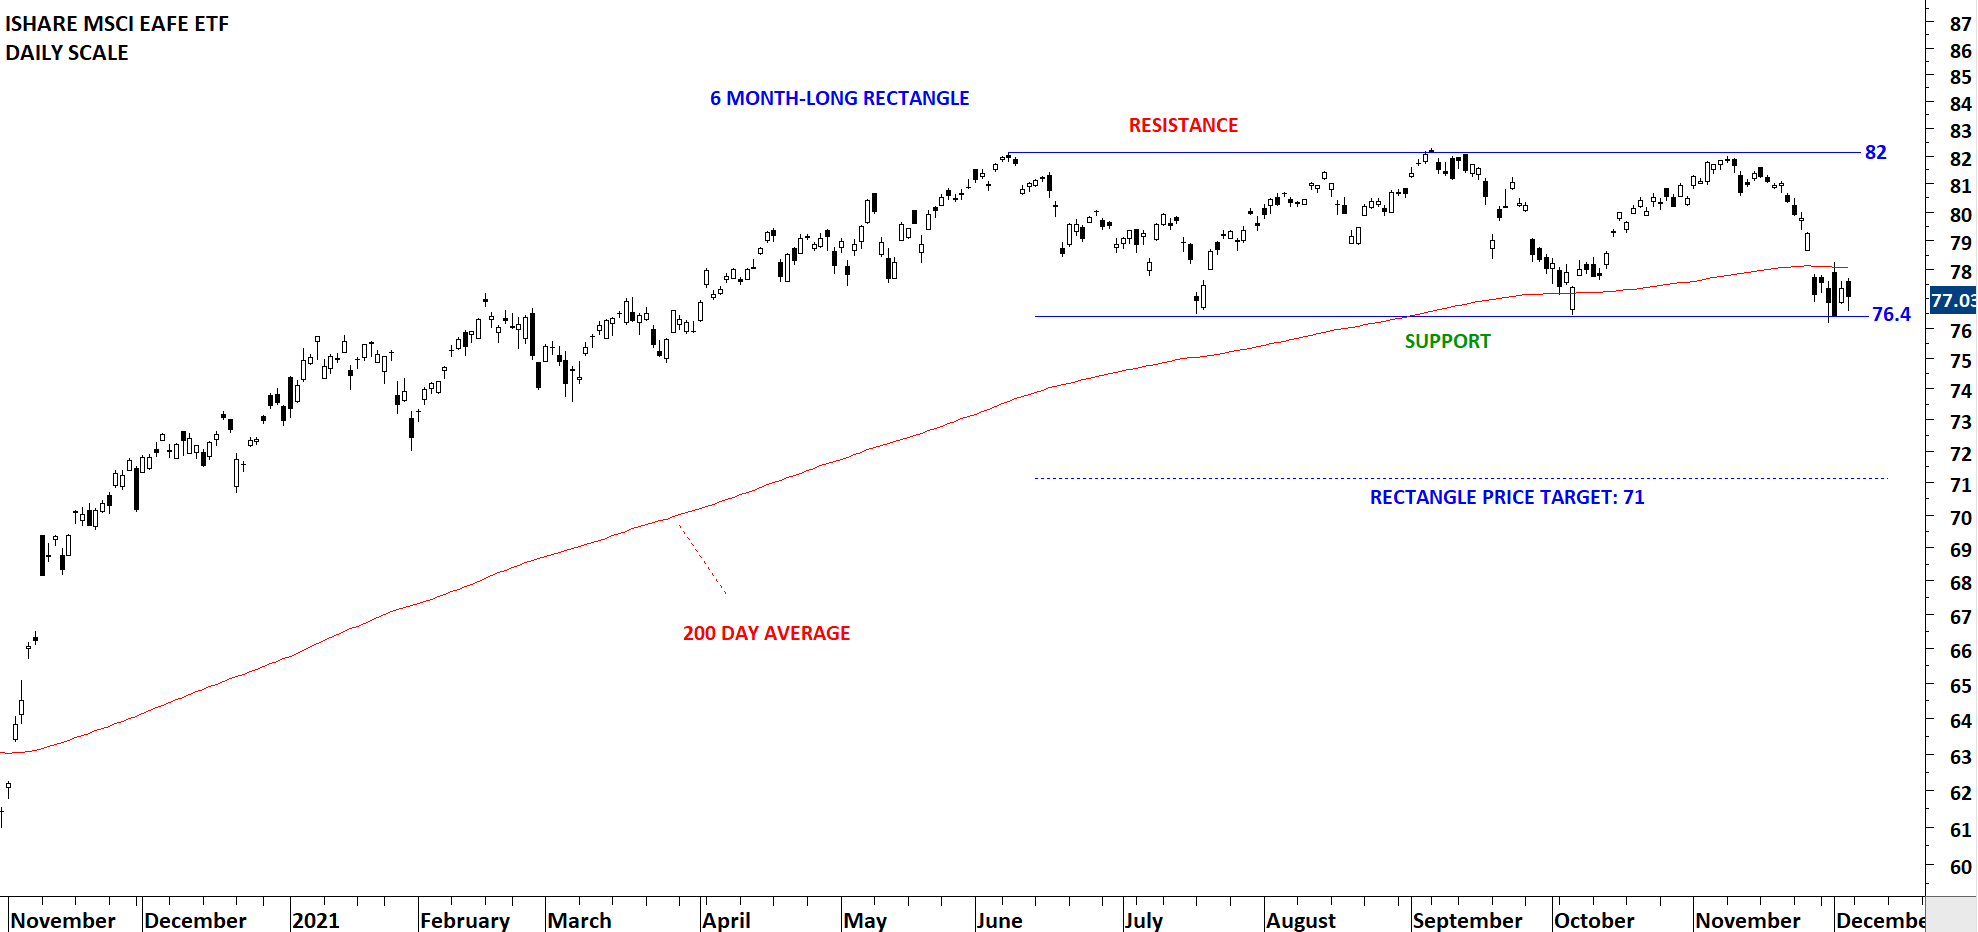
ISHARE MSCI EAFE ETF (EFA) formed a 6 month-long rectangle with the upper boundary acting as resistance at 82 and the lower boundary as support at 76.4 levels. Price is consolidating right below the 200-day average. Breakdown below the horizontal support can result in a top reversal with the price target at 71 levels.
Here is a breakdown of the ISHARES MSCI EAFE ETF for those of you who are not familiar with MSCI benchmarked funds.
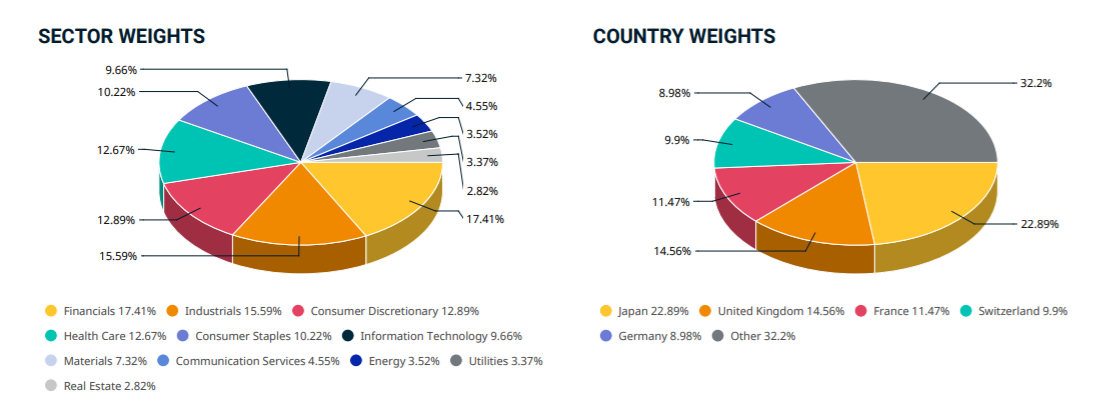 Data as of Oct 29, 2021. Source: msci.com
Tech Charts Membership

By becoming a Premium Member, you’ll be able to improve your knowledge of the principles of classical charting.
With this knowledge, you can merge them with your investing system. In fact, some investors use my analyses to modify their existing style to invest more efficiently and successfully.

As a Premium Member of Aksel Kibar’s Tech Charts,
You will receive:
-
Global Equities Report. Delivered weekly.
-
Classical charting principles. Learn patterns and setups.
-
Actionable information. Worldwide indices and stocks of interest.
-
Risk management advice. The important trading points of each chart.
-
Information on breakout opportunities. Identify the ones you want to take action on.
-
Video tutorials. How patterns form and why they succeed or fail.
-
Watch list alerts. As they become available so you can act quickly.
-
Breakout alerts. Usually once a week.
-
Access to everything (now and as it becomes available)o Reports
o Videos and video series -
Multi-part webinar course. You learn the 8 most common charting principles.
-
Webinars. Actionable and timely advice on breaking out chart patterns.
For your convenience your membership auto renews each year.


