“Demystifying the world of Classical Charting”
– AKSEL KIBAR

Every week Tech Charts Global Equity Markets report features some of the well-defined, mature classical chart patterns under a lengthy watchlist and the chart pattern breakout signals that took place during that week. Global Equity Markets report covers single stocks from developed, emerging and frontier markets, ETF’s and global equity indices. The report starts with a review section that highlights the important chart developments on global equity benchmarks. This blog post features a bullish ascending triangle chart pattern on Allegheny Technologies Inc. listed on the New York Stock Exchange.
Read More
Cross listing of shares is when a firm lists its equity shares on one or more foreign stock exchange in addition to its domestic exchange. Many companies cross-list, in which the stock is technically fungible between exchanges. Prices are subject to local market conditions, as well as FX fluctuations and are not kept in perfect parity between markets. Generally such a company's primary listing is on a stock exchange in its country of incorporation, and its secondary listing(s) is/are on an exchange in another country. Cross-listing is especially common for companies that started out in a small market but grew into a larger market.
Read More
Every week Tech Charts Global Equity Markets report features some of the well-defined, mature classical chart patterns under a lengthy watchlist and the chart pattern breakout signals that took place during that week. Global Equity Markets report covers single stocks from developed, emerging and frontier markets, ETF’s and global equity indices. The report starts with a review section that highlights the important chart developments on global equity benchmarks. This blog post features an head and shoulder continuation chart pattern on South32 LTD listed on the Johannesburg Stock Exchange.
Read More
Every week Tech Charts Global Equity Markets report features some of the well-defined, mature classical chart patterns under a lengthy watchlist and the chart pattern breakout signals that took place during that week. Global Equity Markets report covers single stocks from developed, emerging and frontier markets, ETF’s and global equity indices. The report starts with a review section that highlights the important chart developments on global equity benchmarks. This blog post features part of the review section highlighting chart pattern developments on Asian equity benchmarks.
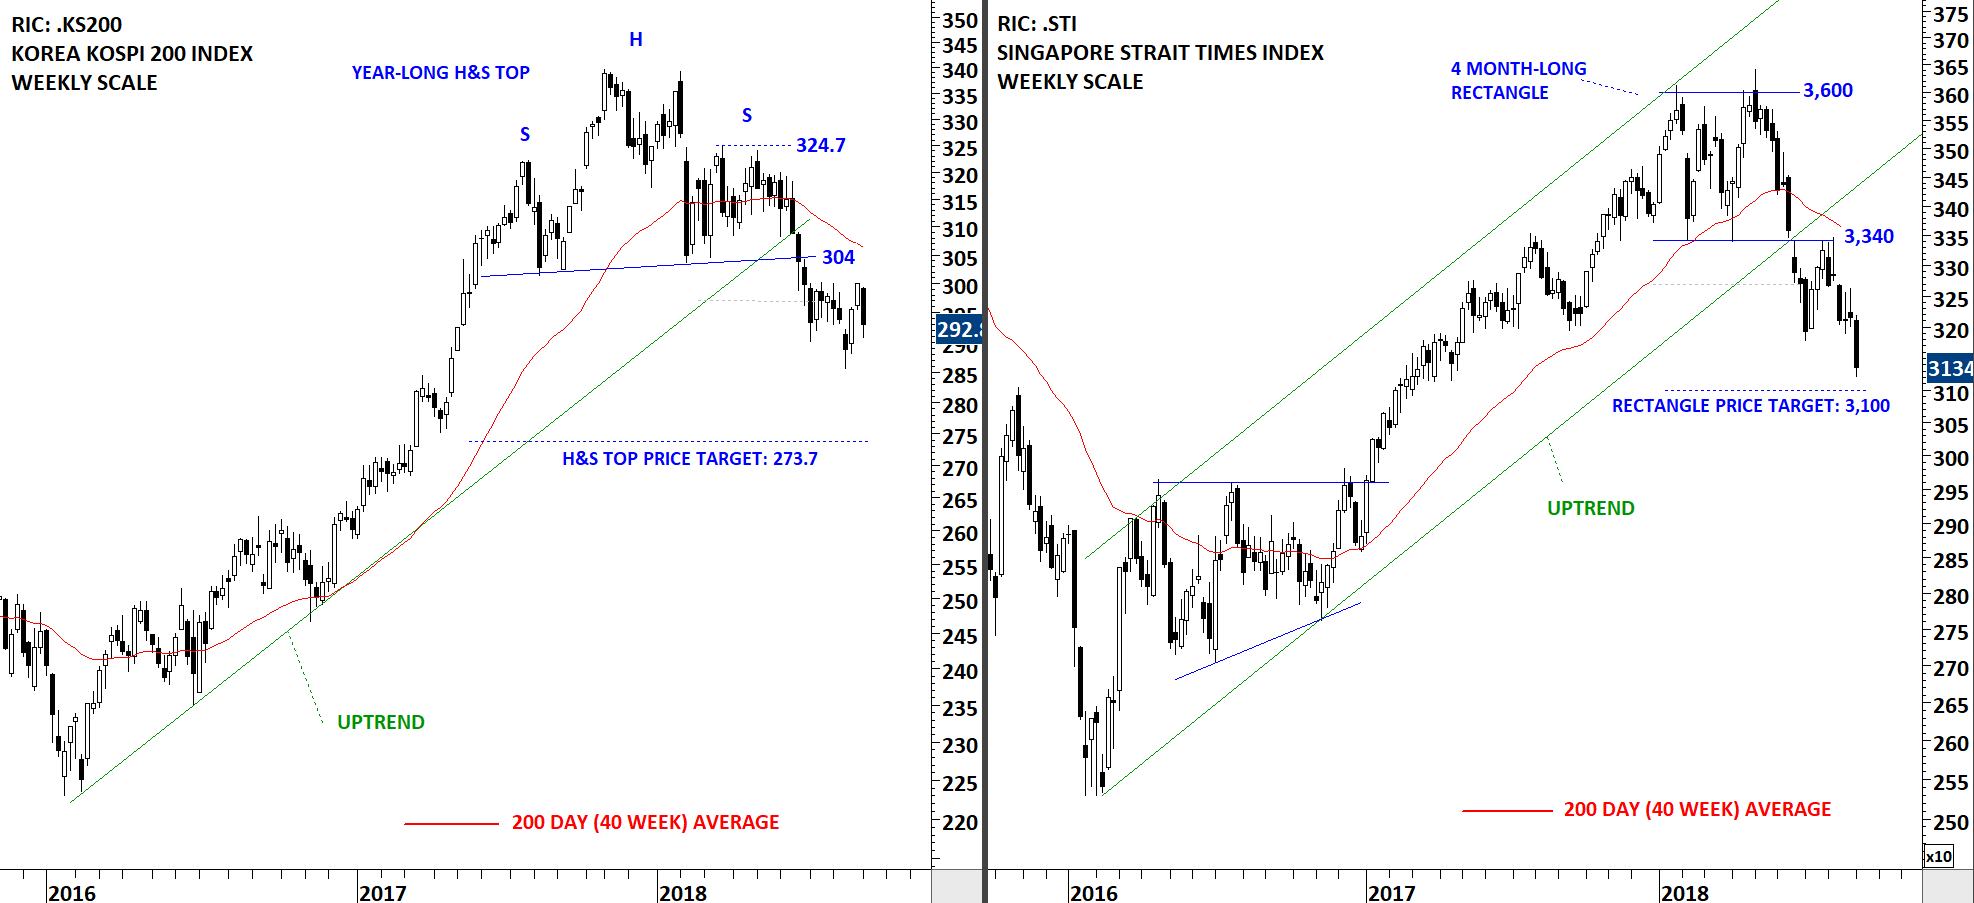
Over the past few months two major breakdowns were featured on Asia equity markets. Both Korea Kospi 200 Index and Singapore Strait Times Index completed top formations and breached their long-term averages. Breakdowns also breached their multi-year upward trend line supports. Singapore Strait Times Index is now very close to its chart pattern price target at 3,100 levels. However, the index is in a steady downtrend and there is no evidence of a short-term bottom formation.
Korea Kospi 200 Index completed a year-long H&S top chart pattern after breaching the neckline at 304 levels. The index remains below its long-term average and in a steady downtrend. The year-long H&S top has an unmet price target at 273.7 levels.
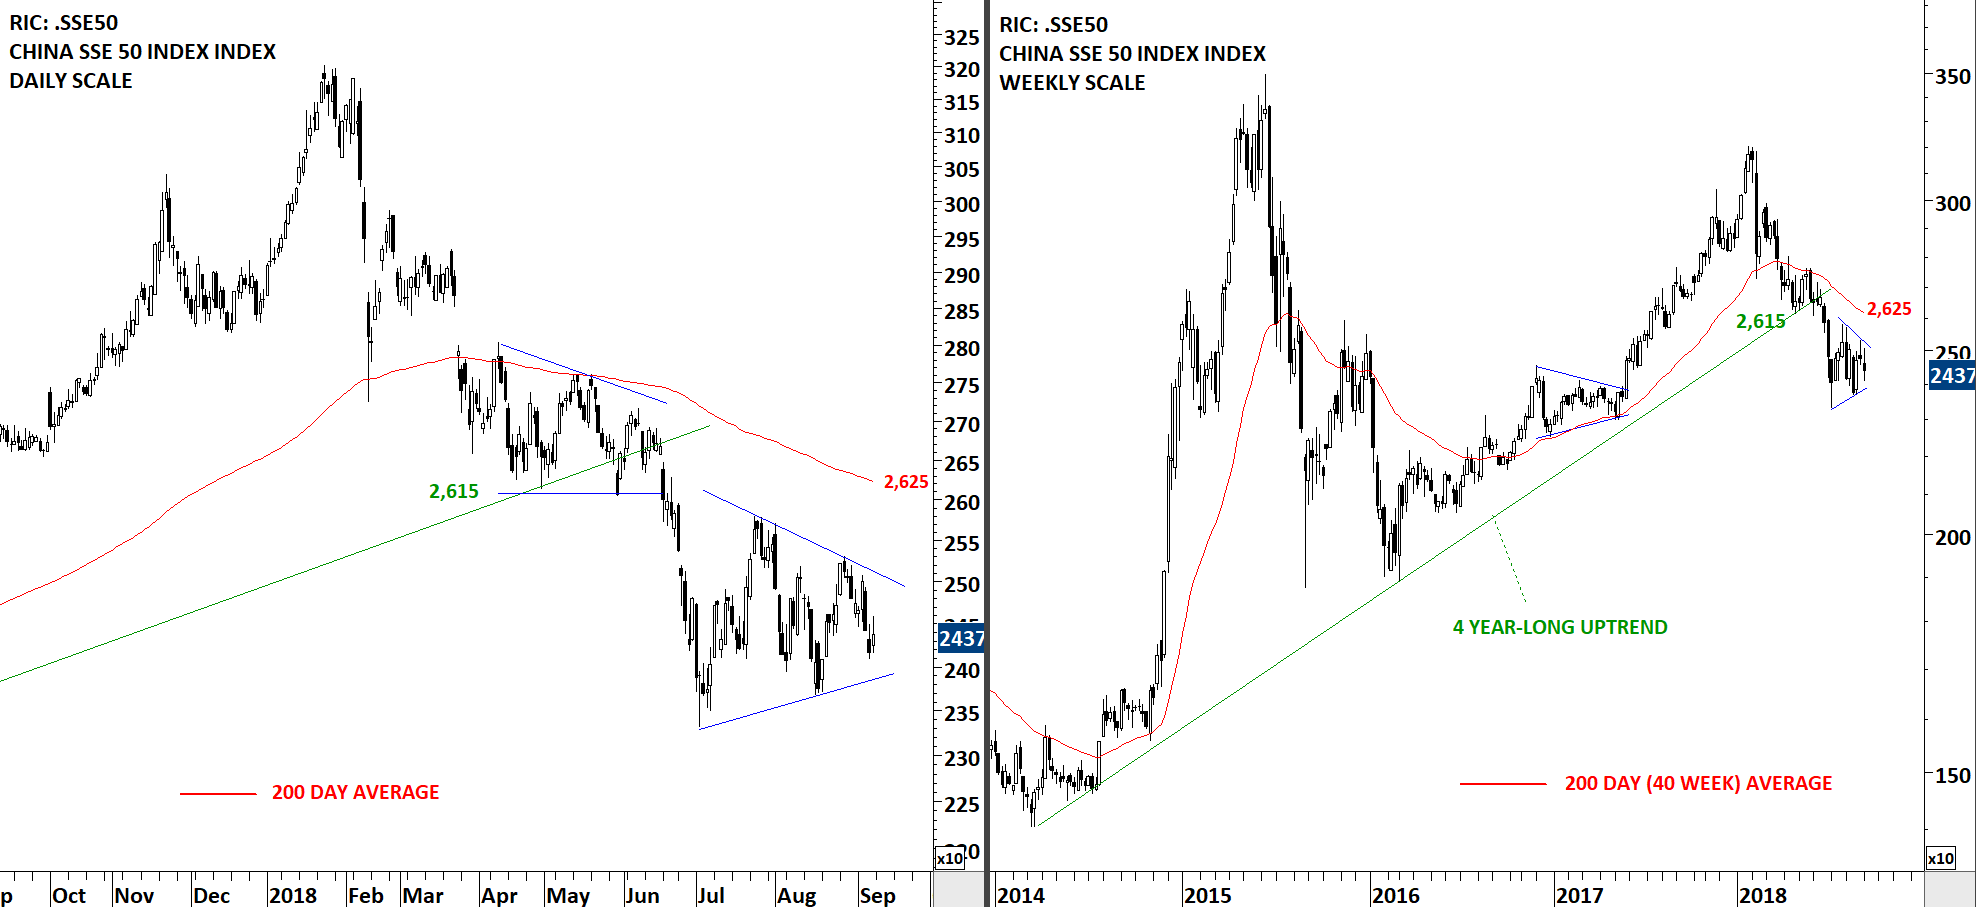
China SSE 50 Index first breached its long-term average and then broke down its 4 year-long upward trend line at 2,615 levels. Last two month’s consolidation is possibly forming a symmetrical triangle that can act as a bearish continuation chart pattern. Strong resistance area remains between 2,615 and 2,625 levels. Chinese equities are in a steady downtrend.
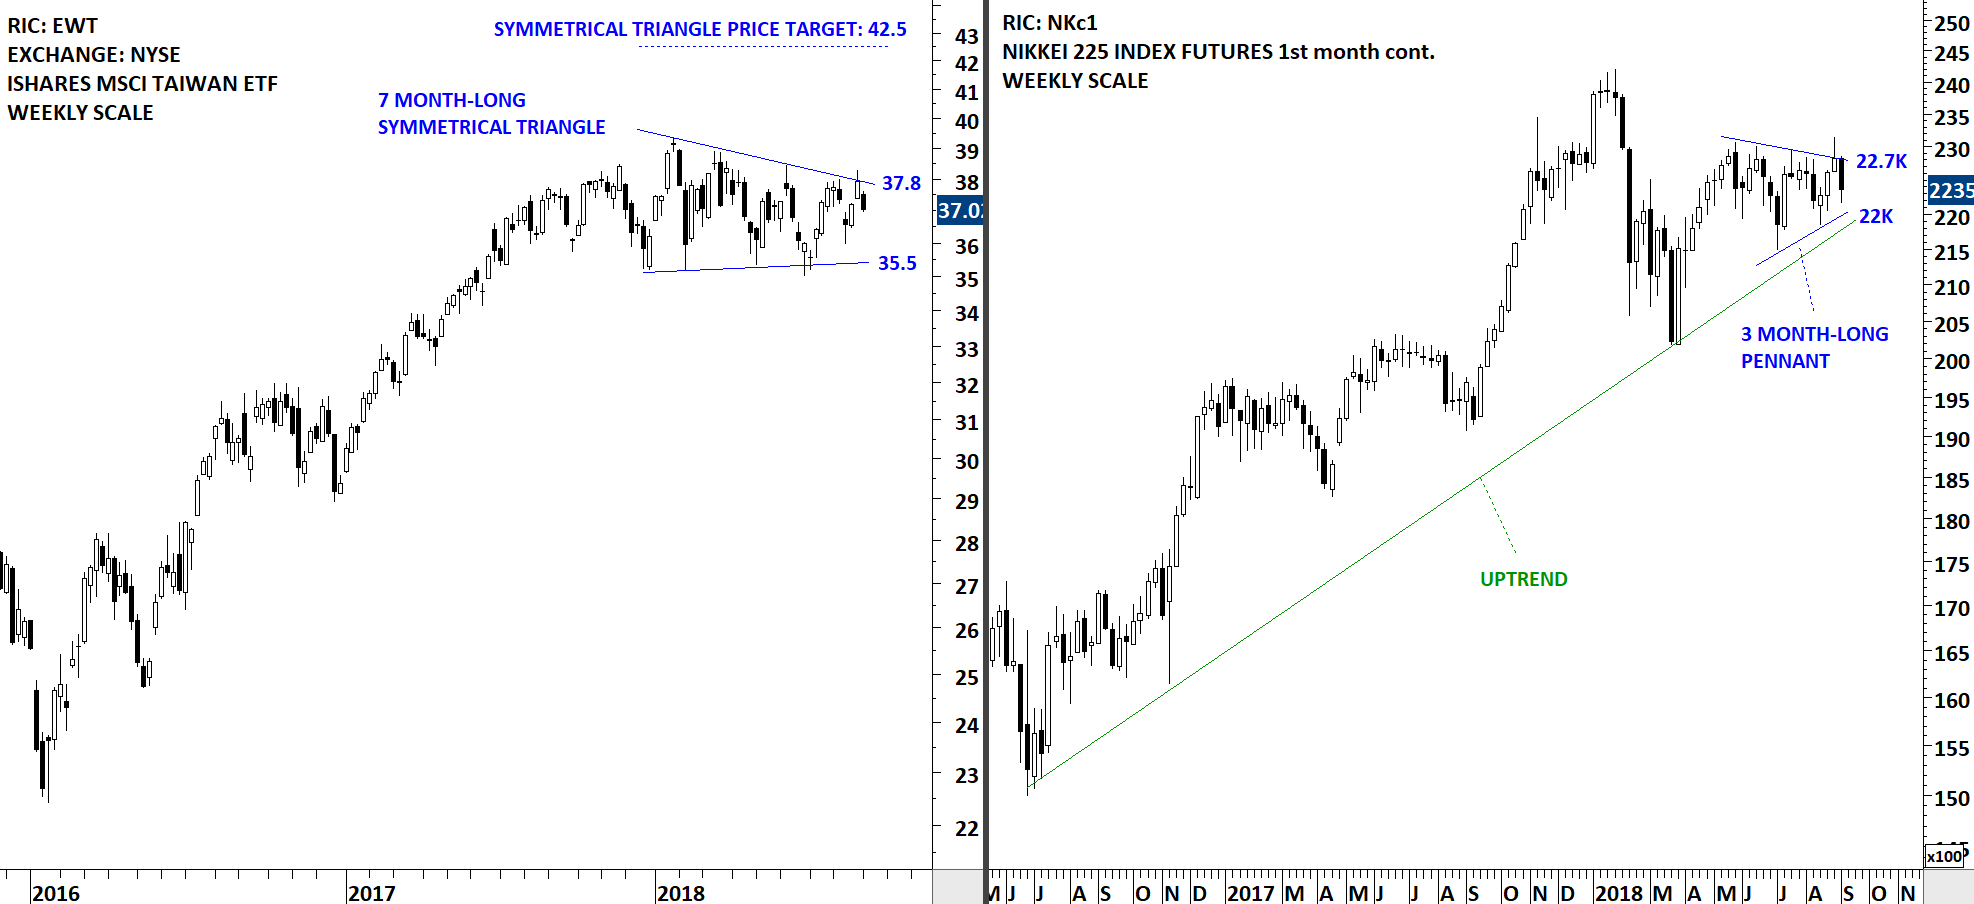
Two Asian equity benchmarks are holding well despite the weakness in regional equities. Japan’s Nikkei 225 Index and Taiwan ETF (EWT) listed on the New York Stock Exchange, are going through tight consolidations. Charts below feature the 1st month continuation futures price chart for Nikkei 225 Index and the iShares MSCI Taiwan ETF (EWT). Breakout higher from these tight consolidations can be positive for both Japan and Taiwan equities.

By becoming a Premium Member, you’ll be able to improve your knowledge of the principles of classical charting.
With this knowledge, you can merge them with your investing system. In fact, some investors use my analyses to modify their existing style to invest more efficiently and successfully.
You will receive:
For your convenience your membership auto renews each year.

Every week Tech Charts Global Equity Markets report features some of the well-defined, mature classical chart patterns under a lengthy watchlist and the chart pattern breakout signals that took place during that week. Global Equity Markets report covers single stocks from developed, emerging and frontier markets, ETF’s and global equity indices. The report starts with a review section that highlights the important chart developments on global equity benchmarks. This blog post features an head and shoulder continuation chart pattern on Science Application International Corp. listed on the New York Stock Exchange.
Read More
Every week Tech Charts Global Equity Markets report features some of the well-defined, mature classical chart patterns under a lengthy watchlist and the chart pattern breakout signals that took place during that week. Global Equity Markets report covers single stocks from developed, emerging and frontier markets, ETF’s and global equity indices. The report starts with a review section that highlights the important chart developments on global equity benchmarks. This blog post features an ascending triangle chart pattern on Best Buy Co Inc. listed on the New York Stock Exchange.
Read More
Every week Tech Charts Global Equity Markets report features some of the well-defined, mature classical chart patterns under a lengthy watchlist and the chart pattern breakout signals that took place during that week. Global Equity Markets report covers single stocks from developed, emerging and frontier markets, ETF’s and global equity indices. The report starts with a review section that highlights the important chart developments on global equity benchmarks. This blog post features a rectangle chart pattern on ISHARES DOW JONES US AEROSPACE & DEFENSE INDEX FUND (ITA) listed on the New York Stock Exchange.
Read More
Every week Tech Charts Global Equity Markets report features some of the well-defined, mature classical chart patterns under a lengthy watchlist and the chart pattern breakout signals that took place during that week. Global Equity Markets report covers single stocks from developed, emerging and frontier markets, ETF’s and global equity indices. The report starts with a review section that highlights the important chart developments on global equity benchmarks. This blog post features a symmetrical triangle chart pattern on S&P 500 HIGH BETA ETF (SPHB.K) listed on the New York Stock Exchange.
Read More
Every week Tech Charts Global Equity Markets report features some of the well-defined, mature classical chart patterns under a lengthy watchlist and the chart pattern breakout signals that took place during that week. Global Equity Markets report covers single stocks from developed, emerging and frontier markets, ETF’s and global equity indices. The report starts with a review section that highlights the important chart developments on global equity benchmarks. This blog post features a rectangle chart pattern on Casella Waste Systems, Inc. listed on the Nasdaq Stock Exchange.
Read More
Every week Tech Charts Global Equity Markets report features some of the well-defined, mature classical chart patterns under a lengthy watchlist and the chart pattern breakout signals that took place during that week. Global Equity Markets report covers single stocks from developed, emerging and frontier markets, ETF’s and global equity indices. The report starts with a review section that highlights the important chart developments on global equity benchmarks. This blog post features a symmetrical triangle chart pattern on Acerinox SA listed on the Madrid Stock Exchange.
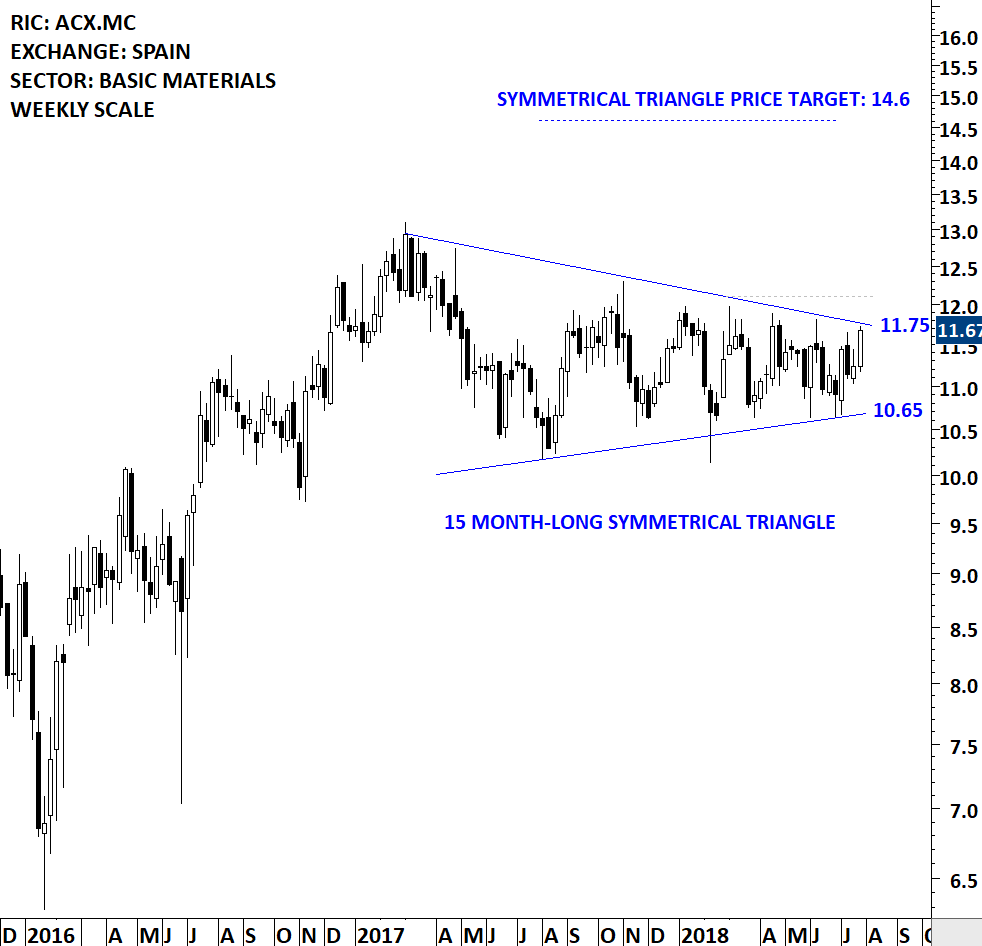
Acerinox SA is a Spain-based company active in the steel sector. It is engaged in the manufacturing, alloy and distribution of flat and long stainless steel products. The Company’s activities are divided into three business segments: Flat stainless steel products, which offers slabs, flats, coils, plates, sheets, circles and flat bars; Long stainless steel products, which provides bars, angles, wires and wire rod, and Other, which includes other stainless steel products. The Company owns factories, warehouses, service centers and representative office in Europe, the Americas, Asia, Oceania and Africa. The stock is listed on the Madrid Stock Exchange. Price chart formed a 15 month-long symmetrical triangle with the upper boundary acting as strong resistance at 11.75 levels. The upper boundary was tested several times over the course of the chart pattern. A daily close above 12.10 levels will confirm the breakout from the 15 month-long symmetrical triangle with the possible chart pattern price target of 14.6 levels.
By becoming a Premium Member, you’ll be able to improve your knowledge of the principles of classical charting.
With this knowledge, you can merge them with your investing system. In fact, some investors use my analyses to modify their existing style to invest more efficiently and successfully.
You will receive:
For your convenience your membership auto renews each year.


