GLOBAL EQUITY MARKETS – March 31, 2018
REVIEW
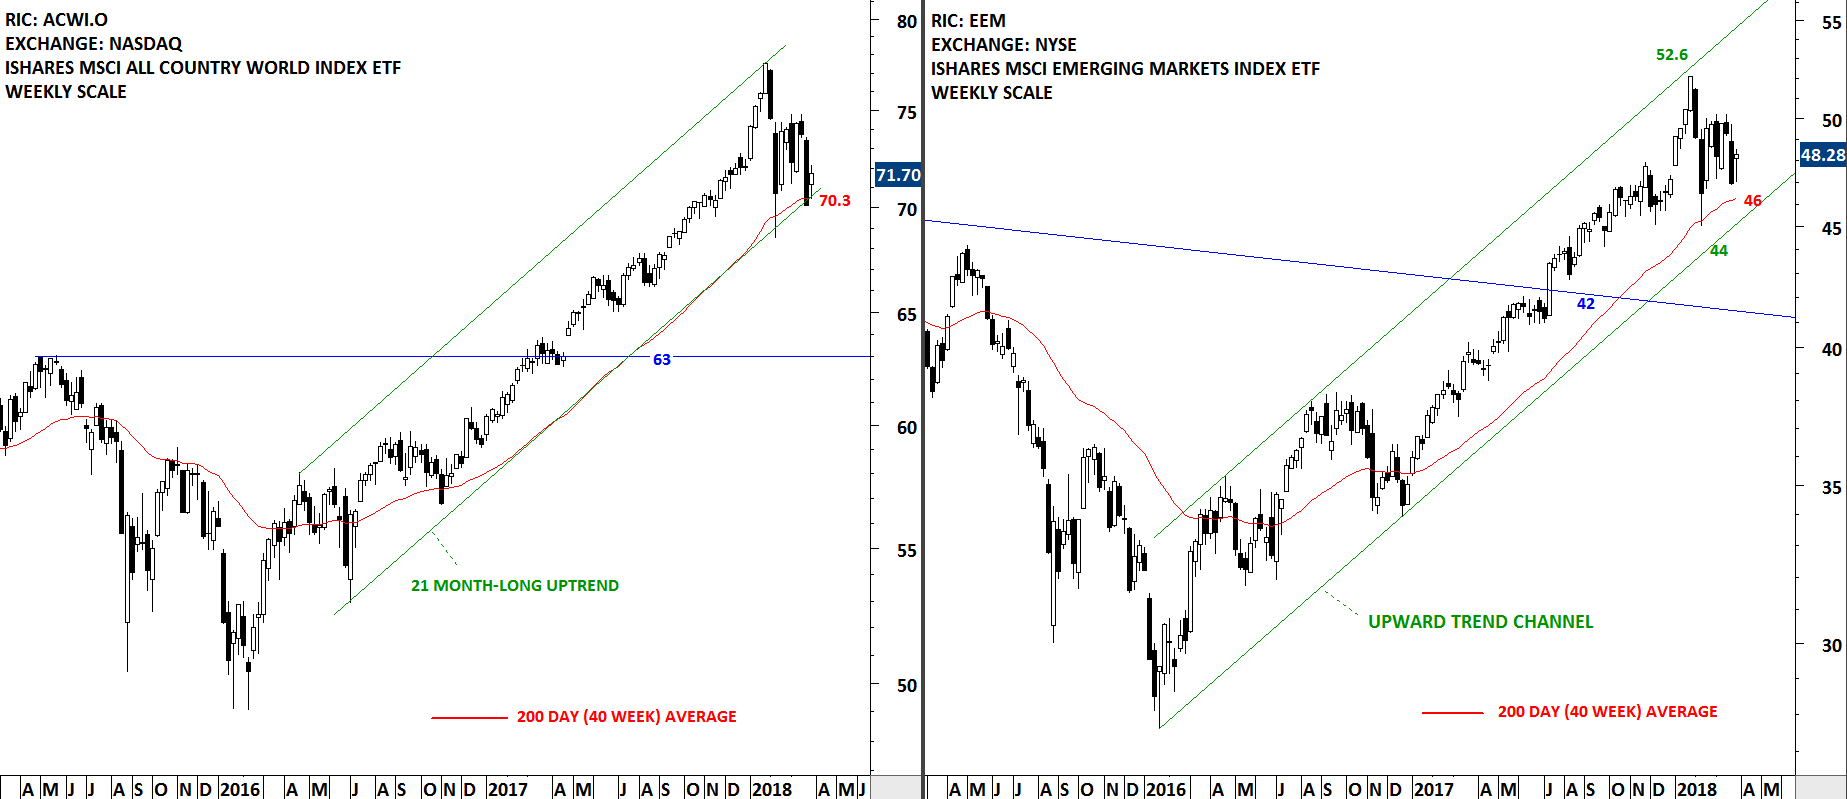
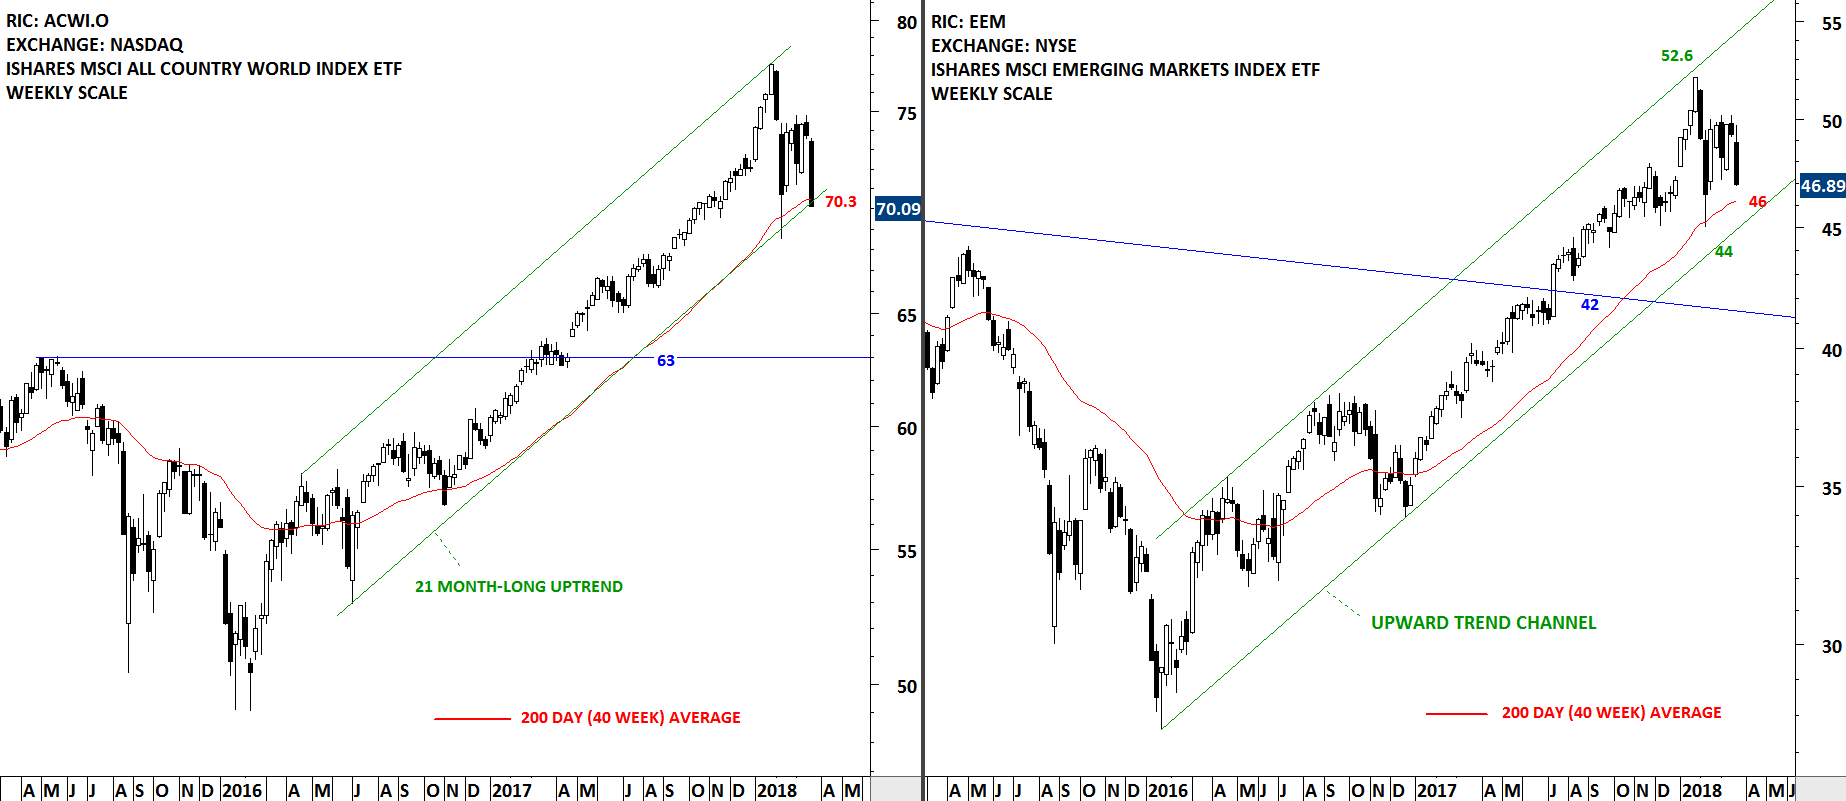
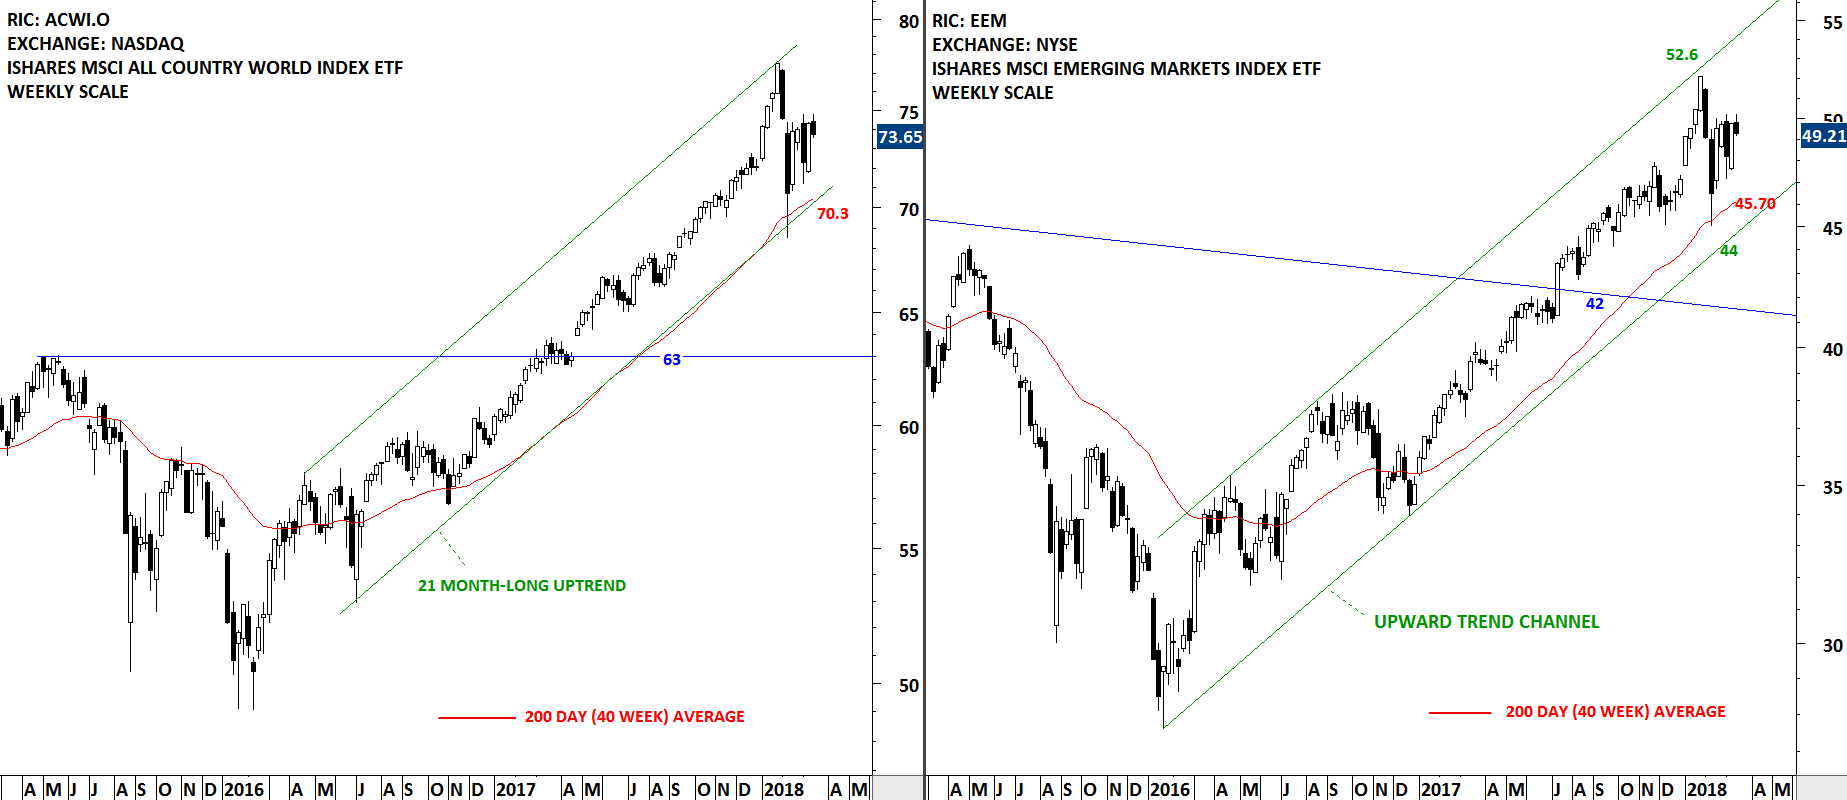
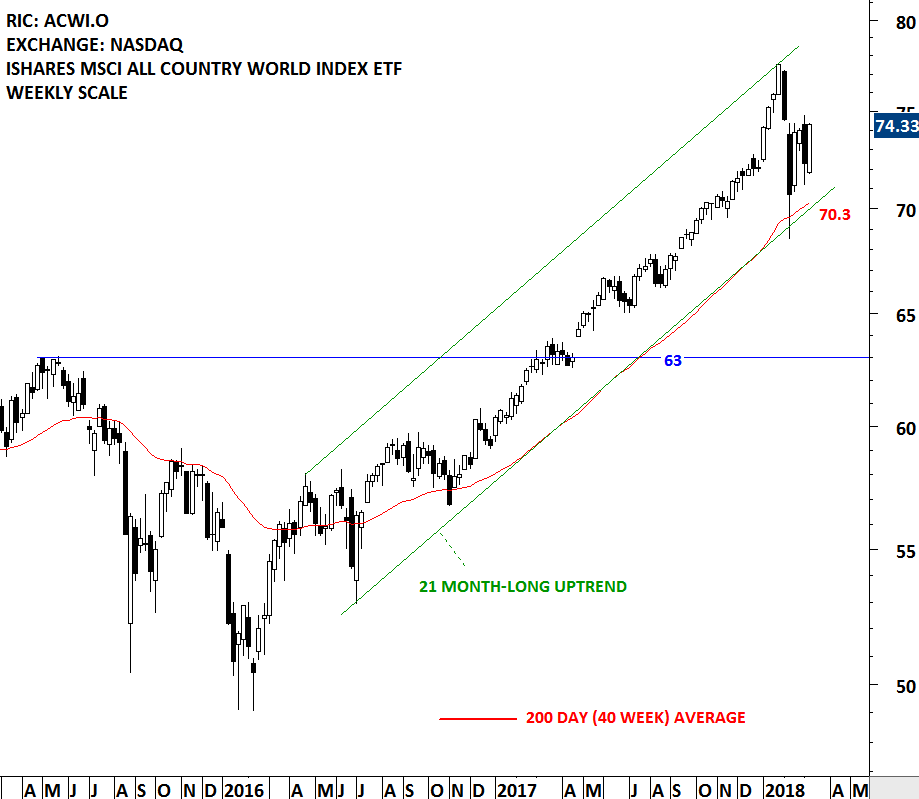
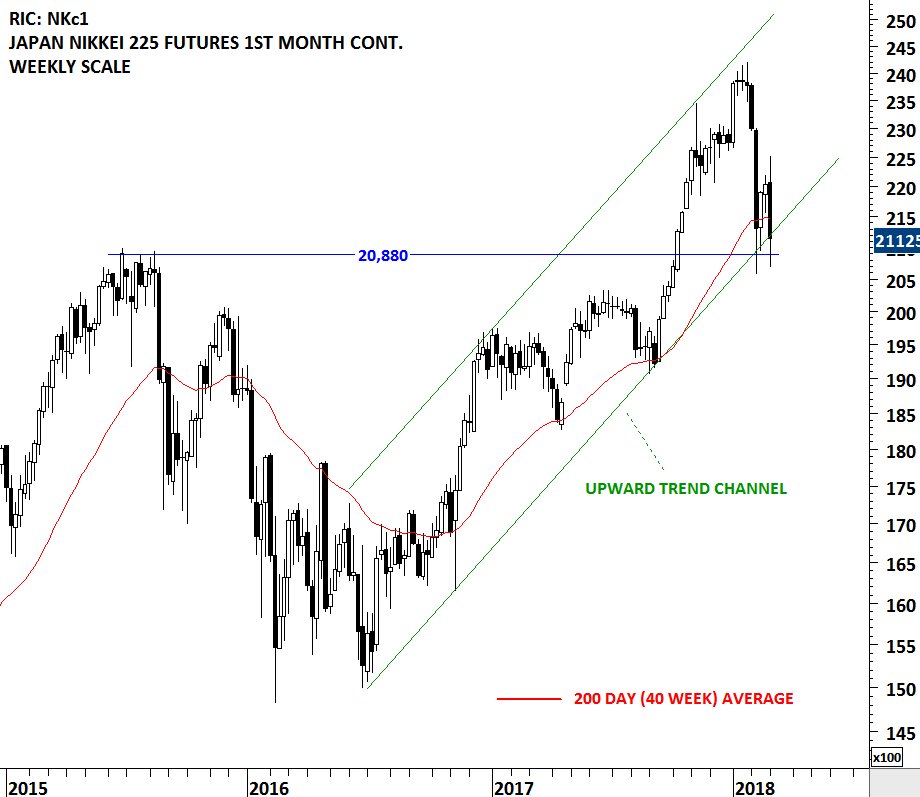
Global equity markets are still holding above their long-term support levels. A benchmark that I'm following for Global equity market performance, the iShares MSCI All Country World Index ETF (ACWI.O) rebounded once again from the 200-day (40 week) moving average and the lower boundary of its 2 year-long trend channel. The benchmark for Emerging Markets equities performance, the iShares MSCI Emerging Markets Index ETF (EEM) is trading above its long-term average and still far from the lower boundary of its multi-month long uptrend. A breakdown below the lower boundary of the trend channel and the 200-day average at 70.3 levels for the ACWI can result in further weakness. Until we see a breakdown, we will expect the uptrends to resume.