GLOBAL EQUITY MARKETS – September 22, 2018
Reminder on Live Webinar
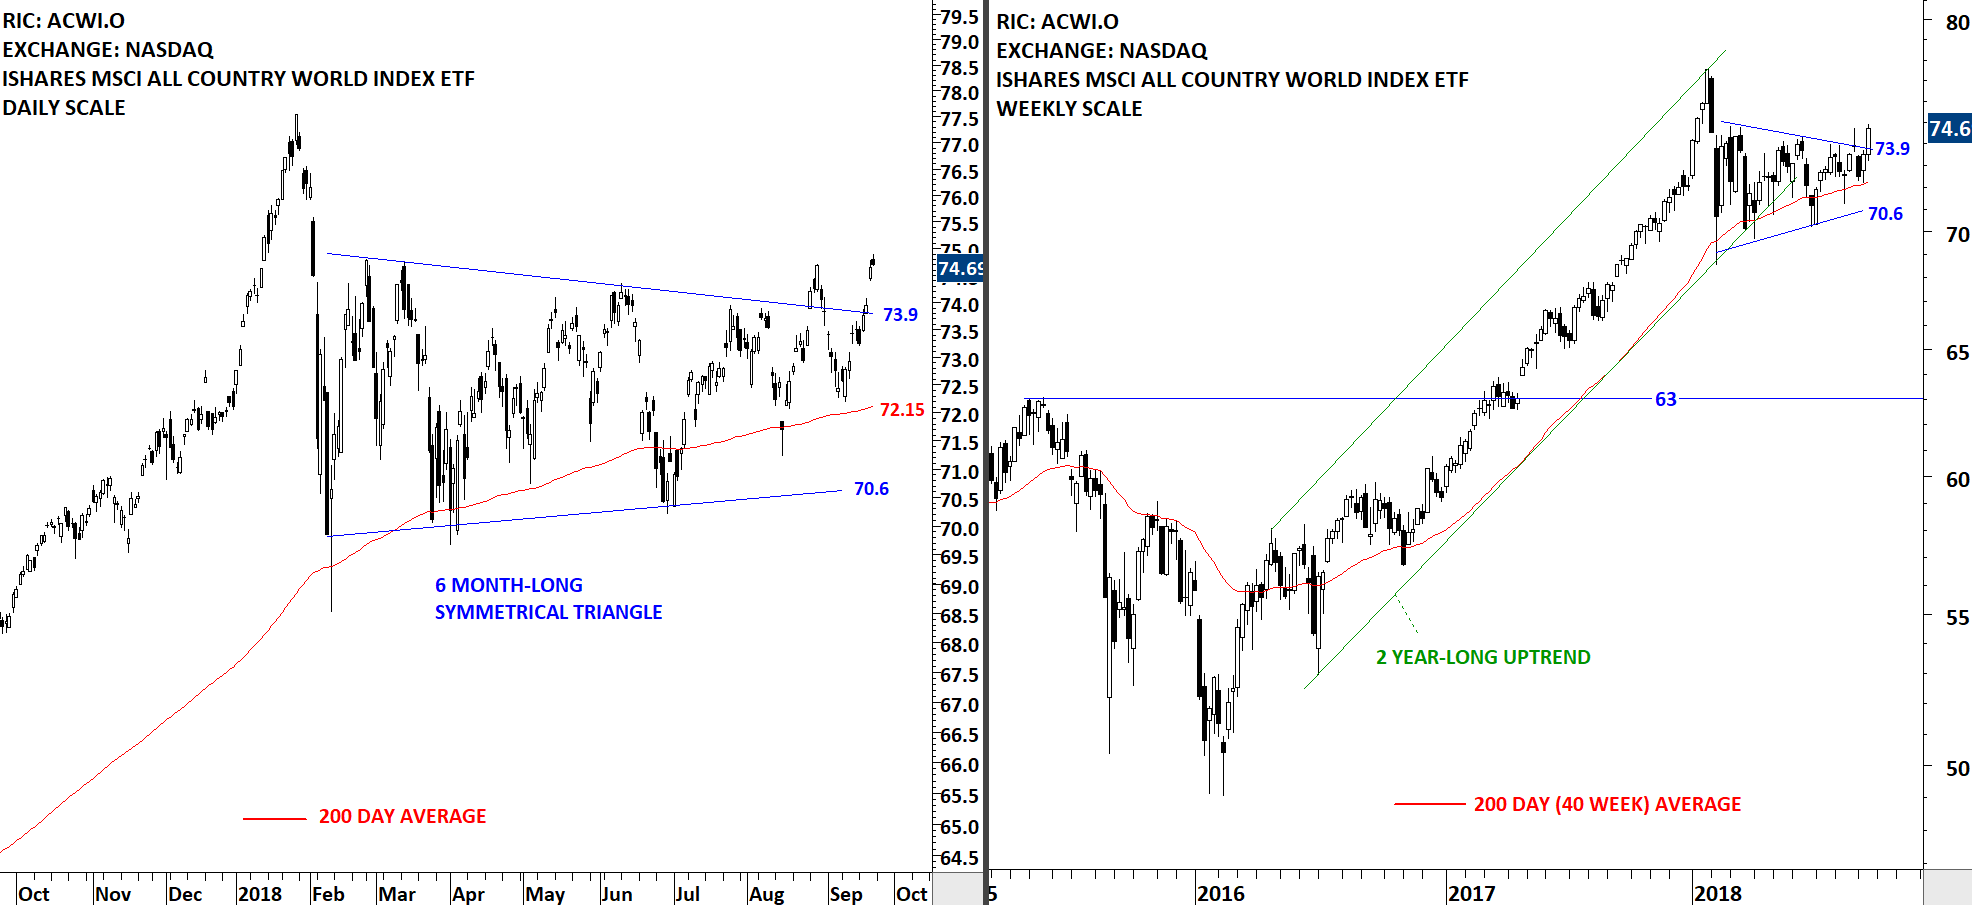
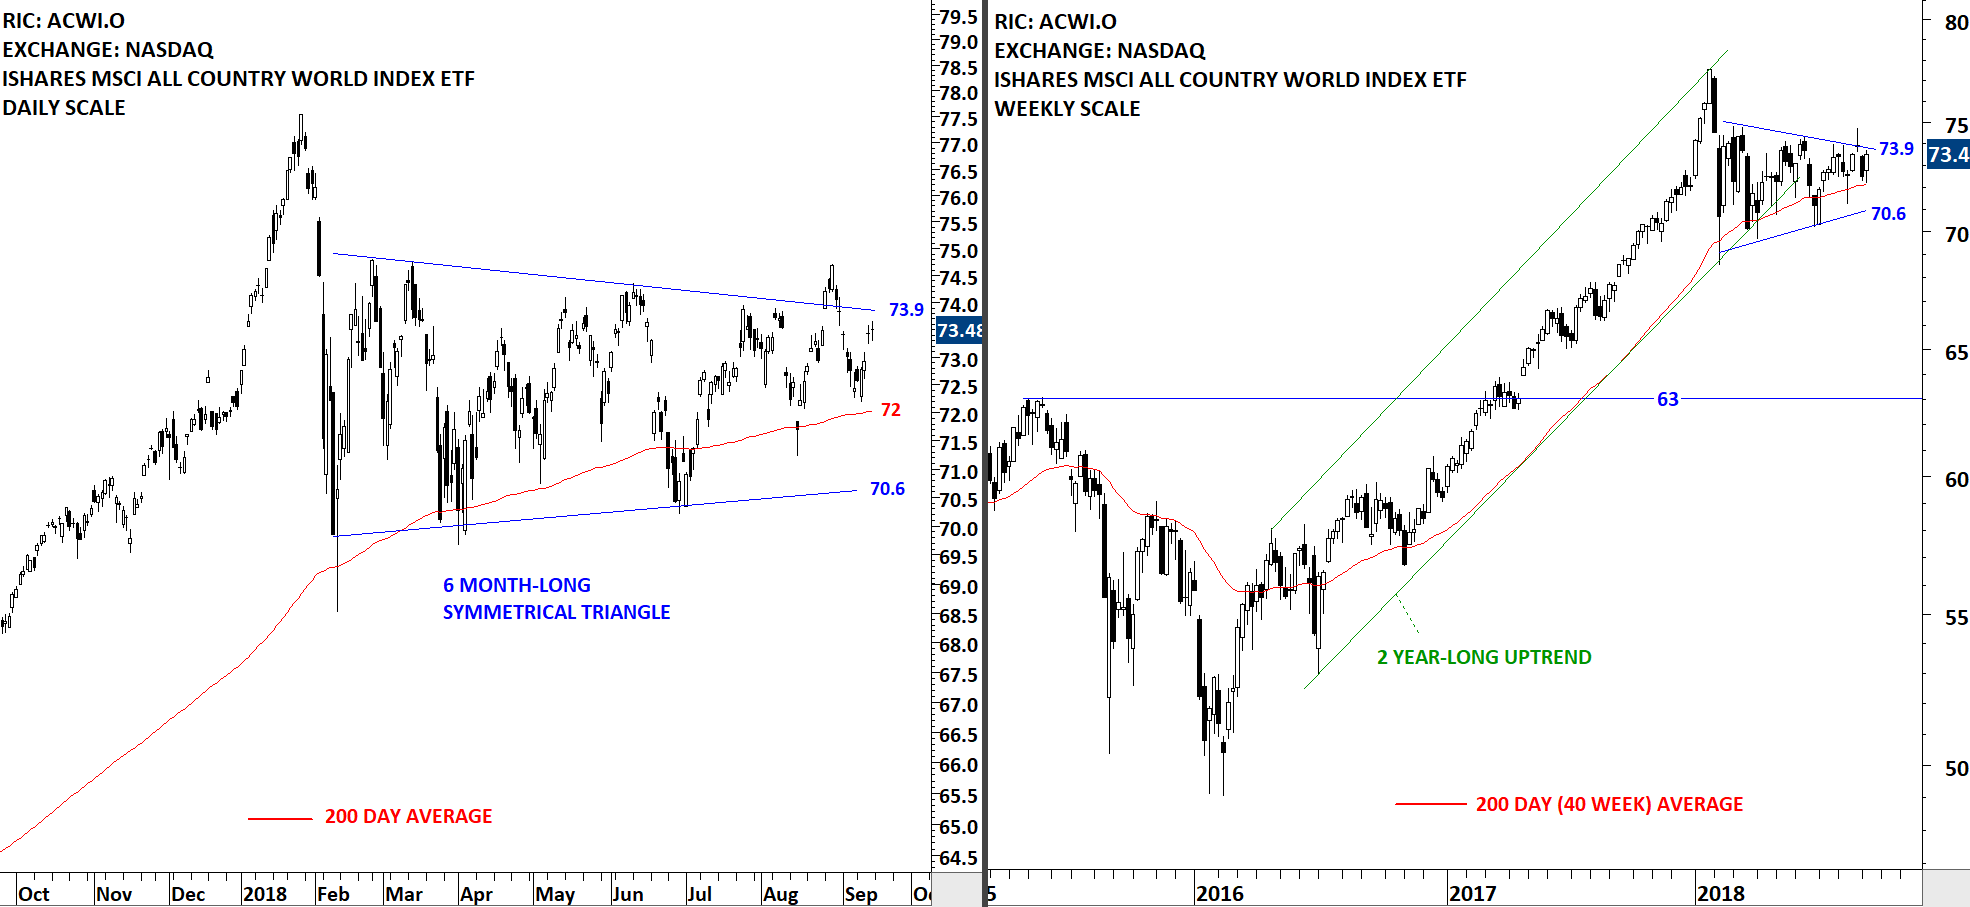
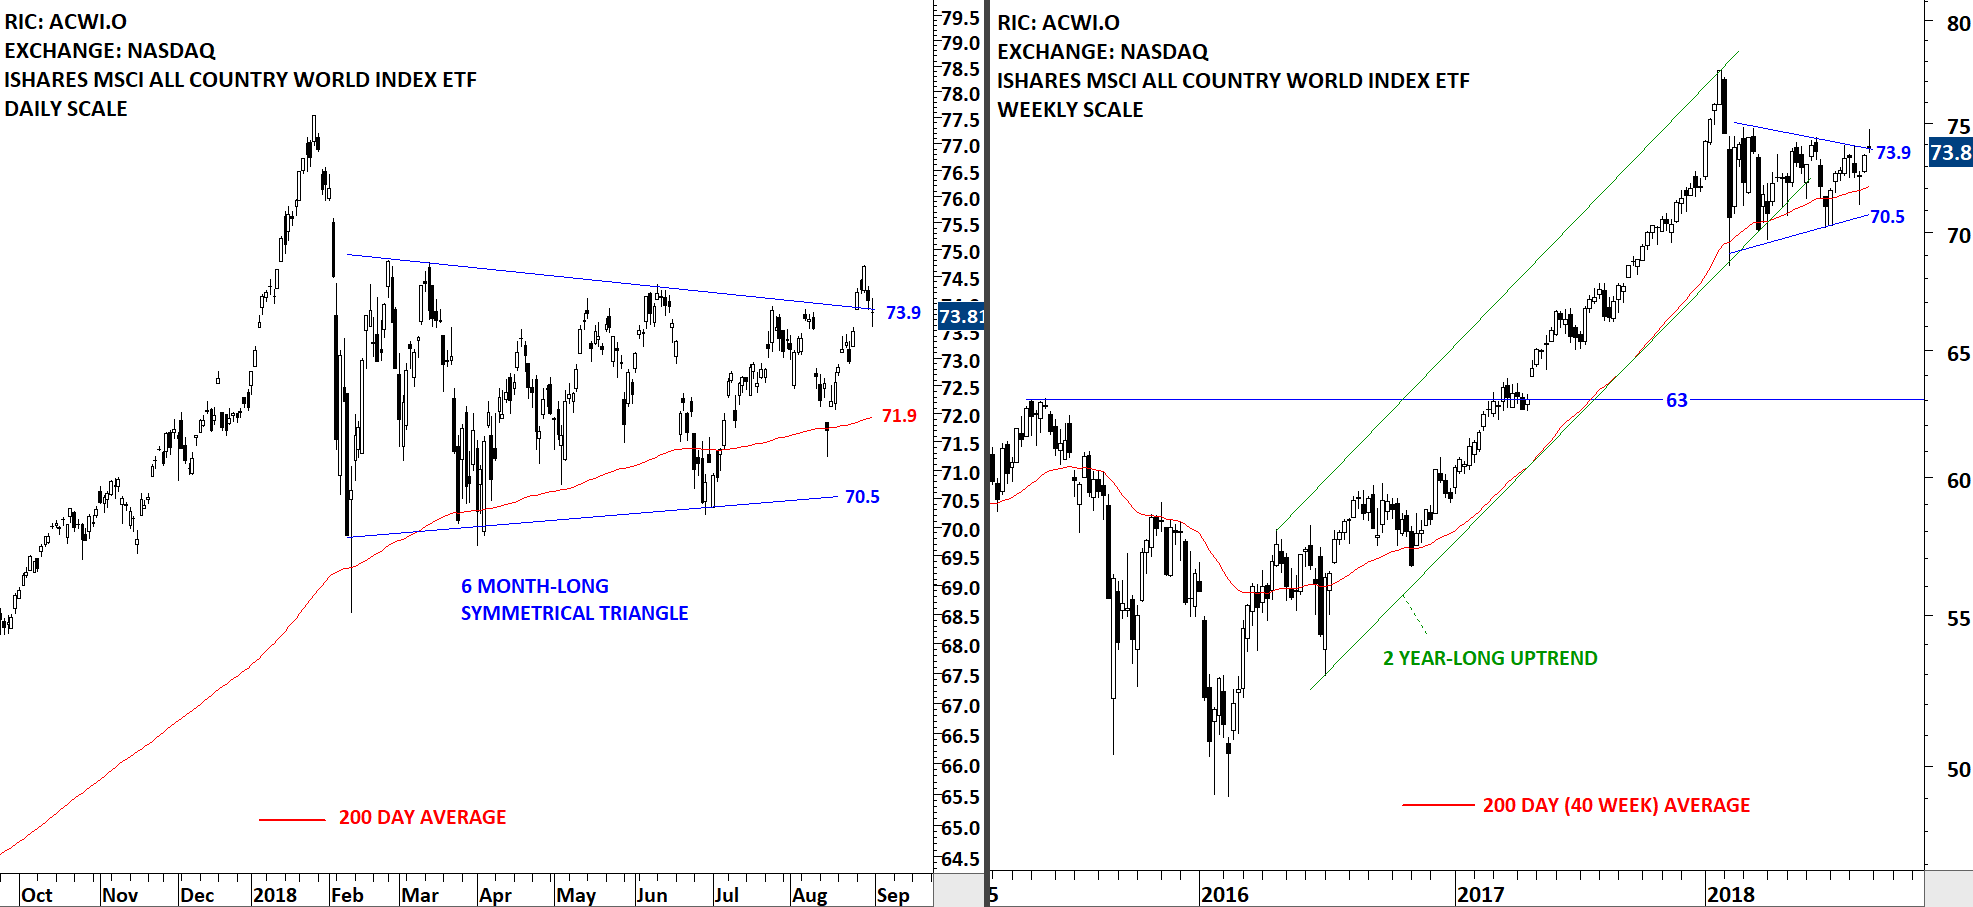
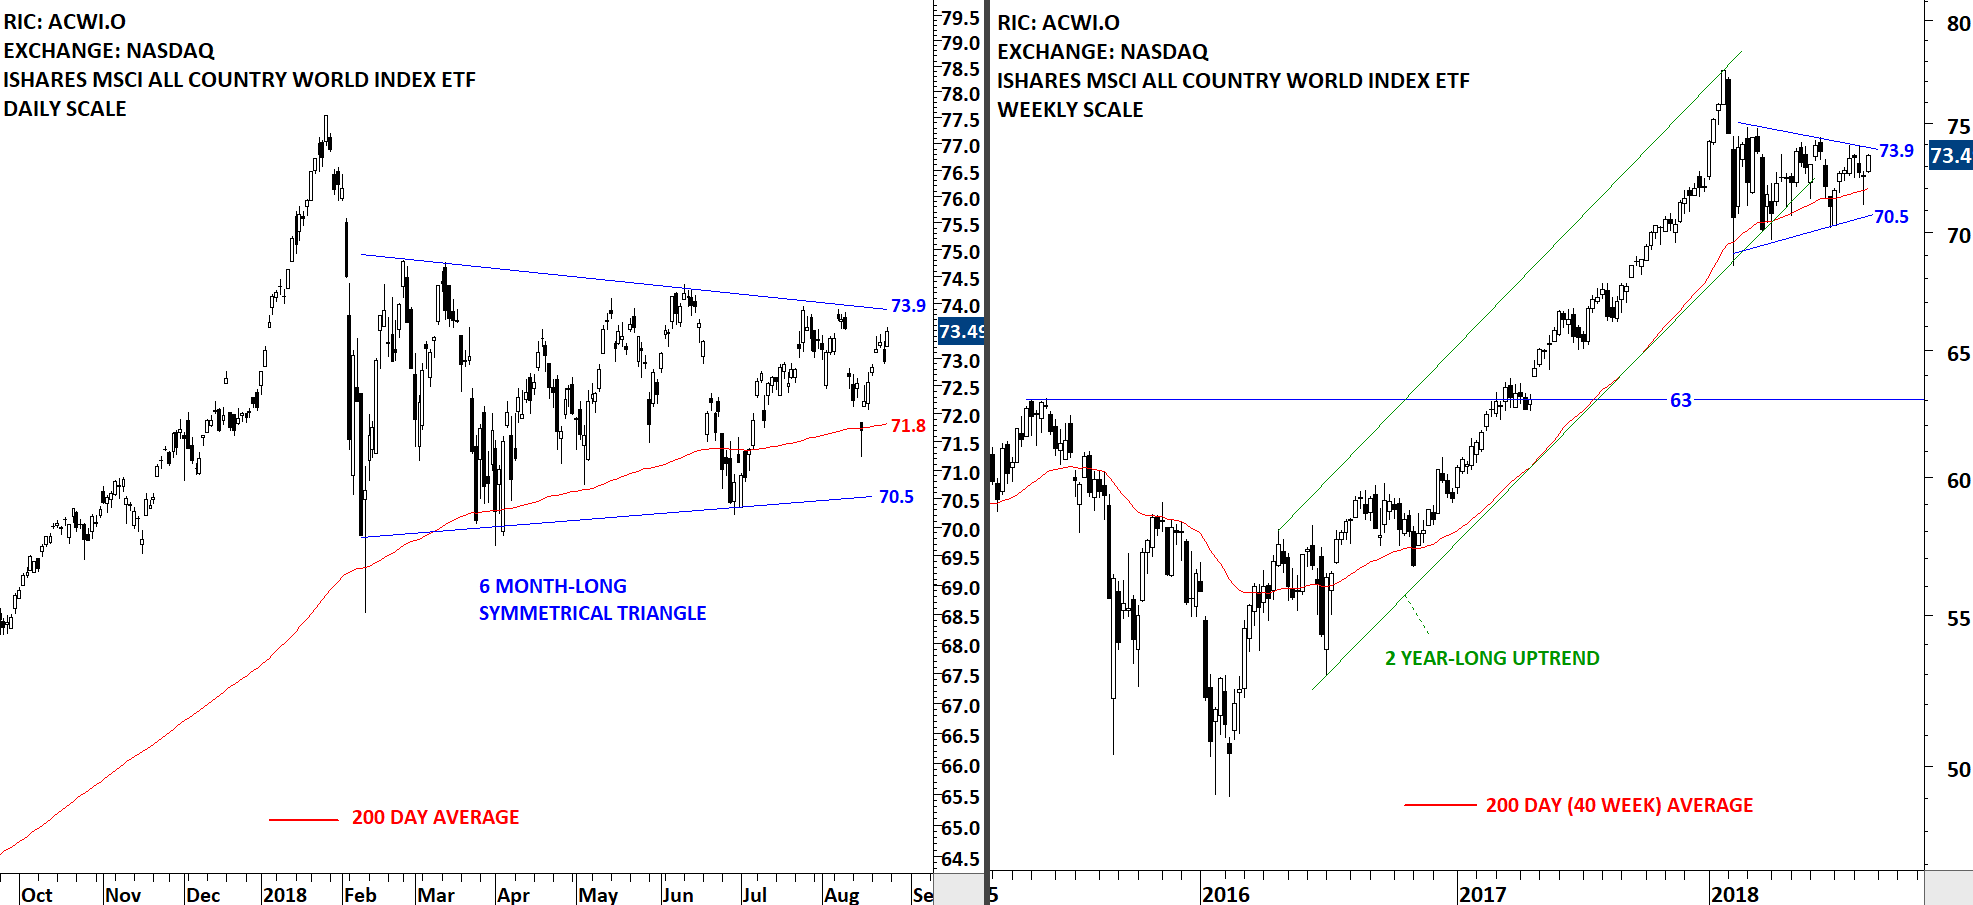
We are continuing our Member webinar series with another classical chart pattern; the symmetrical triangle. Live Webinar and Q&A with Aksel - Tuesday, September 25, 11am mountain. You can register here (Register for the Live Webinar)
REVIEW
Global equity markets performance as measured by the iShares MSCI All Country World Index ETF (ACWI.O) made another attempt this week to break out of its multi-month long sideways consolidations. The weekly close was at the high of the weekly candlestick. This week's price action is possibly a "secondary completion" of the symmetrical triangle chart pattern. Follow through in the following week can resume uptrend towards 2018 high levels.