DIAGONAL VS. HORIZONTAL BREAKOUTS
This content is for members only
This content is for members only
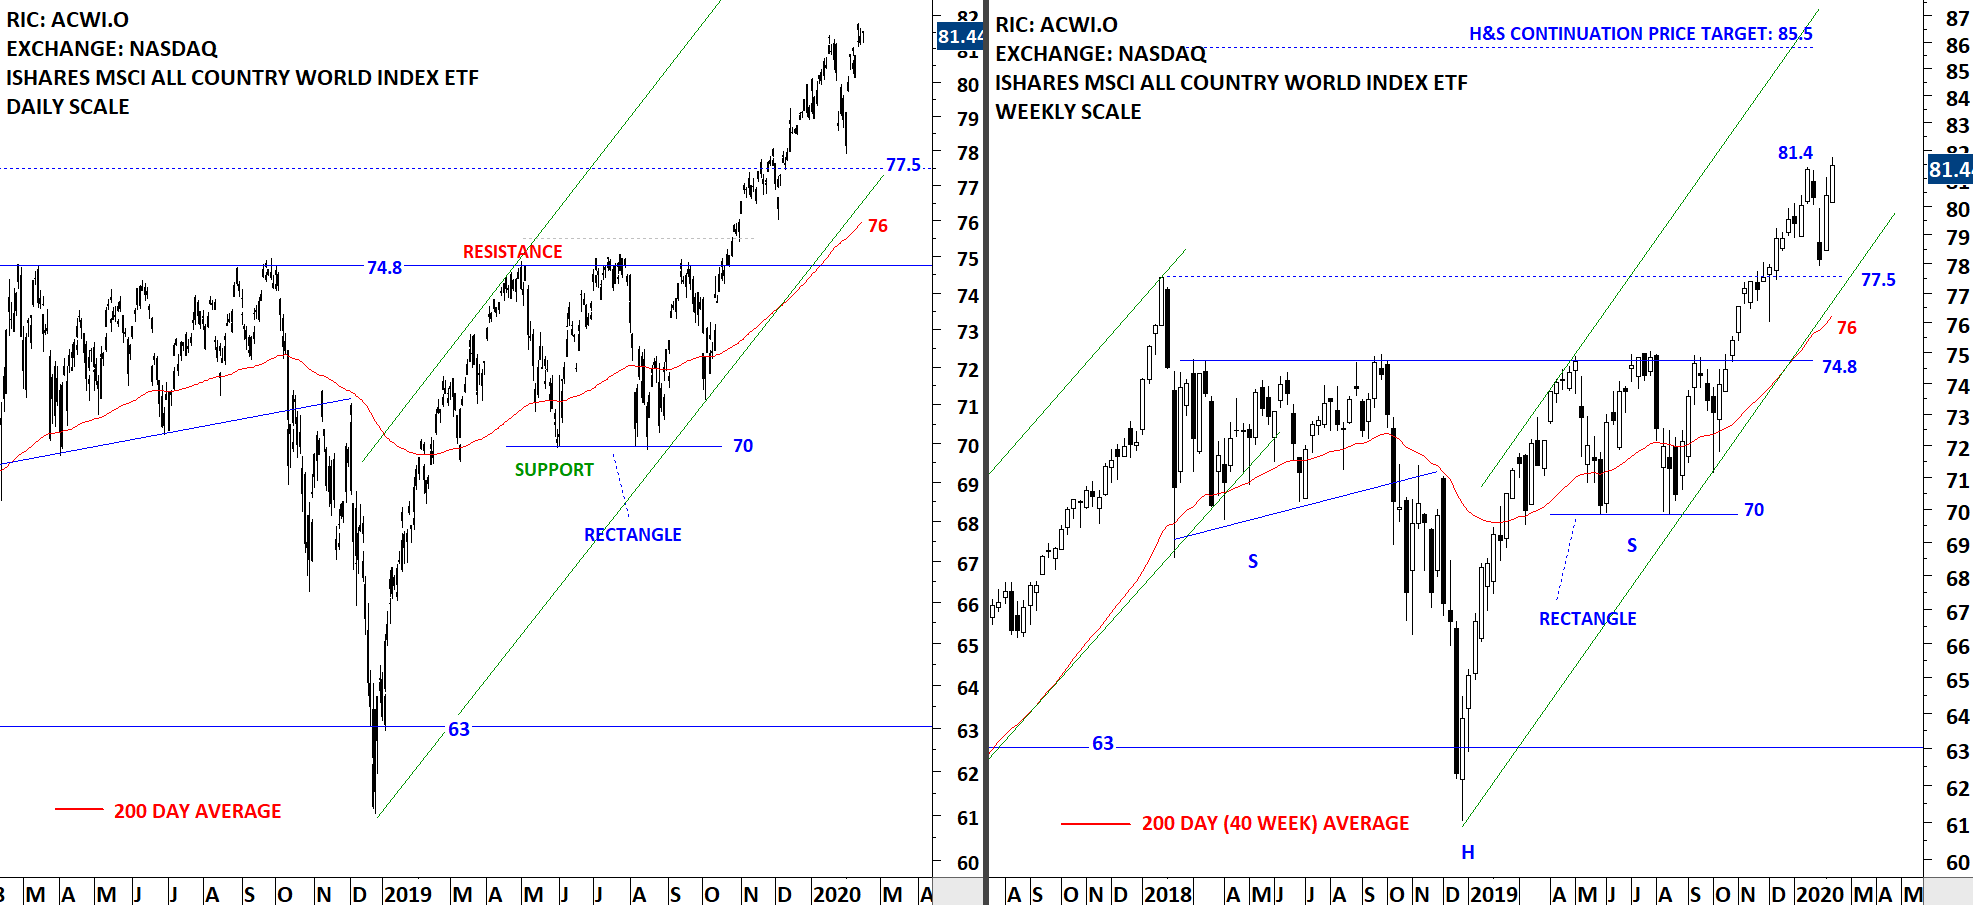
The benchmark for the Global equity markets performance, the iShares MSCI All Country World Index ETF (ACWI.O) failed at the minor high at 81.4 levels. The reversal started with a gap opening and took the ETF way below major support levels. The week closed off its lows but the weekly candlestick has done significant damage to short and long-term price charts. We might see a sharp rebound. 74.8 which is the horizontal boundary can act as resistance on the way up. Until I see price stabilizing above the 200-day average, I will monitor this chart for further weakness and volatility. Is a V-bottom reversal in the cards? A good example was in the beginning of 2019.

Every week Tech Charts Global Equity Markets report features some of the well-defined, mature classical chart patterns under a lengthy watchlist and the chart pattern breakout signals that took place during that week. Global Equity Markets report covers single stocks from developed, emerging and frontier markets, ETF’s and global equity indices. The report starts with […]
The benchmark for the Global equity markets performance, the iShares MSCI All Country World Index ETF (ACWI.O) found resistance at the minor high at 81.4 levels. The high at 81.4 is not yet broken on the upside and we can still see further sideways consolidation between 77.5 and 81.4. The 200-day moving average is still far from the price at 76.45 levels. Without much interpretation, we can conclude that the chart of of ACWI ETF is showing a clear uptrend. During pullbacks 76.45-77.5 area will act as support.

I start my research on Mondays and finalize by end of day Thursday. Friday is dedicated to putting all ideas to the report format. During the week I come across good setups and those are featured in the weekly report. However, there are those that pop during the week and is worth bringing to your attention before the week finalizes. Below are 5 additions to Tech Charts watchlist that may experience breakouts. These charts will also be included in the weekly update.
Every week Tech Charts Global Equity Markets report features some of the well-defined, mature classical chart patterns under a lengthy watchlist and the chart pattern breakout signals that took place during that week. Global Equity Markets report covers single stocks from developed, emerging and frontier markets, ETF’s and global equity indices. The report starts with […]
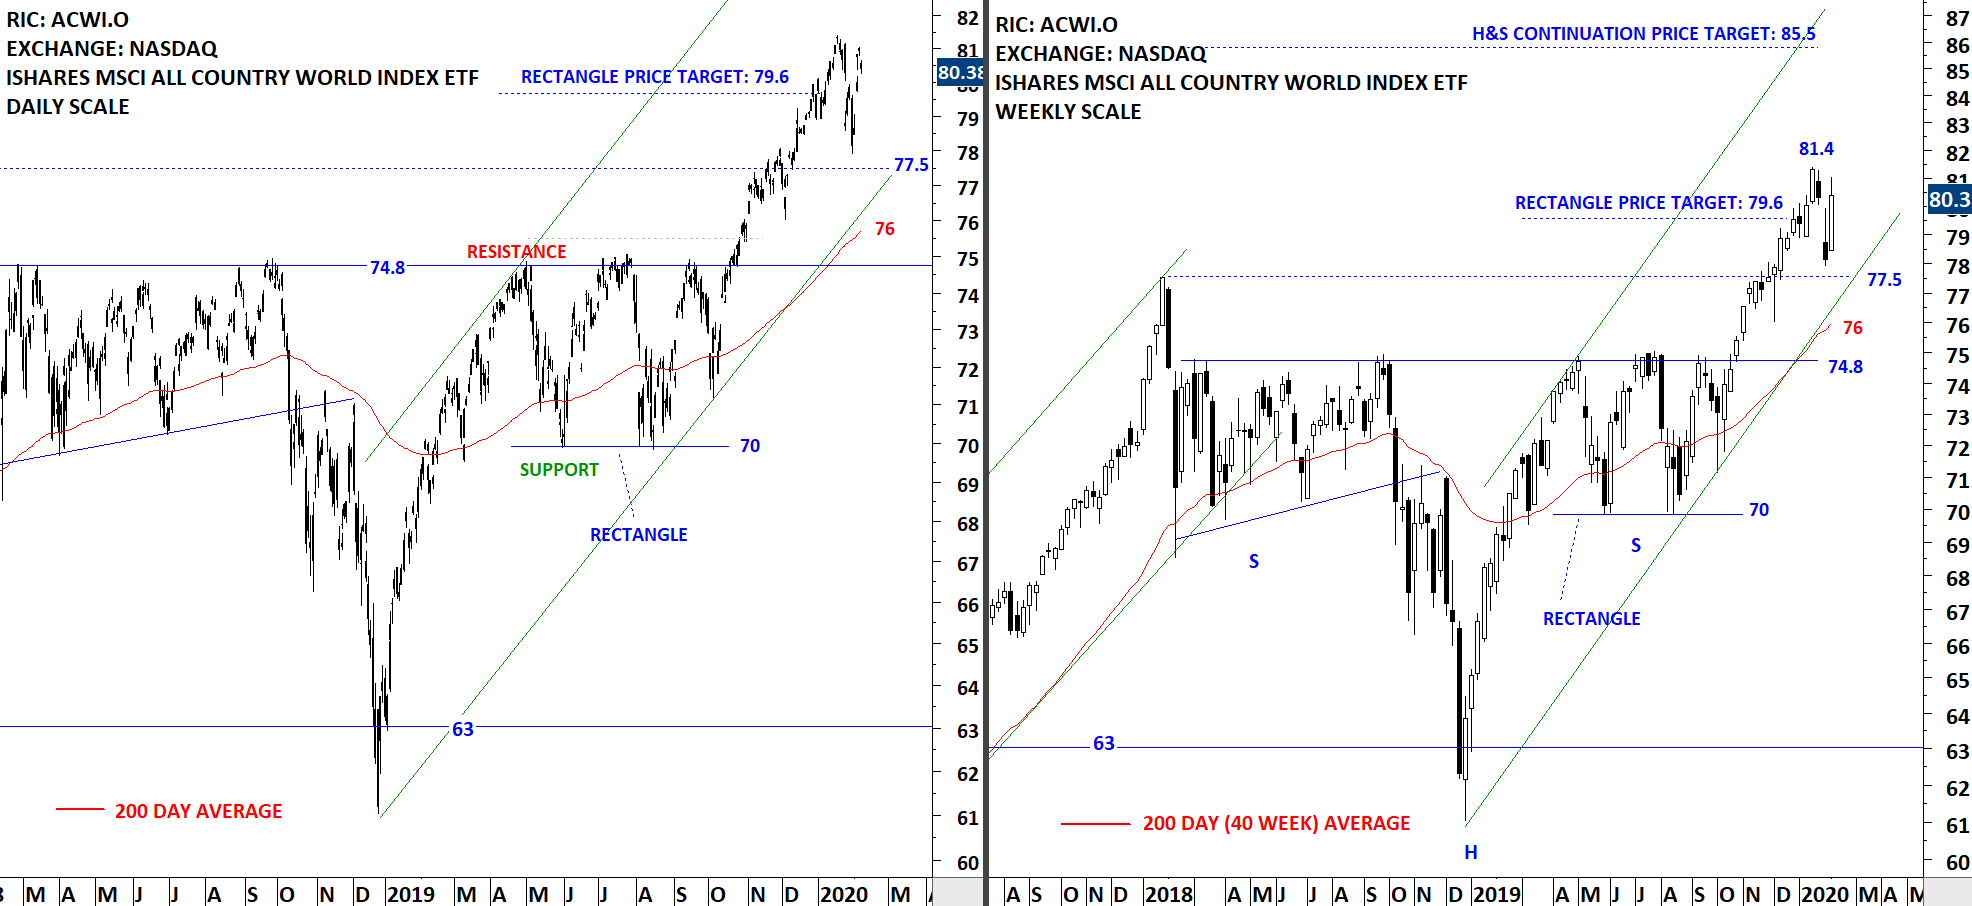
The benchmark for the Global equity markets performance, the iShares MSCI All Country World Index ETF (ACWI.O) tested the minor high at 81.4 levels. On the price chart last one month's price action seems like a pullback to the high seen in 2018 (77.5) and a continuation higher. ACWI ETF is still in a steady uptrend. The high at 81.4 is not yet broken on the upside and we can still see further sideways consolidation between 77.5 and 81.4. The 200-day moving average is still far from the price at 76 levels. Without much interpretation, we can conclude that the chart of of ACWI ETF is showing a clear uptrend.
I start my research on Mondays and finalize by end of day Thursday. Friday is dedicated to putting all ideas to the report format. During the week I come across good setups and those are featured in the weekly report. However, there are those that pop during the week and is worth bringing to your attention before the week finalizes. Below are 3 additions to Tech Charts watchlist that may experience breakouts. These charts will also be included in the weekly update.
Every week Tech Charts Global Equity Markets report features some of the well-defined, mature classical chart patterns under a lengthy watchlist and the chart pattern breakout signals that took place during that week. Global Equity Markets report covers single stocks from developed, emerging and frontier markets, ETF’s and global equity indices. The report starts with […]
The benchmark for the Global equity markets performance, the iShares MSCI All Country World Index ETF (ACWI.O) rebounded from support at 77.5 levels. On the price chart last one month's price action seems like a pullback to the high seen in 2018 (77.5). ACWI ETF is still in a steady uptrend. While this week's price was a strong rebound, unless the high at 81.4 is broken on the upside we can see further sideways consolidation between 77.5 and 81.4. The 200-day moving average is still far from the price at 76 levels.