Announcement:
Dear Tech Charts Members,
We had our member webinar on Thursday Dec 3rd. If you couldn't attend the live webinar, a recording will be available in the next few days. All members webinars and educational videos are posted under the page Educational Videos. Once it is uploaded to the page we will send an e-mail notification. Please feel free to ask any questions by e-mailing aksel@techcharts.net
REVIEW
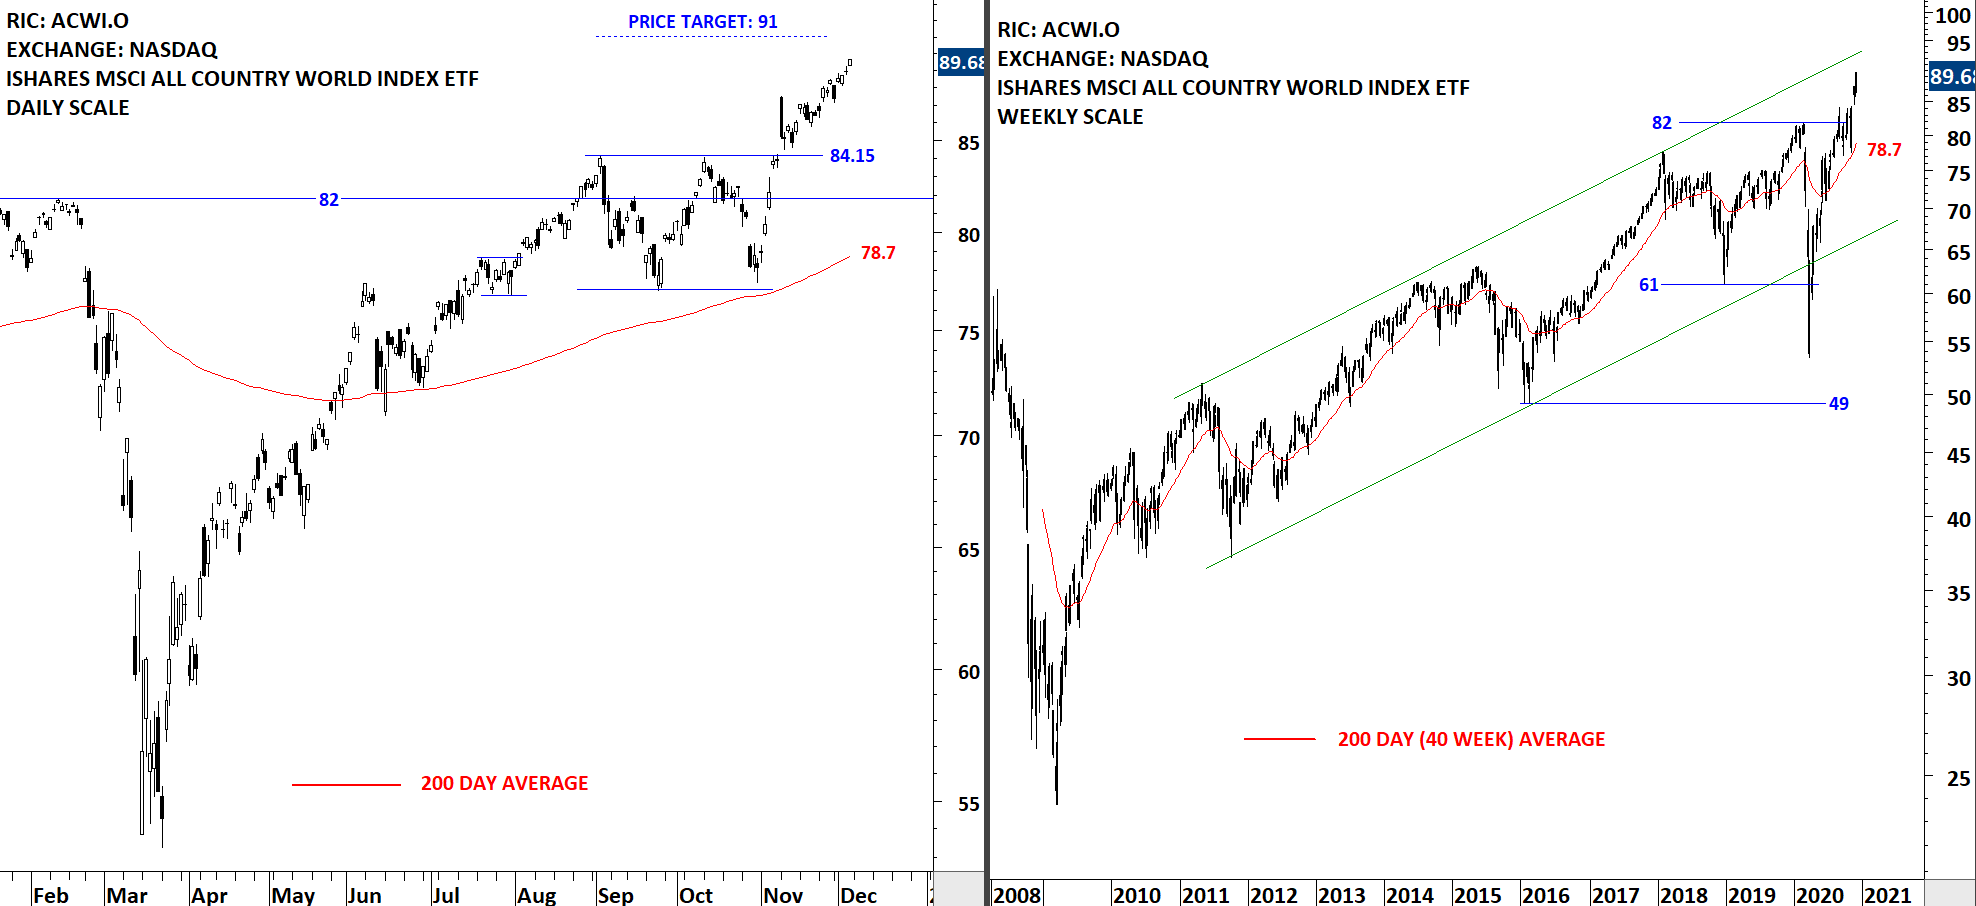
The benchmark for the Global equity markets performance, the iShares MSCI All Country World Index ETF (ACWI.O) resumed its uptrend after completing a rectangle chart pattern. Breakout took place above 84.15, the upper boundary of the rectangle which is now a short-term support. Possible chart pattern price target stands at 91 levels. During any pullback 84.15 will act as support. The 200-day moving average, which I utilize as a trend filter, is rising as well, now at 78.7 levels.
Read More

