
SYMMETRICAL TRIANGLE AND BTCUSD
Every week Tech Charts Global Equity Markets report features some of the well-defined, mature classical chart patterns under a lengthy watchlist and the chart pattern breakout signals that took place during that week. Global Equity Markets report covers single stocks from developed, emerging and frontier markets, ETF’s and global equity indices. The report starts with a review section that highlights the important chart developments on global equity benchmarks, commodities, currencies and cryptocurrencies that might be in focus. This blog post features from the review section BTCUSD. Please note that this is a monthly scale price chart and the November price action (last candle) is still not completed. I’m featuring this chart to show the levels BTC is testing and to draw attention to a possible outcome with symmetrical triangle breakouts.
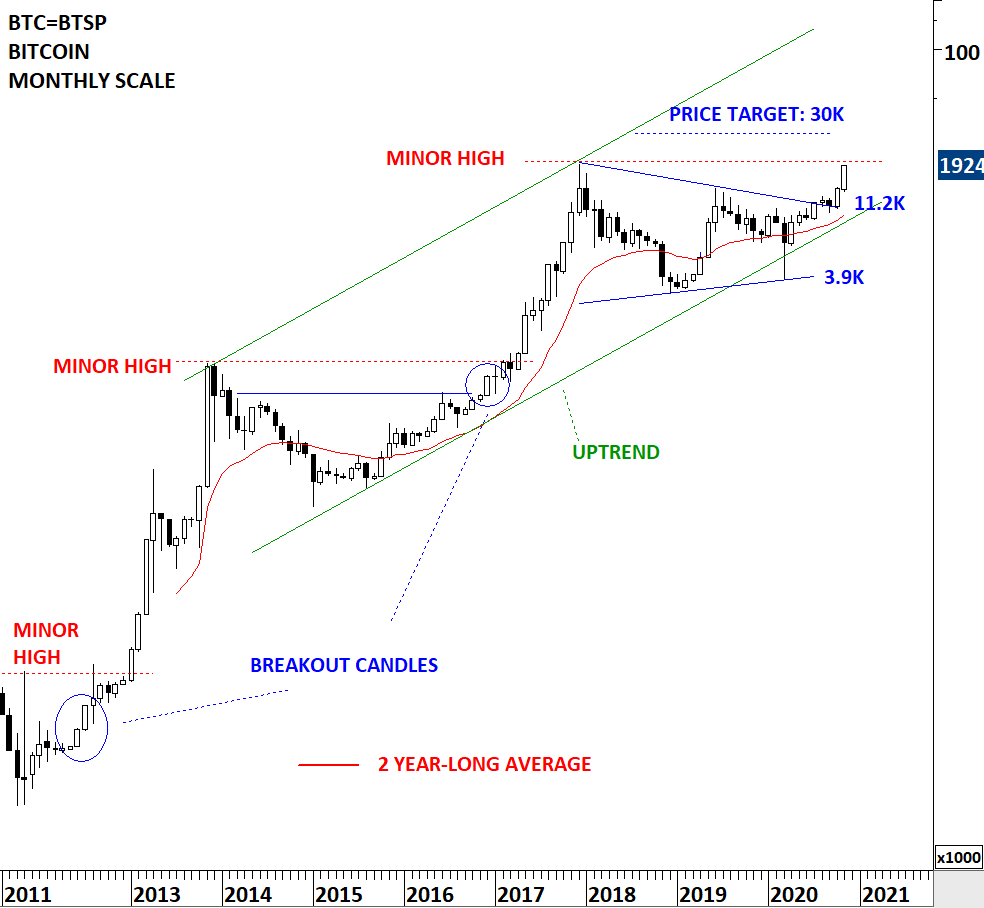
BTCUSD possibly completed a symmetrical triangle chart pattern on the long-term price chart. Symmetrical triangle is a chart pattern with diagonal boundaries. One difficulty with trading breakouts from diagonal boundaries is the fact that price, following the breakout can find resistance at the minor high. Whereas breakouts from chart patterns with horizontal boundaries usually clear all minor highs at the same time of the breakout.
Tech Charts Membership

By becoming a Premium Member, you’ll be able to improve your knowledge of the principles of classical charting.
With this knowledge, you can merge them with your investing system. In fact, some investors use my analyses to modify their existing style to invest more efficiently and successfully.

As a Premium Member of Aksel Kibar’s Tech Charts,
You will receive:
-
Global Equities Report. Delivered weekly.
-
Classical charting principles. Learn patterns and setups.
-
Actionable information. Worldwide indices and stocks of interest.
-
Risk management advice. The important trading points of each chart.
-
Information on breakout opportunities. Identify the ones you want to take action on.
-
Video tutorials. How patterns form and why they succeed or fail.
-
Watch list alerts. As they become available so you can act quickly.
-
Breakout alerts. Usually once a week.
-
Access to everything (now and as it becomes available)o Reports
o Videos and video series -
Multi-part webinar course. You learn the 8 most common charting principles.
-
Webinars. Actionable and timely advice on breaking out chart patterns.
For your convenience your membership auto renews each year.


