CRYPTOCURRENCIES – February 6, 2022
In this report I'm adding more range-trading opportunities. There are several pairs that are testing strong support areas. Those can experience rebounds. Charts are mostly on weekly scale.
In this report I'm adding more range-trading opportunities. There are several pairs that are testing strong support areas. Those can experience rebounds. Charts are mostly on weekly scale.
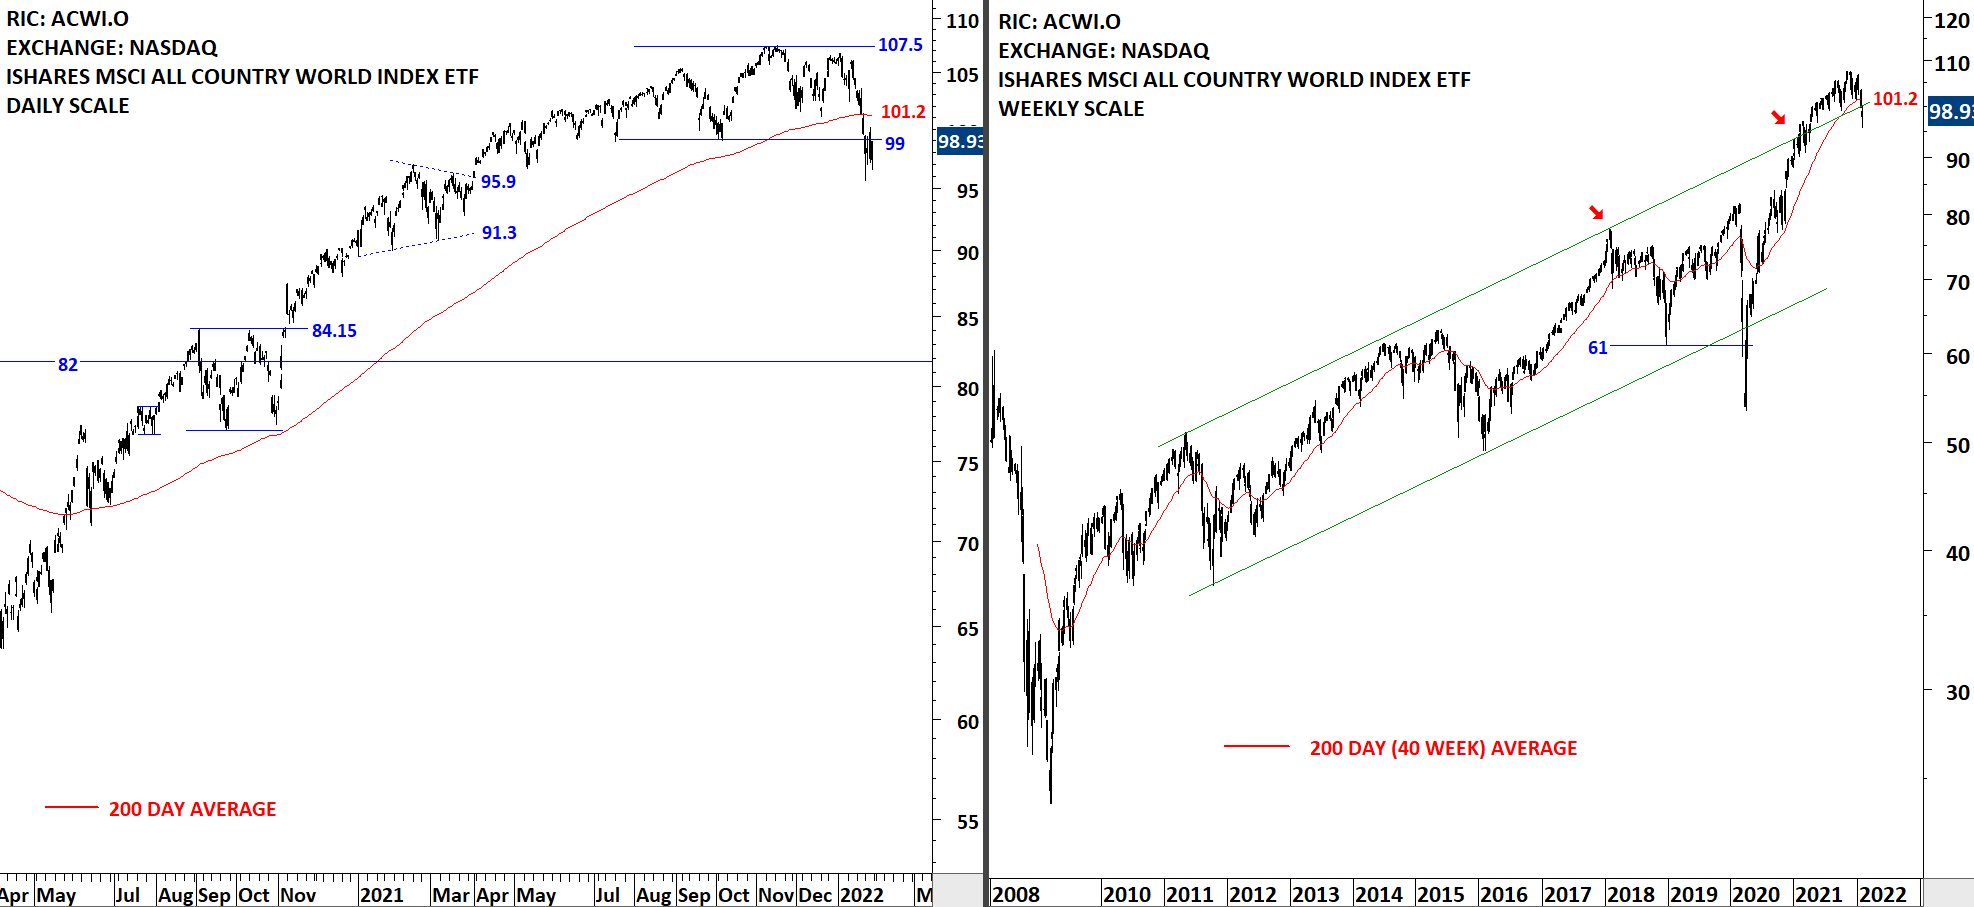
The benchmark for the Global equity markets performance, the iShares MSCI All Country World Index ETF (ACWI.O) is looking for direction around the 200-day average. The ETF recovered above 99 levels but still hasn't settled above the 200-day average. Latest price action changed my positive view on this ETF. 99-101.2 is the new resistance. Unless we see a quick recovery above this resistance area, I will expect lower prices in the coming weeks.

The benchmark for the Global equity markets performance, the iShares MSCI All Country World Index ETF (ACWI.O) not only breached the 200-day average but also broke down the horizontal support at 99 levels. Latest price action changed my positive view on this ETF. 99-101.2 area becomes the resistance. Unless we see a quick recovery above this resistance area, I will expect lower prices in the coming weeks.
Every week Tech Charts Global Equity Markets report features some of the well-defined, mature classical chart patterns under a lengthy watchlist and the chart pattern breakout signals that took place during that week. Global Equity Markets report covers single stocks from developed, emerging and frontier markets, ETF’s, select commodities, cryptocurrencies and global equity indices. Below […]
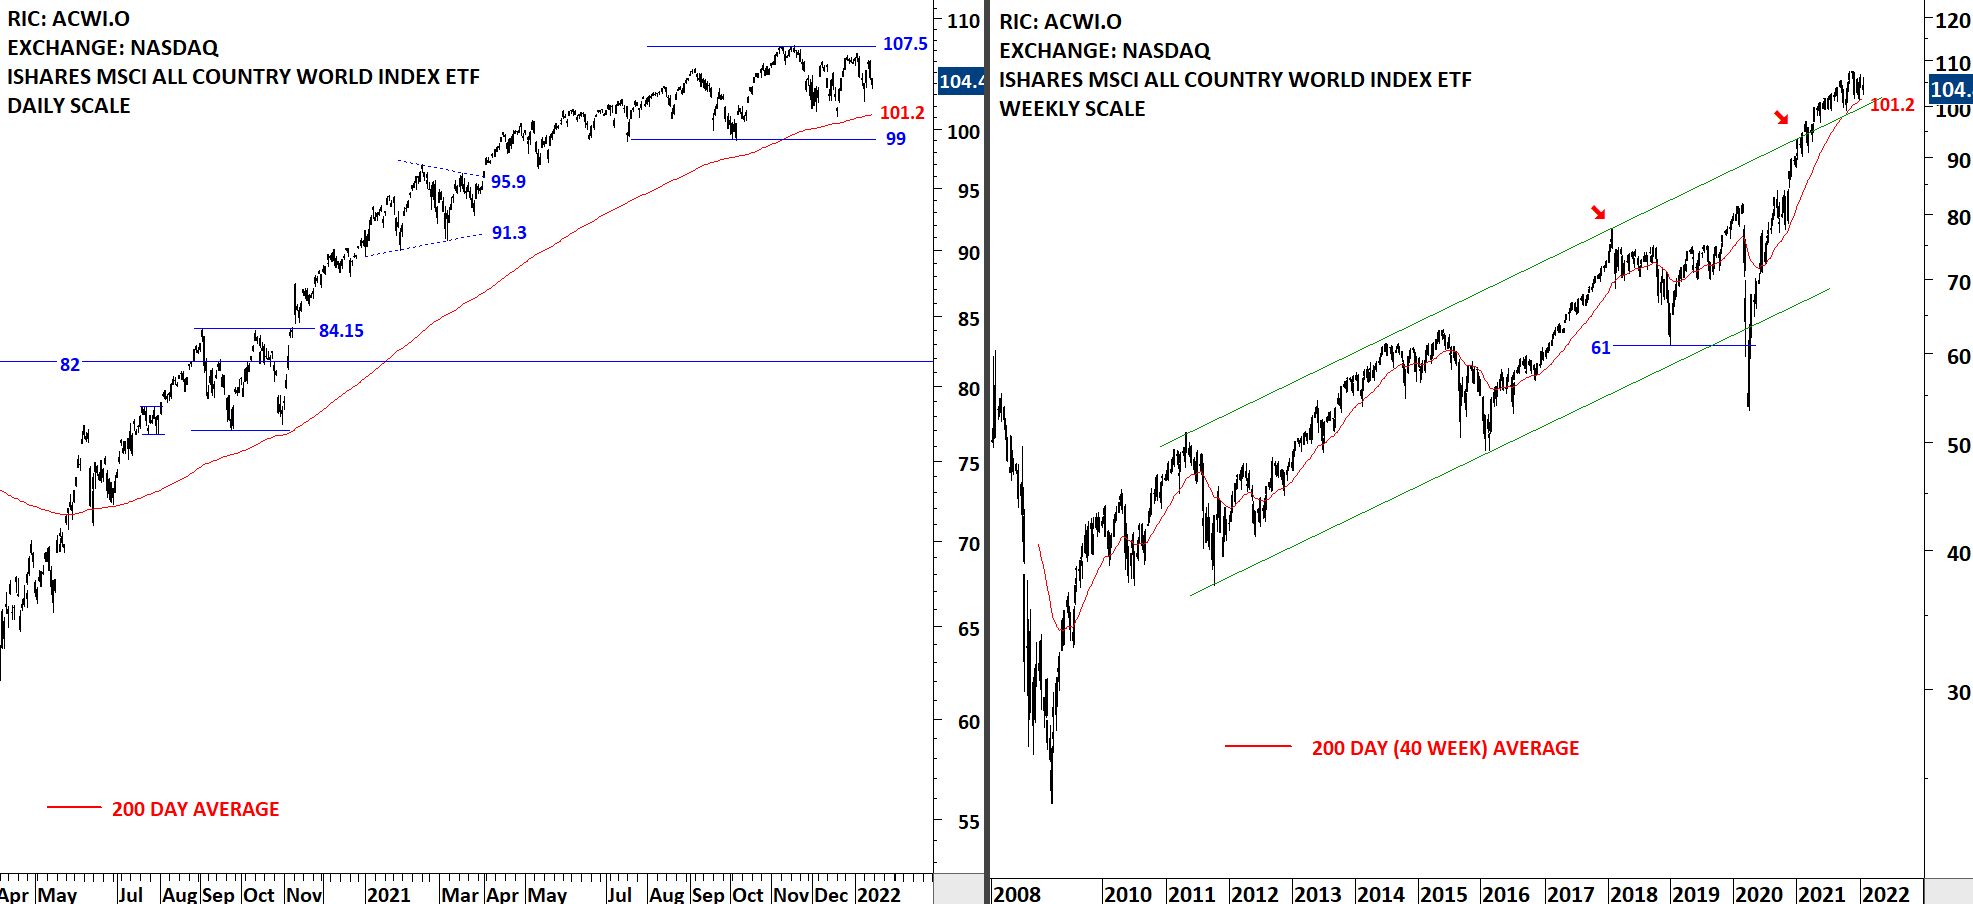
The benchmark for the Global equity markets performance, the iShares MSCI All Country World Index ETF (ACWI.O) is in an uptrend. The ETF found resistance at the minor high at 107.5. Friday's price action breached the 200-day average but still remains above the horizontal support at 99 levels. Breakdown below 99 will change my positive view on this ETF. I will monitor ACWI ETF in the following week to see if price will quickly recover above the 200-day average and remain in trading range between 99 and 107.5. Note; price is resting above the upper boundary of the trend channel on weekly scale price chart. Breakdown can result in a lager scale correction.

Every week Tech Charts Global Equity Markets report features some of the well-defined, mature classical chart patterns under a lengthy watchlist and the chart pattern breakout signals that took place during that week. Global Equity Markets report covers single stocks from developed, emerging and frontier markets, ETF’s, select commodities, cryptocurrencies and global equity indices. Tech […]
BTCUSD is trying to hold support at 41K. Failure to gain strength can result in some selling pressure in several other pairs. In this report I discussed two of my favorite, text-book descending triangle setups as well as some range-trading opportunities with bullish breakout setups.
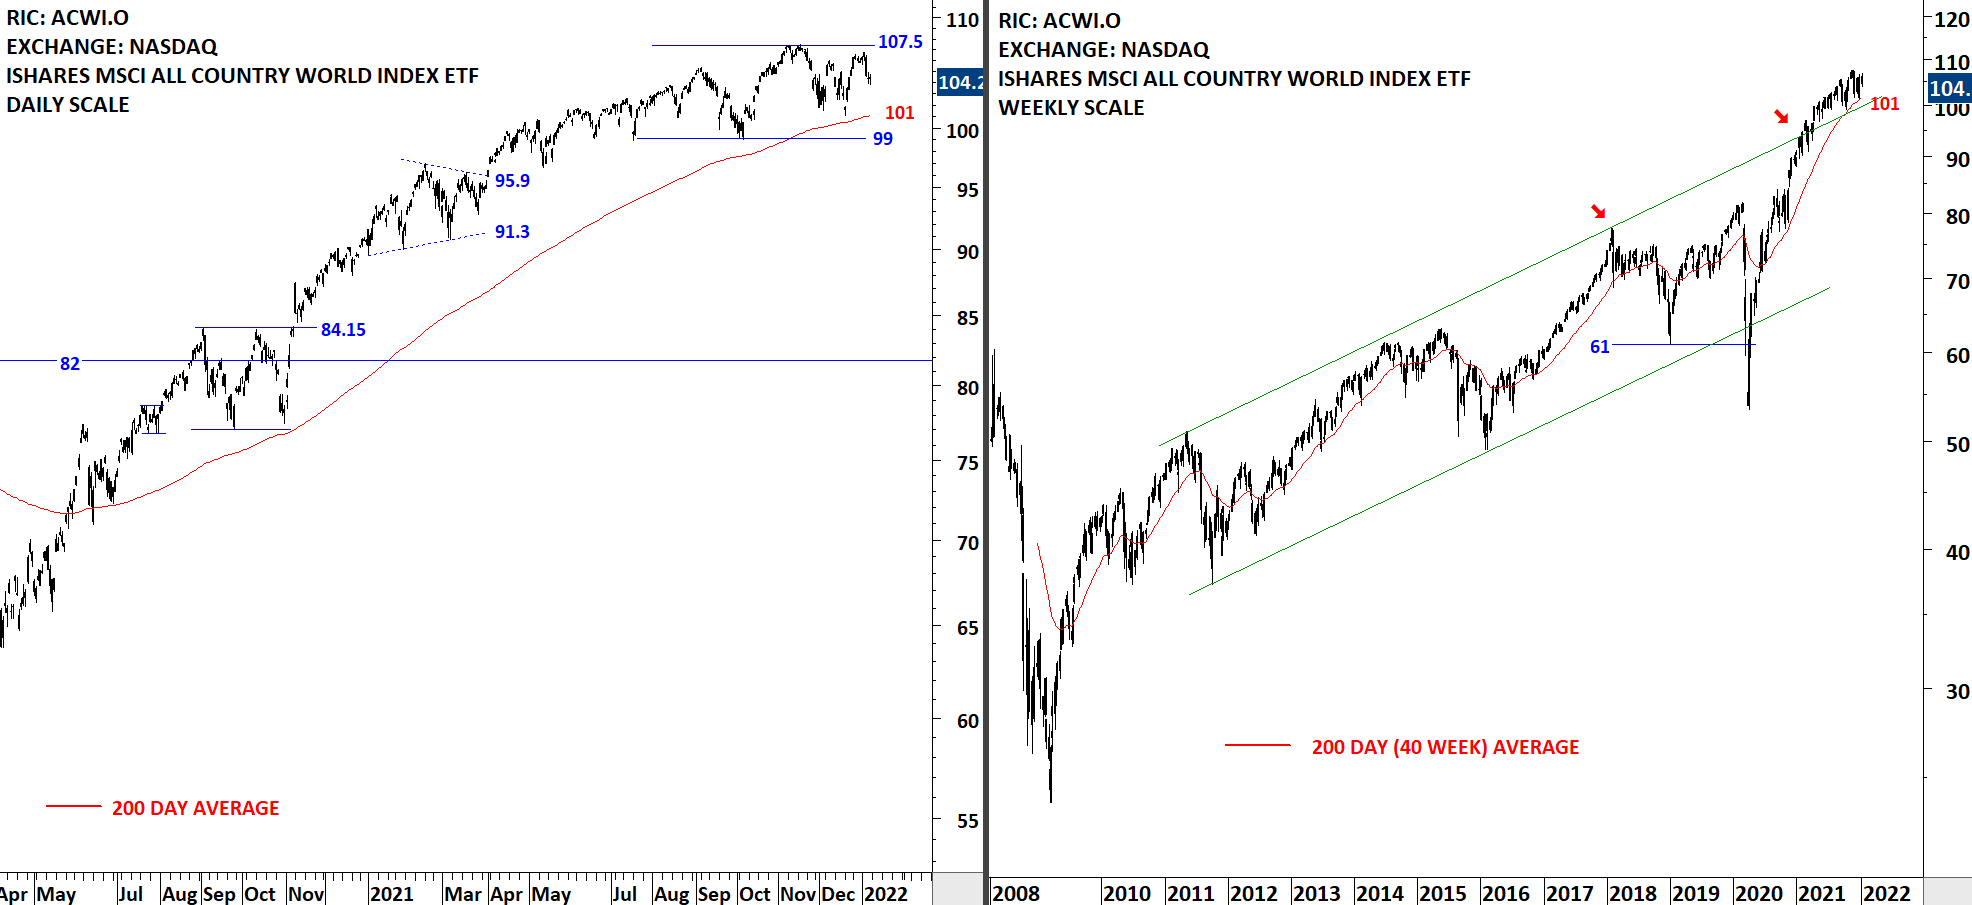
The benchmark for the Global equity markets performance, the iShares MSCI All Country World Index ETF (ACWI.O) is in an uptrend. The ETF found resistance at the minor high at 107.5. Price is consolidating between the 200-day average at 101.2 and the resistance at 107.5 levels. There is no top reversal chart pattern on both daily and weekly scale price charts.
The benchmark for the Global equity markets performance, the iShares MSCI All Country World Index ETF (ACWI.O) is in an uptrend. The ETF found resistance at the minor high at 107.5. Price is pulling back to the 200-day average at 101 levels Strong support area remains between 99 and 101. Resistance is at 107.5. No reversal chart pattern on both daily and weekly scale price charts.
Several pairs are showing signs of outperformance against BTC. Following charts are some that can complete well-defined consolidations and offer directional movement. The first chart is against USD and one of my favorite setup. Breakout from the text-book rectangle can offer significant upside potential.

